VISUAL PERCEPTION
VISUAL PERCEPTION
VISUAL PERCEPTION

Create successful ePaper yourself
Turn your PDF publications into a flip-book with our unique Google optimized e-Paper software.
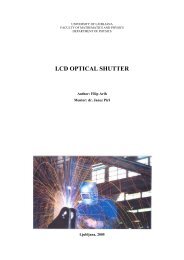
ABSTRACT<br />
University of Ljubljana<br />
Faculty of Mathematics and Physics<br />
<strong>VISUAL</strong> <strong>PERCEPTION</strong><br />
Author: Nina Jereb<br />
Adviser: Dr. Janez Štrancar<br />
In order to understand the mechanisms of visual perception, we start with a short presentation<br />
on the basic elements of the eye which are involved in the visual perceiving. The article talks<br />
about three main topics. In the first part, we introduce the bio-chemical model which<br />
describes how the retina transforms the light stimulation into an electrical pulse. Secondly, we<br />
show how interactions between photoreceptor cells, mediated by connections in the nervous<br />
system, can lead to information processing such as making distinction between two nuances.<br />
The third topic is color vision, where the relation between spectrum and color perception is<br />
discussed.<br />
Ljubljana, December 2005
CONTENTS<br />
1. INTRODUCTION................................................................................................................. 3<br />
2. STRUCTURE OF THE EYE................................................................................................ 3<br />
3. FROM PHOTON TO ELECTRIC PULSE........................................................................... 4<br />
3.1 Retina in the dark .................................................................................................. 4<br />
3.2 Retina in the light.................................................................................................. 5<br />
3.3 Can a human see a single photon? ........................................................................ 6<br />
3.4 From the receptor to the nerve .............................................................................. 7<br />
4. CONTRASTING NUANCES............................................................................................... 8<br />
4.1 Contrasting the border........................................................................................... 8<br />
4.2 Mathematical model.............................................................................................. 9<br />
4.3 A simple numerical model .................................................................................. 10<br />
5. COLOR VISION................................................................................................................. 12<br />
5.1 Cone absorbance and sensation of color ............................................................. 12<br />
5.2 Spectral power distribution ................................................................................. 13<br />
5.3 CIE chromacity diagram ..................................................................................... 14<br />
5.4 Matching functions.............................................................................................. 14<br />
5.6 Configuration of the receptor cells...................................................................... 15<br />
5.7 Color at twilight .................................................................................................. 17<br />
6. CONCLUSION ................................................................................................................... 18<br />
7. REFERENCES.................................................................................................................... 18<br />
2
1. INTRODUCTION<br />
Within the frame of recent development of optoelectronic devices for image capturing which<br />
is accompanied by many technological challenges, the structure and function of the human<br />
image capturing device – the human eye – became even more astonishing. While comparing<br />
the resolution, sensitivity and dynamical range of the human eye to those of recent digital<br />
cameras, one can conclude that the eye is still supreme over these optoelectronic devices. It is<br />
even more amazing when one thinks about the efficiency of the information flow from the eye<br />
to our brain that should actually translate the moving image to a flow of associations in real<br />
time, which at least for the current devices seems as a science fiction. Therefore, it is very<br />
important to understand the basic biophysical principles that govern the function of the human<br />
eye [1].<br />
Ongoing research has identified a long list of biological molecules and structures involved in<br />
neural signalling. Yet, we do not understand what most of this biological circuitry does. To<br />
this end, the function of vertebrate retina needs to be explored ([2], [3], [4]).<br />
2. STRUCTURE OF THE EYE<br />
The eyeball consists of a lens (cornea, crystalline lens) which refracts the light, and a detector<br />
(retina) on which the rays are focused. The basic components are shown on figure 1.<br />
Figure 1: Eye scheme [9]<br />
The cornea is a transparent part of the outer coat of the eyeball. This is the first and most<br />
powerful lens of the optical system of the eye. The highest dioptre of all the optical parts of<br />
the human eye comes from the fact that the light experiences great change in refraction index<br />
3
when passing from air into the curved cornea. The refraction index change is for example<br />
much smaller when the light passes from the pupil to the human lens and form the lens to the<br />
vitreous body.<br />
Figure 2: Scanning electron<br />
micrograph of the rods and<br />
cones of the primate retina<br />
[8]<br />
The retina represents the light detector of the eye, constructed<br />
from light-sensitive cells, rods and cones, pigment cells and<br />
neuronal cells that continue into the optic nerve which conducts<br />
visual impulses to the brain. The small area on the retina that<br />
provides our most central acute (and color) vision is the fovea.<br />
Rods (the yellow cells on figure 2) are specialized for detecting<br />
brightness, while cones (the short red cells on figure 2) perceive<br />
color. There are three kinds of cones: the ones that absorb long-<br />
wavelength light (red), the ones that absorb middle-wavelength<br />
light (green) and the ones that absorb short-wavelength light<br />
(blue).<br />
3. FROM PHOTON TO ELECTRIC PULSE<br />
When the light falls on the retina, receptors are stimulated and an electric signal is produced.<br />
In this section, I will talk about how the photon generates an electric pulse.<br />
3.1 Retina in the dark<br />
All the photon absorption in the rods and cones actually occurs in their membranes which<br />
contain channels for the passive transport of ions (red and rose object on figure 3a), pumps<br />
for the active transport of ions (orange object on figure 3a) and proteins that can capture the<br />
photons. When the retina is in the dark, the sodium and potassium channels for passive<br />
transport are opened. Because of the active transport, which pushes 3 Na + ions outside, while<br />
it lets only 2 K + ions inside, there are more positively charged ions outside than inside the<br />
cells [9]. The membrane is therefore negatively polarized and it maintains the potential of<br />
-65 mV (figure 3b).<br />
4
Figure 3: a) Receptor membrane in the dark: Na + and K + channels are opened. The retinal is not activated<br />
yet. b) Potential of the receptor membrane in the dark (right)<br />
3.2 Retina in the light<br />
Let us now have a look at what happens when a photon reaches the retina [9].<br />
Special proteins for absorbing light (gray object on the right of figures 3 and 5) called opsin<br />
are coupled to a set of molecules called retinal. The latest consists of many double bonds<br />
which can be excited after absorbing visual photons.<br />
When the photon reaches the retinal, it changes its conformation. Cis-retinal changes into<br />
trans-retinal (figure 4).<br />
Figure 4: Cis-trans isomerisation of retinal [9]<br />
Then, a chain of bio-chemical processes happens. The formation of trans-retinal activates<br />
opsin, conformational change of opsin activates a protein complex called transducin which<br />
5<br />
a) b)
activates an enzyme that breaks down cyclic GMP (Cyclic guanosine monophosphate).<br />
Lower concentration of cGMP closes Na + and K + channels (the rose and the red objects on<br />
figure 5a). While the channels of passive transport are closed, the sodium/potassium pump<br />
(the orange object on figure 5a) keeps on pushing only two potassium ions (K + ) into the cell<br />
for every three sodium ions (Na + ) it pumps outside, thus the positive charge is going out. The<br />
interior part of the cell membrane becomes still more negative, as shown on figure 5b. This<br />
way, we get a local perturbation which travels along the membrane till it reaches the synapse<br />
with a neural cell [9].<br />
Figure 5: a) The excited receptor membrane: a photon activates retinal, the bio-chemical process goes off,<br />
Na + and K + channels are opened and the membrane becomes hyperpolarized. b) Potential of the excited<br />
receptor membrane (right).<br />
3.3 Can a human see a single photon?<br />
The human eye is very sensitive but can we see a single photon? The answer is that the<br />
sensors in the retina can respond to a single photon. One photon hyperpolarizes the membrane<br />
by 1 mV. However, neural filters only allow a signal to pass to the brain to trigger a conscious<br />
response when at least about five to nine arrive within less than 100 ms. If we could<br />
consciously see single photons, we would experience too much visual "noise" in very low<br />
light, so this filter is a necessary adaptation, not a weakness [6].<br />
6<br />
a) b)
3.4 From the receptor to the nerve<br />
receptor<br />
(rod<br />
or<br />
cone)<br />
neuron<br />
Figure 6: Release of<br />
neurotransmitters at the<br />
synapse of the detector cell<br />
Perturbation on the receptor membrane causes the release of the<br />
neurotransmitters (figure 6) which cause the polarization of the<br />
neuron's membrane (figure 7).<br />
When the neuron is not excited, the channels for passive<br />
transport are closed (figure 7a). Then, the neurotransmitter<br />
opens the Na + channel (figure 7b) so the Na + ions go inside the<br />
cell and the potential becomes positive. The positive potential<br />
opens the K + channels which can consequently go out of the<br />
cell (figure 7c) [9]. The potential becomes negative again but<br />
with the opposite distribution of ions, which is finally<br />
equilibrated by Na/K pump. This way, we get an amplified<br />
pulse (figure 7d) which is the input in the neural network[2].<br />
a) b) c)<br />
d)<br />
Figure 7: Hyperpolarization of ganglion cell: a) Na + and K + channels are closed; b) The neurotransmitter<br />
opens the Na+ channel; c) Na + and K + channels are opened; d) Potential on the neuron membrane.<br />
The grater the light-intensity the shorter is the time between two photons absorbing on the<br />
receptor and the grater is the rate of firing. This means that the light intensity is frequency-<br />
coded. The basic unit of information transfer is the action potential, an electrical transient of<br />
about 1 ms duration, and 100 mV amplitude propagating with speeds ranging from 1 to<br />
100m/s and impulse frequencies up to approximately 1000 per second [1].<br />
Before the signal is transduced further to the optical nerve, it passes a complex neural network<br />
in the retina. It consists of a complex array of bipolar cells, ganglion cells and other<br />
interneurons. Together they form a neural network [2] that translates the signal from the rods<br />
7
and cones to the brain. As this neural network possesses very interesting properties, it will be<br />
discussed in the next section.<br />
4. CONTRASTING NUANCES<br />
In an eye, there are 130 million receptors but only 1 million nerve fibers transduce the optical<br />
information to the brain. Where does the information go?<br />
The retina compresses the information flow in order to increase the quality of the information<br />
and to provide some basic geometrical description already at the level of detector even before<br />
the information flow reaches the neural networks of the brain. The input into the brain is<br />
therefore not like a BMP and the retina is not simply a sheet of photocells. Much more<br />
complex processes are carried out before the signal is sent to the brain. Let us have a closer<br />
look at one of these processes.<br />
4.1 Contrasting the border<br />
An eye is not very efficient in distinguishing between two shades but it is very effective in<br />
contrasting the border region between two very similar areas.<br />
The figure below is formed of bands with uniform brightness that gradually increases from<br />
left to right. Even though each band is completely uniform, it gives an impression that the left<br />
edge is brighter than the right one. This is the effect of contrasting on the border.<br />
Figure 9: uniform bands which appear to have intensity variations that enhance the contrast at the border<br />
The distinction between two similar shades is enabled due to the inhibitory and excitatory<br />
connections between the neurons in the retina. The pattern of illumination on the retina is<br />
8
transformed into a pattern of perceived brightness, which is contrasted on the border between<br />
two shades.<br />
4.2 Mathematical model<br />
Let us consider an array of neurons that are laterally connected (figure 10) [1]. The properties<br />
of a lateral inhibition network can be described mathematically by the following equation<br />
∑∫<br />
0<br />
I ( t)<br />
= I ( t)<br />
± λ K ( t − t')<br />
I ( t')<br />
dt'<br />
(1)<br />
i<br />
i<br />
k<br />
Figure 10: Schematic diagram of an array of photoreceptors, showing lateral connections between neighboring<br />
neurons.<br />
0<br />
As it is explained in the section 4.3 the light intensity is frequency-coded. Therefore, ( t)<br />
represents the frequency of firing at the entrance of the neural network (the input on the i-th<br />
neuron caused by the light falling on the receptor).<br />
Ii(t) is the enhanced/reduced frequency of firing (the output of the i-th neuron in the array),<br />
and Kik represents the effect of synaptic connection between the i-th neuron and its neighbors.<br />
λ is a constant that represents the strength of the synaptic inhibition/excitation relative to the<br />
magnitude of the direct excitation. The sign is negative for the inhibitory connections and<br />
positive for the excitatory connections.<br />
If we consider that the illumination is steady, we can neglect the time dependency. In this<br />
case, the problem is reduced to a linear equation [1].<br />
0<br />
I = I ± λ<br />
i<br />
i<br />
This system of linear equations is used in the next section for making a model that will help<br />
us understand why a uniform area might appear to have brightness variations as on figure 9.<br />
9<br />
ik<br />
∑<br />
k<br />
K<br />
ik<br />
I<br />
k<br />
k<br />
(2)<br />
I i
4.3 A simple numerical model<br />
Here is proposed a simple model that describes how we perceive brightness in the case of<br />
steady illumination by an edge of light. Let us take that we have an infinite dark area on the<br />
left and an infinite bright area on the right (figure 12a). We will explore how inhibitory and<br />
excitatory connections influence the nuance that is finally “seen”.<br />
In the retina, the receptors are placed in a plan but in our case a one-dimensional model is<br />
good enough. We consider a linear array of receptors: the left ones are in the dark and the<br />
right ones in the light.<br />
A neuron sends out dendrites by a random walk, thus the probability that the i-th neuron is<br />
connected to the k-th neuron is greater the greater the distance dik is. A good assumption for<br />
this distribution is a Gaussian fall off<br />
2 ⎛ d ⎞<br />
⎜ ik<br />
K ⎟<br />
ik ∝ exp<br />
⎜<br />
− 2 ⎟<br />
, (3)<br />
⎝ σ ⎠<br />
where dik represents the dimensionless distance between two cells (counting cells along the<br />
retina) and σ rapresents the variance of the Gaussian distribution.<br />
This model is just an illustration so the parameters λ and σ are simply invented. The strength<br />
of synaptic inhibition / excitation is taken to be λ = 0.<br />
1and<br />
σ = 3 . Another simplification is<br />
that only connections between the first 6 neighboring neurons in a grid are taken into<br />
consideration. By solving the system of equations (2) we come to an interesting result, which<br />
associates to apparent brightness variations that can be observed on figure 9.<br />
Let us consider only inhibitory connections (green pattern on figure 11). We see that cells on<br />
the far right of the edge are brightly lit (gray pattern on figure 11) and would be firing<br />
maximally except for inhibition by their neighbors which are also brightly illuminated. Thus,<br />
the firing frequency is below the maximum for isolated cells. Cells on the right, but closer to<br />
the boundary, are less inhibited because some of their neighbors are in the dark. Their outputs<br />
are at higher frequency. Cells on the left side of the boundary are in the dark but are also<br />
inhibited by their neighbors in the light, so that firing frequency is depressed. Cells on the far<br />
left are almost not inhibited. This way, we get an enhanced contrast on the border. Some<br />
10
animals really have neurons that make only inhibitory connections, for example in the eye of<br />
the horseshoe crab, Limulus [1].<br />
In general, neurons in the retina make both excitatory and inhibitory connections, which<br />
prevents a considerable decrease of brightness of the white area. The consequence is that the<br />
perceived brightness near the border oscillates (red pattern on figure 11).<br />
Figure11: Effect of inhibition (green pattern) and inhibition + excitation (red pattern) in the retina. I0 represents<br />
the excitatory input.<br />
We can see that lateral inhibition enhances the<br />
contrast at the edge but the perceived brightness<br />
away from the edge is reduced (figure 12b). By<br />
adding some excitatory connections the perceived<br />
brightness is less diminished and the contrast on<br />
the edge is still enhanced (figure 12c). Note that<br />
some bands of intensity variations are created. This<br />
explains the famous psychophysical phenomenon<br />
of Mach bands [10]. (Mach Bands - The optical<br />
illusion that enhances contrast between regions of<br />
varying intensity by creating dark and light lines<br />
at the border of the contrasting areas.)<br />
Figure 12:<br />
a) Uniform, steady illumination by an edge of light<br />
b) Model of perceived pattern considering inhibitory connections.<br />
c) Model of perceived pattern considering inhibitory and excitatory connections.<br />
11
This model is a linear network in which the frequency of an individual neuron firing is<br />
linearly dependent on the firing frequencies of its neighbors. Already in a very simple model<br />
that considers only 6 neighboring cells, we can explain some basic properties of this neural<br />
network such as perception of brightness variation across the border between dark and bright<br />
regions. However, several properties have not been considered, as time dependence and even<br />
nonlinear relation between input and output.<br />
5. COLOR VISION<br />
“…color means pigment to an artist, an internal perception to a psychologist, the response of<br />
a neural system to a physiologist, an aspect of radiant energy to a physicist, and a property of<br />
objects and lights to a man in the street.” Danger [10]<br />
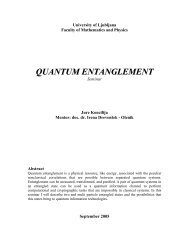
5.1 Cone absorbance and sensation of color<br />
The sensation of color arises primarily from different absorptions of the receptors. Cones are<br />
mainly responsible for color vision while rods are not sensitive to color. The three classes of<br />
color detectors have been corroborated by spectrophotometric measurements on single cones,<br />
for example in the goldfish retina [4]. Three kinds of cones correspond to the three different<br />
absorption maximum, as shown in figure 12. Thus, each class of cone absorbs photons in a<br />
band about its maximum (R:575 nm; G:535 nm; B:445 nm). The electrical output of each<br />
cone depends upon the number of photons absorbed, and the sensation of color comes about<br />
from the particular mixture of neural outputs originating from each cone.<br />
Figure 13: Approximate absorption spectra for “red”, “green” and “blue” cones.[7]<br />
12
E.g.: If mainly the “red” cones are excited, the eye perceives red, if mainly the “green” cones are<br />
excited, the eye perceives green, and if mainly the “blue” cones are excited, the eye perceives blue.<br />
Other colors are obtained if two or three different types of cones are excited simultaneously. If blue<br />
and green cones are excited, the impression of color is cyan. If blue and red cones are excited, the<br />
impression of color is magenta. If red and green cones are excited, the impression of color is yellow.<br />
Note that heights of the curves on figure 13 are in arbitrary units. In fact, the three types of<br />
cones have different sensitivity (different absolute heights of absorption curves) but this is not<br />
directly related to the perception of the color. Before reaching the brain, the signal is still<br />
filtered by the neural network [3]. Thus, from the absorption functions we cannot find out<br />
which color matches a certain mixture of lights. What we need to connect the spectra of the<br />
light with the resulting color are the color matching functions (section 5.4).<br />
5.2 Spectral power distribution<br />
Light may be precisely characterized by giving the power of the light at each wavelength in<br />
the visible spectrum. The resulting spectral power distribution (SPD) contains all the basic<br />
physical data about the light. It serves as the starting point for quantitative analyses of color.<br />
An example of SPD of light coming from common objects is shown on figure 14.<br />
Figure14: An example of the spectral power distribution of light from common objects [7]<br />
From here, we can predict the color that is perceived by the human eye but the opposite<br />
proceeding is less accurate. The eye perceives different inputs as the same color [7]. E.g.: The<br />
mixture of green and red light (in right proportions) stimulates the receptors in the same way<br />
as the yellow light does, so one sees yellow in both cases.<br />
13
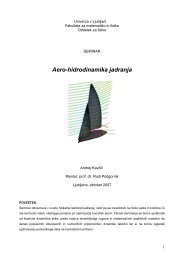
5.3 CIE chromaticity diagram<br />
All the colors that can be perceived by the<br />
human eye are represented in the CIE<br />
chromaticity diagram (figure 15). Along the<br />
outside curve of the chromaticity diagram we<br />
have the rainbow spectrum of pure spectral<br />
colors. We know that the spectral colors can<br />
be one-to-one correlated with light<br />
wavelength. The bottom line represents the<br />
purples. They can only be produced by mixing<br />
red and blue lights. [7]<br />
A useful propriety of the chromaticity diagram<br />
is that we can produce any color that lies<br />
between two different colors by mixing them in right proportions. Eg: by mixing green and<br />
blue lights we can get yellow light (figure 15).Thus, by mixing three different lights we can<br />
produce any color that lies in the triangle between them. By mixing red, green and blue<br />
lights we can cover a great part of visible colors, so these three colors are called “the<br />
primary colors”.<br />
Note that we are talking here about additive color mixing. It should not be confused with the<br />
subtractive color mixing, which corresponds to mixing pigments. We will never obtain a<br />
yellow by mixing green and red paint.<br />
5.4 Matching functions<br />
While the spectrum of the light coming from an object is well defined, it is not trivial to<br />
define the color. In fact, there are different systems describing the color [5]. One of the<br />
possibilities is to use three primary colors like blue, green and red as vectors with which to<br />
map color space. We can represent the color with 3 coordinates a, b and c:<br />
C = aR + bG + cB , (4)<br />
14<br />
Figure 15: The CIE chromaticity diagram [7]
where R, G and B represent the primary colors red, green and blue. a, b and c are the<br />
intensities of the primary colors. Later in this section, we will try to find out what is the<br />
relation between the spectrum and the matching a, b and c coordinates.<br />
In fact, the relation between the SPD of the falling light and the resulting color sensation is<br />
rather complex and the subjectivity of human factor cannot be avoided as the color sensation<br />
can be measured by asking a human subject what color appears to match a spectral mixture of<br />
lights [7].<br />
By making several experiments, color matching functions were defined (figure 16). If the<br />
spectrum of a color is weighed by these functions, the coordinates a, b and c can be<br />
calculated. E.g.: to calculate the coordinate a we multiply the function bλ (it is drawn on figure<br />
16) and the spectrum. Then, we integrate it to get a value. We do analogue for b and c for<br />
green and red color intensity.<br />
Figure 16: The RGB matching functions [7]<br />
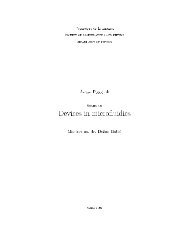
5.6 Configuration of the receptor cells<br />
Even though we might not even notice it in our daily life, the color perception is limited only<br />
to the central vision. The peripheral vision is better for perceiving brightness variation and<br />
movement. This is a consequence of cones and rods distribution, as it will be explained<br />
further on.<br />
15
Figure 17: Rod and cone density on the retina [7]<br />
As we can notice on figure 17, the cones are very concentrated in the central part (the fovea),<br />
and there are almost none of them in the periphery [7]. This is why we cannot distinguish<br />
colors with the peripheral vision.<br />
There are many rods (120 million) so they can cover wide angle vision (figure 17). Because of<br />
their numerousness they make a lot of neural interconnections, therefore they are more<br />
adapted to contrasting and detecting movement than cones. Their role is to perceive<br />
brightness, so they have to be very sensitive to light. If we drew the absorption spectrum, the<br />
peak would be much higher compared to the cones. Cones are much less light sensitive and<br />
this is why we do not see colors at twilight.<br />
There are fewer cones in the retina – only 6 to 7 millions. They are concentrated in the central<br />
yellow spot known as the macula. The central part of the macula is the fovea, where there are<br />
no rods. The ratio between “green” cones, “red” cones and “blue” cones is 64 : 32 : 2.<br />
Figure 18: Cone configuration<br />
16
Note that the “blue” cones are less numerous and mostly found outside the fovea (figure 18).<br />
The reason is that the refractive index for blue light is enough different from red and green<br />
making the blue image slightly out of focus when red/green image is in focus (due to<br />
chromatic aberration) demanding lower angular resolution for blue image. The consequence<br />
of the lower number of the “blue” cones is the apparent lower intensity of the perceived blue<br />
colors in comparison with green and red color [7].<br />
5.7 Color at twilight<br />
At low light levels, we do not distinguish color. Here, the rods play a more important role, as<br />
they are more light sensitive. When the ambient light level changes, there are apparent shifts<br />
of color.<br />
Figure 19: The spectral luminous efficacy<br />
for human vision [7]<br />
The eye has night and day adapted vision [7].<br />
Scotopic vision is adaptation to the dark-light<br />
conditions. On figure 19, we see the spectrum of<br />
luminous efficacy for both day and night vision.<br />
We notice that night-adapted vision peaks at<br />
shorter wavelengths (λ=507nm→green) and it has<br />
grater sensitivity.<br />
The lumen is defined such that the peak of the<br />
photopic vision curve has a luminous efficacy of<br />
683 lumens/watt. From here we get<br />
17<br />
F[<br />
lum]<br />
= eff × 683lum<br />
/ W , (5)<br />
P[<br />
W ]<br />
where F represents luminous flux in lumens, P<br />
represents radiant power in watts and eff<br />
represents efficacy [7].<br />
The scotopic vision is more sensible to green lights comparing to lights with other<br />
wavelengths. This explains why the petals of a red rose are much brighter than its leaves by<br />
day, but the leaves are brighter at twilight [7].
To sum up, due to the physiology of the eye which has 3 types of color receptors, we can<br />
define color with 3 coordinates. The relation between the spectrum of incoming light and<br />
perceived color is modeled with matching functions. To determine them, we cannot avoid the<br />
influence of subjectivity because each person perceives color slightly differently. As nearly all<br />
the cones are concentrated in the fovea, we cannot see color with the peripheral vision.<br />
Moreover, the color perception is diminished and changed at twilight when the rod-<br />
absorbance greatly influences color vision. In this case, the color matching functions are not<br />
reliable anymore.<br />
6. CONCLUSION<br />
The eye is an amazing organ full of secrets and one can learn a lot from it. One can<br />
understand its function from basic physical principles such as transforming a photon into an<br />
electrical pulse, contrasting and perceiving the color. Each of these topics makes people feel<br />
like standing on the edge of an immensity of things they do not know. In a way, thinking<br />
about vision seems like thinking about the laws of nature. The more you understand the more<br />
you realize that you actually do not understand.<br />
7. REFERENCES<br />
[1] Ralph Nossal and Harold Lecar, Molecular & Cell Biophysics, (Addison Wesley<br />
Publishing Company, 19??)<br />
[2] J. D. Cowan and D. S. Sharp, “Neural Nets”, Quart. Rev. Biophys. 21, 365 (1988).<br />
[3] H. K. Hartline, “Visual Receptors and Retinal Interaction,” Science 164, 270 (1969)<br />
[4] W.B. Marks, “Visual Pigments of Single Goldfish Cones,” J.Physiol.178, 14 (1986)<br />
[5] F.H.Marriott, “Colour vision. Theories,” chap. 16 in The Eye, Vol. 2, H.Davison, editor<br />
(Academic Press, New York, 1962)<br />
[6] Julie Schnapf, "How Photoreceptors Respond to Light", Scientific American, April 1987<br />
[7] hyperphysics.phy-astr.gsu.edu/hbase/hph.html<br />
[8] webvision.med.utah.edu/<br />
[9] users.rcn.com/jkimball.ma.ultranet/BiologyPages/V/Vision.html<br />
[10] www.darksky.org/VisionSeries/vs3-4.html<br />
18