S. Langenbuch, K.-D. Schmidt, and K. Velkov
S. Langenbuch, K.-D. Schmidt, and K. Velkov
S. Langenbuch, K.-D. Schmidt, and K. Velkov

You also want an ePaper? Increase the reach of your titles
YUMPU automatically turns print PDFs into web optimized ePapers that Google loves.
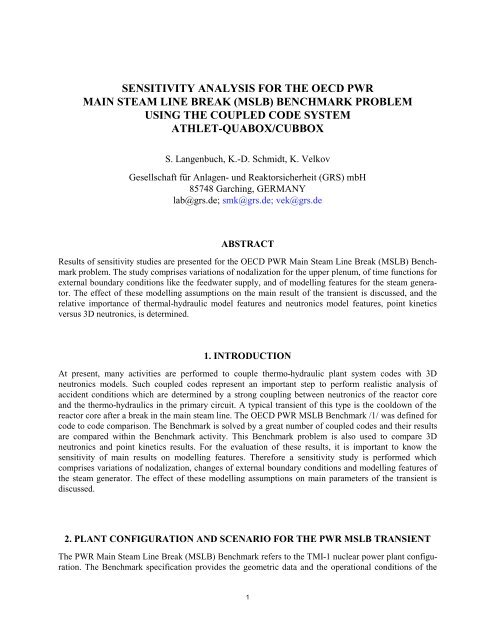
SENSITIVITY ANALYSIS FOR THE OECD PWR<br />
MAIN STEAM LINE BREAK (MSLB) BENCHMARK PROBLEM<br />
USING THE COUPLED CODE SYSTEM<br />
ATHLET-QUABOX/CUBBOX<br />
S. <strong>Langenbuch</strong>, K.-D. <strong>Schmidt</strong>, K. <strong>Velkov</strong><br />
Gesellschaft für Anlagen- und Reaktorsicherheit (GRS) mbH<br />
85748 Garching, GERMANY<br />
lab@grs.de; smk@grs.de; vek@grs.de<br />
ABSTRACT<br />
Results of sensitivity studies are presented for the OECD PWR Main Steam Line Break (MSLB) Benchmark<br />
problem. The study comprises variations of nodalization for the upper plenum, of time functions for<br />
external boundary conditions like the feedwater supply, <strong>and</strong> of modelling features for the steam generator.<br />
The effect of these modelling assumptions on the main result of the transient is discussed, <strong>and</strong> the<br />
relative importance of thermal-hydraulic model features <strong>and</strong> neutronics model features, point kinetics<br />
versus 3D neutronics, is determined.<br />
1. INTRODUCTION<br />
At present, many activities are performed to couple thermo-hydraulic plant system codes with 3D<br />
neutronics models. Such coupled codes represent an important step to perform realistic analysis of<br />
accident conditions which are determined by a strong coupling between neutronics of the reactor core<br />
<strong>and</strong> the thermo-hydraulics in the primary circuit. A typical transient of this type is the cooldown of the<br />
reactor core after a break in the main steam line. The OECD PWR MSLB Benchmark /1/ was defined for<br />
code to code comparison. The Benchmark is solved by a great number of coupled codes <strong>and</strong> their results<br />
are compared within the Benchmark activity. This Benchmark problem is also used to compare 3D<br />
neutronics <strong>and</strong> point kinetics results. For the evaluation of these results, it is important to know the<br />
sensitivity of main results on modelling features. Therefore a sensitivity study is performed which<br />
comprises variations of nodalization, changes of external boundary conditions <strong>and</strong> modelling features of<br />
the steam generator. The effect of these modelling assumptions on main parameters of the transient is<br />
discussed.<br />
2. PLANT CONFIGURATION AND SCENARIO FOR THE PWR MSLB TRANSIENT<br />
The PWR Main Steam Line Break (MSLB) Benchmark refers to the TMI-1 nuclear power plant configuration.<br />
The Benchmark specification provides the geometric data <strong>and</strong> the operational conditions of the<br />
1
plant. The primary circuit consists of the reactor vessel with the reactor core <strong>and</strong> two symmetric loops<br />
with hot leg, once-through steam generator (OTSG) <strong>and</strong> cold leg. The coolant flow through the reactor<br />
vessel <strong>and</strong> core is modelled by two equal parallel flow paths by splitting the downcomer, the lower plenum,<br />
the reactor core <strong>and</strong> the upper plenum. These parallel flow paths behave independently, except of<br />
connections with the upper head volumes. The amount of loop flow mixing is adjusted to measurements<br />
<strong>and</strong> is obtained by exchanging energy <strong>and</strong> mass between the two lower plenum volumes <strong>and</strong> the two upper<br />
plenum volumes.<br />
The secondary side of steam generator consists of the feedwater supply, the downcomer <strong>and</strong> the riser<br />
region, both are linked by an aspirator flow, <strong>and</strong> the steam line with the main safety valves.<br />
The transient being analysed is a main steam line break at hot full power (HFP). This causes the worst<br />
case of overcooling because the steam generator liquid inventory corresponds to the maximum possible<br />
value. A stuck rod condition of the most effective rod is assumed for the reactor trip, which is initiated at<br />
114 % of nominal power.<br />
The accident is initiated by a double-ended rupture of the main steam line upstream of the isolation valve.<br />
The break is simulated by two discharge valves opening within 0.1 s. One at the steam line with 24 inch<br />
diameter <strong>and</strong> one at the cross connecting pipe with 8 inch diameter. The break flow is simulated by the<br />
Moody discharge flow model.<br />
Following reactor scram, the steam line turbine stop valves are closed isolating the intact steam generator.<br />
All four recirculation pumps are assumed to operate during the event.<br />
3. PHENOMENOLOGY OF THE PWR MSLB TRANSIENT<br />
The non-isolated break of the main steam line leads to a depressurization of the affected steam generator<br />
which consequently causes an overcooling of the primary circuit. The reactor core is tripped during the<br />
transient after a few seconds, but due to the continuing cool-down of the primary coolant a recriticality<br />
may occur. In that case, the power will rise again during the transient. The main objective of the accident<br />
analysis is to evaluate the reactor core behaviour in view of the criticality conditions during the cooldown.<br />
The most relevant parameter to be determined is the minimum value of the coolant temperature in<br />
the reactor core reached during the transient, because this value directly affects the conditions of subcriticality<br />
or recriticality <strong>and</strong> the corresponding power rise.<br />
The results of calculations using the system-code ATHLET /2/ with a point-kinetics model are shown in<br />
Figures 1 to 8.<br />
The total core power, Fig. 1, is increasing at the beginning of the transient because of positive reactivity<br />
due to the reduction of the coolant temperature in the reactor core until the reactor trip is initiated at 114<br />
% nominal power. The coolant temperature in the affected loop, Fig. 2, decreases continuously till the<br />
minimum value is reached at about 68 s. The primary pressure is shown in Fig. 3. The pressure on the<br />
secondary side of the broken <strong>and</strong> the intact steam line is shown in Fig. 4, <strong>and</strong> the break mass flow for the<br />
24 inch <strong>and</strong> the 8 inch discharge in Fig. 5. The consequences for the liquid mass of both steam generators<br />
are presented in Fig. 6. The broken steam generator dries out at 80 s. The time integrated mass for water<br />
<strong>and</strong> steam is shown in Fig. 7. The time-functions of reactivities during the transient are presented in Fig<br />
8. It includes the reactor trip reactivity <strong>and</strong> the feedback reactivities. It can be seen that the main effect on<br />
reactivity is determined by the coolant temperature reduction<br />
The ATHLET calculations result in a minimum value of coolant temperature at cold leg outlet in the<br />
affected loop of 496,4 K at the time-point of 68 s.<br />
2
The preliminary report /3/ of the first phase of the Benchmark shows following results from different<br />
codes. The time-points of reaching minimum value of coolant temperatures at cold leg outlet varies in the<br />
time-interval from 60 s till about 80 s. Correspondingly, the time of power rise during recriticality is<br />
varying in a comparable range, whereby the maximum power reached during the transient is related to<br />
the minimum coolant temperature reached.<br />
Before discussing the sensitivity of results on single parameters <strong>and</strong> model features, it is expedient to<br />
identify the main phenomena of the transient evolution.<br />
– The break of the main steam line causes a depressurization of the steam generator secondary side.<br />
This pressure decrease is affected by the break mass flow <strong>and</strong> the feedwater supply. In particular,<br />
the rate of pressure decrease depends on the ratio of water <strong>and</strong> steam discharge of the break flow.<br />
A high water discharge leads to a slower pressure decrease than a high steam discharge.<br />
– The saturation temperature on the secondary side of the steam generator is determined by the pressure.<br />
As long as the steam generator contains sufficient liquid, an efficient heat-transfer from the primary<br />
side exists. Therefore, the temperature in the cold leg follows directly the decrease of the<br />
saturation temperature of the secondary side.<br />
– The cool-down of primary circuit is terminated when the steam generator falls dry.<br />
After loss of feedwater supply the cooling depends on pure steam flow with corresponding low<br />
heat-transfer.<br />
These main phenomena determine the phases of the cool-down transient. The time-point of reaching the<br />
minimum primary coolant temperature is directly correlated to the occurrence that the steam generator<br />
falls dry.<br />
4. VARIATION OF PARAMETERS AND MODEL FEATURES<br />
In comparison to the basic solution of the ATHLET calculation, the effect of following parameters <strong>and</strong><br />
model features were studied: the type of feedwater supply, the nodalization for the upper head of the<br />
reactor vessel <strong>and</strong> the change of fluiddynamic parameters of the steam generator like drift-flux <strong>and</strong> the<br />
aspirator flow rate.<br />
The feedwater flow to the broken steam generator is defined in the Benchmark specification. The preliminary<br />
specification indicated that in addition to the defined feedwater time function an additional water<br />
mass of about 16 t was injected. In the final specification this additional amount of water was included<br />
in the predefined time-function. Nevertheless, it is interesting to study how a change in the feedwater<br />
supply affects the transient. Two different types of feedwater supply, as shown in Fig. 9, were chosen.<br />
The base case without additional feedwater <strong>and</strong> a variant of feedwater supply which is available with<br />
a low flow rate during the transient. The Fig. 9 - 10 show the comparison of results, the time of minimum<br />
cold leg temperature changes from about 64 s to about 80 s, the corresponding minimum value of coolant<br />
temperature is about 8 K lower. This lower temperature value leads to a much higher power rise due to<br />
the recriticality.<br />
The nodalization of the upper head in the reactor vessel determines whether the model is able to represent<br />
the recirculation flow in the upper head region or whether the upper head behaves like a stagnant<br />
flow volume with limited flow exchange to the lower regions. This difference becomes relevant, because<br />
during the cool-down the pressurizer is drained <strong>and</strong> gets empty at about 24 s. Without recirculation flow,<br />
steam is generated in the upper head volume, keeping the pressure of the primary circuit at a higher level,<br />
If the model allows the recirculation flow, the saturation temperature is not reached in the upper head <strong>and</strong><br />
3
no steam is generated. Correspondingly, the primary pressure is reducing further. The difference is<br />
shown in Fig. 12 The other behaviour of the transient is not affected by the lower primary pressure, because<br />
the circuit is still kept in subcooled conditions <strong>and</strong> the heat-transfer in the steam generator is not<br />
changing.<br />
The steam generator is an important component determining the cooling-down rates. The depressurisation<br />
of the secondary side by the main steam line break causes the accelerated heat-transfer from the primary<br />
circuit. As already mentioned, the pressure of the secondary side is one of the most important parameters<br />
for the transient evolution. It is mainly dependent on the ratio of water <strong>and</strong> steam at the break of<br />
the main steam line, but additional model parameters may affect the void distribution <strong>and</strong> the heattransfer<br />
conditions in the steam generator. Variations were studied for the aspirator flow rate: the base<br />
calculation uses a flow rate of 100 kg/s, this value was varied to 20 kg/s. In the base case of the ATHLET<br />
calculation the drift flux was increased to model the water separation by the internal plates of the steam<br />
generator secondary side. This adaptation results in a higher void fraction <strong>and</strong> superheating at the riser<br />
outlet. This drift flux modification was not considered in the case for comparison. The comparison of<br />
results is shown in Fig. 13. The aspirator flow variation has a very small effect on the primary coolant<br />
temperature. The drift flux variation leads to a temperature difference of 5.5 K <strong>and</strong> a corresponding difference<br />
in the power rise.<br />
CONCLUSIONS<br />
The results obtained for the parameter variations <strong>and</strong> model features as part of a sensitivity study for the<br />
PWR MSLB Benchmark were evaluated with respect to the time-evolution of the overcooling transient,<br />
the minimum coolant temperature reached in the affected coolant loop <strong>and</strong> the corresponding power rise.<br />
The different cases show relevant differences for these main parameters of the transient. The discussion<br />
of the Benchmark results mostly considers differences between point-kinetics <strong>and</strong> 3D neutronics. However,<br />
the evaluation should take into account in the same manner the sensitivity of results on purely thermal-fluiddynamic<br />
parameters <strong>and</strong> features of plant modelling. For this purpose, a plant trantient model<br />
using pointkinetics can be applied. The examples show that for such complex transients, which require<br />
coupled code calculations, a systematic sensitivity study should be performed. Only such an analysis can<br />
determine the effect of uncertainties of the boundary conditions <strong>and</strong> modelling features on the safety<br />
relevant parameters.<br />
ACKNOWLEDEGMENT<br />
The work was performed within a project funded by the German Federal Ministry of Education, Science,<br />
Research <strong>and</strong> Technology (BMBF).<br />
REFERENCES<br />
/1/ K.N. Ivanov, T.V. Beam, A.J. Baratta, A. Irani <strong>and</strong> N. Trikouros, PWR MSLB Benchmark, Volume 1:<br />
Final Specification, October 1997, OECD/NEA<br />
/2/ G. Lerchl, H. Austregesilo, ATHLET Mod 1.2, Cycle A, User’s Manual, March 1998, GRS-P-1/Vol1,<br />
Rev.1<br />
/3/T.M. Beam, K.N. Ivanov, A.J. Baratta, Preliminary Report on First Phase of OECD PWR MSLB<br />
Benchmark, 2 nd Benchmark Workshop, Madrid, May 22-23, 1998<br />
4
4.0<br />
3.0<br />
2.0<br />
1.0<br />
0.0<br />
0.0<br />
8.0<br />
6.0<br />
4.0<br />
2.0<br />
0.0<br />
20.0<br />
40.0<br />
60.0<br />
80.0<br />
100.0<br />
FIGURES<br />
Fig.1 Total core power Fig.2 Primary coolant temperature at cold leg outlet<br />
<strong>and</strong> hot leg inlet of the affected loop B<br />
0<br />
20<br />
40<br />
60<br />
80<br />
100<br />
Fig.3 Pressure in the steam-line for the broken (B) Fig.4 Primary pressure at hot leg inlet for both<br />
<strong>and</strong> intact (A) side loops A <strong>and</strong> B<br />
5<br />
610.0<br />
590.0<br />
570.0<br />
550.0<br />
530.0<br />
510.0<br />
490.0<br />
16.0<br />
14.0<br />
12.0<br />
10.0<br />
8.0<br />
6.0<br />
4.0<br />
0<br />
0<br />
20<br />
20<br />
40<br />
40<br />
60<br />
60<br />
80<br />
80<br />
100<br />
100
2.5<br />
2.0<br />
1.5<br />
1.0<br />
0.5<br />
0.0<br />
60.0<br />
50.0<br />
40.0<br />
30.0<br />
20.0<br />
10.0<br />
0.0<br />
0<br />
20<br />
40<br />
60<br />
80<br />
100<br />
Fig. 5 Break mass flow at the 24 inch <strong>and</strong> Fig.6 Steam generator mass for the break (B)<br />
8 inch break <strong>and</strong> intact (A) side<br />
0<br />
20<br />
40<br />
60<br />
80<br />
100<br />
Fig.7 Integrated break mass flow of the break Fig.8 Reactivity of reactor trip <strong>and</strong><br />
for water <strong>and</strong> steam release feedback effects<br />
6<br />
40.0<br />
30.0<br />
20.0<br />
10.0<br />
0.0<br />
0.05<br />
0.03<br />
0.01<br />
-0.01<br />
-0.03<br />
-0.05<br />
0<br />
0<br />
20<br />
20<br />
40<br />
40<br />
60<br />
60<br />
80<br />
80<br />
100<br />
100
2.0<br />
1.6<br />
1.2<br />
0.8<br />
0.4<br />
0.0<br />
0.0<br />
4.0<br />
3.0<br />
2.0<br />
1.0<br />
20.0<br />
40.0<br />
60.0<br />
80.0<br />
100.0<br />
7<br />
580.0<br />
560.0<br />
540.0<br />
520.0<br />
500.0<br />
480.0<br />
0.0<br />
Fig.9 Variants of feedwater mass flow Fig.10 Cold leg coolant temperature at outlet for<br />
variants with <strong>and</strong> without additional water<br />
0.0<br />
0.0<br />
20.0<br />
40.0<br />
60.0<br />
80.0<br />
100.0<br />
2.0<br />
0.0<br />
Fig.11 Total core power for variants with <strong>and</strong> Fig.12 Pressure in primary system with <strong>and</strong> without<br />
without additional feedwater circulation flow in upper head<br />
16.0<br />
14.0<br />
12.0<br />
10.0<br />
8.0<br />
6.0<br />
4.0<br />
20.0<br />
20.0<br />
40.0<br />
40.0<br />
60.0<br />
60.0<br />
80.0<br />
80.0<br />
100.0<br />
100.0
600.0<br />
580.0<br />
560.0<br />
540.0<br />
520.0<br />
500.0<br />
480.0<br />
0.0<br />
20.0<br />
40.0<br />
8<br />
60.0<br />
80.0<br />
100.0<br />
Fig.13 Coolant temperature in broken loop for variants<br />
of aspirator flow <strong>and</strong> drift flux in steam generator