Ellis
Ellis
Ellis

You also want an ePaper? Increase the reach of your titles
YUMPU automatically turns print PDFs into web optimized ePapers that Google loves.
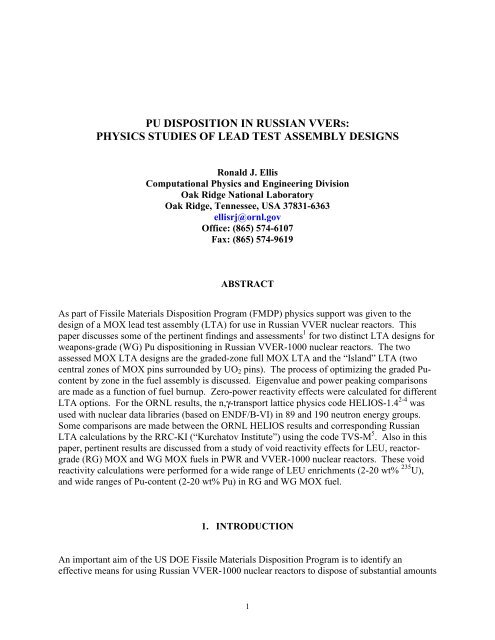
PU DISPOSITION IN RUSSIAN VVERS:<br />
PHYSICS STUDIES OF LEAD TEST ASSEMBLY DESIGNS<br />
Ronald J. <strong>Ellis</strong><br />
Computational Physics and Engineering Division<br />
Oak Ridge National Laboratory<br />
Oak Ridge, Tennessee, USA 37831-6363<br />
ellisrj@ornl.gov<br />
Office: (865) 574-6107<br />
Fax: (865) 574-9619<br />
ABSTRACT<br />
As part of Fissile Materials Disposition Program (FMDP) physics support was given to the<br />
design of a MOX lead test assembly (LTA) for use in Russian VVER nuclear reactors. This<br />
paper discusses some of the pertinent findings and assessments 1 for two distinct LTA designs for<br />
weapons-grade (WG) Pu dispositioning in Russian VVER-1000 nuclear reactors. The two<br />
assessed MOX LTA designs are the graded-zone full MOX LTA and the “Island” LTA (two<br />
central zones of MOX pins surrounded by UO2 pins). The process of optimizing the graded Pucontent<br />
by zone in the fuel assembly is discussed. Eigenvalue and power peaking comparisons<br />
are made as a function of fuel burnup. Zero-power reactivity effects were calculated for different<br />
LTA options. For the ORNL results, the n,γ-transport lattice physics code HELIOS-1.4 2-4 was<br />
used with nuclear data libraries (based on ENDF/B-VI) in 89 and 190 neutron energy groups.<br />
Some comparisons are made between the ORNL HELIOS results and corresponding Russian<br />
LTA calculations by the RRC-KI (“Kurchatov Institute”) using the code TVS-M 5 . Also in this<br />
paper, pertinent results are discussed from a study of void reactivity effects for LEU, reactorgrade<br />
(RG) MOX and WG MOX fuels in PWR and VVER-1000 nuclear reactors. These void<br />
reactivity calculations were performed for a wide range of LEU enrichments (2-20 wt% 235 U),<br />
and wide ranges of Pu-content (2-20 wt% Pu) in RG and WG MOX fuel.<br />
1. INTRODUCTION<br />
An important aim of the US DOE Fissile Materials Disposition Program is to identify an<br />
effective means for using Russian VVER-1000 nuclear reactors to dispose of substantial amounts<br />
1
of WG Pu in the form of MOX fuel. As part of FMDP physics support by ORNL, assessments<br />
were made of the Island and the full MOX LTA design options. The Island LTA design concept<br />
involved a VVER fuel assembly with either: a single central zone of MOX pins surrounded by<br />
UO2 pins, or a two-zone graded Pu-content MOX island surrounded by UO2 pins. For power<br />
peaking considerations, the two-zone graded Pu-content Island LTA design is the better of the<br />
two; the Island results discussed in this paper are only for the two-zone MOX Island LTA<br />
design. The full MOX LTA design discussed and assessed in this paper is a three-zone graded<br />
Pu-content MOX concept for the entire fuel assembly. The full MOX LTA design is the<br />
preferred and accepted design for further development and implementation.<br />
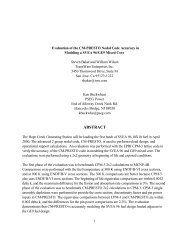
To illustrate the appearance and local environment of a full MOX LTA in a VVER-1000 reactor,<br />
Figure 1 shows a schematic diagram of the full MOX VVER LTA concept design. Standard<br />
LEU assemblies surround this MOX LTA; the three graded Pu-content MOX zones are seen in<br />
the diagram – these range from highest Pu-content in the center to lowest at the peripheral zone.<br />
Below, comparisons are shown between Russian TVS-M results and ORNL HELIOS results for<br />
the full MOX LTA design and some Island LTA results from a parametric optimization study are<br />
shown. The results of a detailed study of zero-power reactivity effects for temperature and<br />
coolant boron concentration are compared as a function of fuel burnup for the Island LTA, the<br />
full MOX LTA, and the standard LEU VVER fuel assembly.<br />
The issue of comparisons of void reactivity effects for LEU and MOX fuel are timely and of<br />
pertinence to discussions of Pu disposition. To complement the information shown and<br />
discussed concerning the reactivity behavior of VVER MOX LTA fuel, results from a scoping<br />
study of relative void reactivity effects in LEU, RG MOX and WG MOX fuel in PWR and<br />
VVER reactors are also presented below.<br />
2. MODELING DETAILS<br />
The VVER LTA model is based on a standard VVER-1000 assembly, in a multi-assembly<br />
structure: the MOX LTA is surrounded by LEU assemblies as shown in Figure 1. The fuel pins<br />
are positioned on a triangular lattice with a pitch of 1.275 cm. The assembly pitch is 23.6 cm.<br />
The fuel pins are made from fuel pellets of diameter 0.755 cm with a central hole of diameter<br />
0.15 cm. The fuel is surrounded by an air gap of 0.0085 cm and clad by zirconium alloy of<br />
thickness 0.069 cm. For the LTA calculations, a buckling (B 2 ) value of 0.0001 cm -2 was used to<br />
account for neutron leakage.<br />
The standard VVER K331 assembly has 331 sites of which 18 are guide tube thimble sites and<br />
there is one central instrument tube site. There are 312 sites available for fuel pins. In the full<br />
MOX LTA, the three MOX zones are 66 outer, 102 intermediate and 144 inner sites. In the twozone<br />
Island LTA, a central MOX zone of 24 sites is surrounded by a 30-site MOX zone, and this<br />
MOX island in turn is surrounded by 258 UO2 pins (3.7 wt% enriched). The reference uranium<br />
assembly referred to in Table I consist of 246 UO2 pins (3.7 wt% enriched) surrounded by a<br />
periphery of 66 UO2 pins (3.3 wt% enriched).<br />
2
The calculations for the VVER LTA studies were performed using the code HELIOS-1.4<br />
(developed by Studsvik Scandpower Inc.) with either the 89-group or 190-group nuclear data<br />
libraries based on ENDF/B-VI, release 2. The results presented for the PWR void reactivity<br />
effects were calculated for the most part using HELIOS-1.4 with the 89-group nuclear data<br />
library. Some additional and corroborating calculations were also performed using pin-cell<br />
models with the SAS2H and CSAS sequences from the SCALE-4.3 code system 6 similar to a<br />
recent ORNL benchmark study 7 , with the 238-group nuclear data library based on ENDF/B-V.<br />
3. RESULTS FOR VVER MOX LTA CALCULATIONS<br />
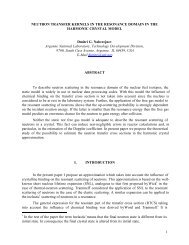
Figure 2 shows the behavior of keff as a function of fuel burnup for the full MOX LTA. Figure 3<br />
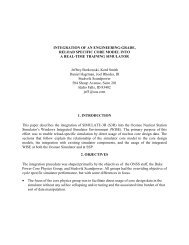
is a comparison of the peak-to-average relative pin power as a function of fuel burnup. The<br />
HELIOS and TVS-M pin power curves are similar in shape to about 30 MWd/kgHE (Megawatt<br />
days per kilogram of Heavy Elements) then the ORNL results indicate (seen as a kink) that a<br />
different pin becomes the one with the greatest relative pin power. Figure 4 shows that the<br />
relative agreement between the codes is quite good: keff and the peak pin power differences are<br />
1% for most of the burnup cycle.<br />
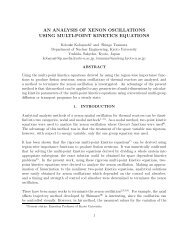
In Figure 5, results are presented from an optimization assessment for the graded Pu-content of<br />
the two-zone graded Pu-content MOX Island LTA design. Curves are plotted for peak relative<br />
pin powers versus the peripheral-zone Pu-content, for various Pu levels in the central zone.<br />
Interestingly, these curves are actually cusps. As the peripheral Pu content is decreased, the peak<br />
relative pin power (in the peripheral pins) drops gradually, until the peak relative pin power in<br />
the central region suddenly becomes greater than for any peripheral pin. Indications are the<br />
optimum fissile Pu grading (based on peak pin power ratio ≤ 1.2) is 3.8 wt% in the central zone,<br />
2.65 wt% in the peripheral zone, with the surrounding LEU being 3.7 wt% enriched.<br />
An extensive series of zero-power (isothermal) cases was completed for pertinent VVER MOX<br />
LTA designs and the reference LEU fuel assembly at various coolant soluble boron levels and<br />
reactor temperatures. The cases presented are one design of the two-zone graded Pu-content<br />
Island LTA, four different three-zone graded Pu-content full MOX LTA designs, and the<br />
reference UO2 assembly; all these are surrounded by fuel assemblies with 3.7 wt% enriched UO2.<br />
In Table I, a summary is presented of the reactivity effects calculated from keff determinations.<br />
The cases are identified by the zonal fuel content, from the center of the assembly to the<br />
periphery. As an example, the first case is “3.8/2.8/U-3.7 Island”: the central MOX zone<br />
contains fissile Pu at 3.8 wt% HE, the intermediate zone contains 2.8 wt% HE fissile Pu, and the<br />
outer region is UO2 at 3.7 wt% enrichment. The tabulated results are the reactivity effects for<br />
reactor temperature increase (including the coolant density decrease) for coolant with or without<br />
boron, and the reactivity worths of the boron concentration at different reactor temperatures. As<br />
is evident from the results tabulated in Table I, the agreement between the Russian TVS-M<br />
results and the ORNL HELIOS results is good over the full range of simulated fuel burnup.<br />
3
B<br />
U<br />
0 MWd/kgHE<br />
10 MWd/kgHE<br />
20 MWd/kgHE<br />
30 MWd/kgHE<br />
40 MWd/kgHE<br />
Table I. Temperature and Boron Reactivity Effects (%) [Upper Value RRC-KI (TVS-M) and<br />
Lower Value ORNL (HELIOS-1.4)]<br />
Reactivity<br />
Effect<br />
20 to 280C;<br />
0 ppm B<br />
20 to 280C;<br />
1200 ppm B<br />
0 to 1200 ppm<br />
B @20C<br />
0 to 1200 ppm<br />
B @280C<br />
20 to 280C;<br />
0 ppm B<br />
20 to 280C;<br />
1200 ppm B<br />
0 to 1200 ppm<br />
B @20C<br />
0 to 1200 ppm<br />
B @280C<br />
20 to 280C;<br />
0 ppm B<br />
20 to 280C;<br />
1200 ppm B<br />
0 to 1200 ppm<br />
B @20C<br />
0 to 1200 ppm<br />
B @280C<br />
20 to 280C;<br />
0 ppm B<br />
20 to 280C;<br />
1200 ppm B<br />
0 to 1200 ppm<br />
B @20C<br />
0 to 1200 ppm<br />
B @280C<br />
20 to 280C;<br />
0 ppm B<br />
20 to 280C;<br />
1200 ppm B<br />
0 to 1200 ppm<br />
B @20C<br />
0 to 1200 ppm<br />
B @280C<br />
3.8/2.8/U-3.7<br />
Island MOX<br />
-2.35<br />
-2.37<br />
+0.42<br />
+0.41<br />
-11.77<br />
-11.74<br />
-8.99<br />
-8.95<br />
-3.00<br />
-3.07<br />
+0.37<br />
+0.36<br />
-12.52<br />
-12.52<br />
-9.15<br />
-9.09<br />
-3.33<br />
-3.34<br />
+0.57<br />
+0.69<br />
-13.81<br />
-13.91<br />
-9.91<br />
-9.89<br />
-3.34<br />
-3.22<br />
+1.12<br />
+1.46<br />
-15.36<br />
-15.59<br />
-10.90<br />
-10.91<br />
-3.10<br />
-2.77<br />
+2.00<br />
+2.60<br />
-17.11<br />
-17.44<br />
-12.02<br />
-12.07<br />
4.2/3.0/2.0<br />
Full MOX<br />
-2.62<br />
-2.76<br />
+0.07<br />
-0.09<br />
-10.92<br />
-10.76<br />
-8.23<br />
-8.09<br />
-3.11<br />
-3.20<br />
+0.17<br />
+0.09<br />
-11.81<br />
-11.66<br />
-8.53<br />
-8.37<br />
-3.37<br />
-3.38<br />
+0.41<br />
+0.48<br />
-13.11<br />
-13.05<br />
-9.33<br />
-9.20<br />
-3.35<br />
-3.20<br />
+0.97<br />
+1.25<br />
-14.63<br />
-14.68<br />
-10.30<br />
-10.22<br />
-3.12<br />
-2.77<br />
+1.79<br />
+2.33<br />
-16.30<br />
-16.46<br />
-11.39<br />
-11.36<br />
4<br />
4.4/3.2/2.0<br />
Full MOX<br />
-2.63<br />
-2.76<br />
+0.04<br />
-0.13<br />
-10.86<br />
-10.68<br />
-8.19<br />
-8.05<br />
-3.10<br />
-3.21<br />
+0.13<br />
+0.04<br />
-11.72<br />
-11.56<br />
-8.48<br />
-8.31<br />
-3.36<br />
-3.39<br />
+0.38<br />
+0.41<br />
-13.00<br />
-12.92<br />
-9.26<br />
-9.11<br />
-3.35<br />
-3.24<br />
+0.91<br />
+1.16<br />
-14.49<br />
-14.51<br />
-10.23<br />
-10.12<br />
-3.12<br />
-2.82<br />
+1.72<br />
+2.20<br />
-16.14<br />
-16.25<br />
-11.30<br />
-11.23<br />
4.4/3.0/2.0<br />
Full MOX<br />
-2.63<br />
-2.76<br />
+0.06<br />
-0.11<br />
-10.90<br />
-10.72<br />
-8.21<br />
-8.07<br />
-3.09<br />
-3.21<br />
+0.15<br />
+0.06<br />
-11.77<br />
-11.61<br />
-8.52<br />
-8.34<br />
-3.36<br />
-3.38<br />
+0.40<br />
+0.44<br />
-13.06<br />
-12.98<br />
-9.30<br />
-9.15<br />
-3.34<br />
-3.22<br />
+0.94<br />
+1.20<br />
-14.56<br />
-14.58<br />
-10.27<br />
-10.17<br />
-3.11<br />
-2.79<br />
+1.75<br />
+2.26<br />
-16.23<br />
-16.34<br />
-11.37<br />
-11.29<br />
4.4/3.0/2.4<br />
Full MOX<br />
-2.65<br />
-2.77<br />
+0.01<br />
-0.15<br />
-10.82<br />
-10.64<br />
-8.16<br />
-8.01<br />
-3.11<br />
-3.22<br />
+0.10<br />
+0.02<br />
-11.67<br />
-11.52<br />
-8.45<br />
-8.28<br />
-3.38<br />
-3.40<br />
+0.35<br />
+0.39<br />
-12.95<br />
-12.87<br />
-9.23<br />
-9.09<br />
-3.37<br />
-3.25<br />
+0.87<br />
+1.13<br />
-14.45<br />
-14.47<br />
-10.20<br />
-10.09<br />
-3.15<br />
-2.83<br />
+1.68<br />
+2.18<br />
-16.10<br />
-16.22<br />
-11.27<br />
-11.21<br />
U:3.7/3.3<br />
UO2<br />
-2.12<br />
-2.29<br />
+0.69<br />
+0.51<br />
-12.03<br />
-12.05<br />
-9.23<br />
-9.24<br />
-2.79<br />
-2.99<br />
+0.63<br />
+0.48<br />
-12.76<br />
-12.79<br />
-9.34<br />
-9.31<br />
-3.10<br />
-3.24<br />
+0.84<br />
+0.84<br />
-14.04<br />
-14.18<br />
-10.10<br />
-10.10<br />
-3.10<br />
-3.10<br />
+1.43<br />
+1.65<br />
-15.62<br />
-15.89<br />
-11.09<br />
-11.14<br />
-3.00<br />
-2.62<br />
+2.17<br />
+2.86<br />
-17.45<br />
-17.78<br />
-12.28<br />
-12.31
The agreement for the boron reactivity worths is very good for all the cases and for all the<br />
burnup levels. The overall comparison is that the ratio of TVS-M to HELIOS boron reactivity<br />
worths is 1.0049±0.0014; for higher burnup results, the trend is that the TVS-M value is slightly<br />
smaller than the HELIOS result, while at lower burnup, the TVS-M result is greater than the<br />
HELIOS result.<br />
The reactivity effect of the isothermal reactor temperature increase includes the associated<br />
density change in the coolant [the density of the coolant decreases by 23.9% when heated from<br />
20C to 280C], the Doppler effect of the fuel, and all other temperature reactivity effects. For<br />
coolant with boron, the expansion of the coolant upon temperature increase results in a<br />
corresponding decrease in the boron concentration and a significant reduction in the reactivity<br />
load of the coolant.<br />
For fresh fuel, with coolant without boron, the reactivity effect of the temperature increase is<br />
negative for all the different design options simulated. The full MOX LTA values is more<br />
negative than the value for the Island LTA, while the value for the LEU assembly is slightly less<br />
negative than the Island LTA.<br />
For the LTA models, for fresh fuel and low burnup fuel (0-10 MWd/kgHE) the magnitude of the<br />
TVS-M result is slightly smaller than that of HELIOS. The ratios of the TVS-M to HELIOS<br />
results at 20 MWd/kgHE are essentially equal to 1. For higher burnup fuel (30-40 MWd/kgHE)<br />
the TVS-M to HELIOS result ratio is greater than one (about 1.077±0.014).<br />
For coolant with 1200-ppm boron, the reactivity effect of the temperature increase is positive for<br />
the Island LTA and slightly more positive for the LEU assembly. For the full MOX LTA<br />
designs, for fresh fuel, the TVS-M results for the reactivity effect are very small and positive but<br />
the HELIOS results are very small and negative. For fuel with burnup, the reactivity effect of<br />
temperature increase is positive for all the cases. With increasing fuel burnup, the HELIOS<br />
result becomes increasingly larger than the TVS-M result: at 40 MWd/kgHE, the HELIOS result<br />
is about 1.298±0.003 times larger than the TVS-M temperature reactivity effect.<br />
4. VOID REACTIVITY EFFECTS 8 FOR LEU AND MOX FUEL IN PWRs<br />
A series of studies was performed to assess the void reactivity effect of pressurized-water<br />
reactors uniformly fueled with pins of LEU or MOX fuel. The first study considered the void<br />
reactivity effects caused by a 10% void (reduction in coolant density) in VVER and PWR<br />
models for LEU, WG MOX and RG MOX fuel. An additional case looked at the relative<br />
reactivity effects of coolant density change and the separate coolant temperature change for a<br />
simulation case with a nominal 10% reduction in coolant density. A major scoping study was<br />
completed to calculate the behavior of void reactivity for pressurized-water reactors for a wide<br />
range of LEU fuel enrichments and WG and RG MOX fuel Pu-content levels.<br />
5
4.1 COMPARISON OF VOID REACTIVITY EFFECTS IN VVERs AND PWRs<br />
The initial cases (Tables II-IV) assessed were LEU (3.5 wt% enrichment), weapons-grade (WG)<br />
MOX, and reactor-grade (RG) MOX for standard PWR and VVER conditions and geometry.<br />
The WG and RG compositions in these particular cases were nominal ones chosen from the<br />
Russian benchmark study 9 .<br />
The WG composition (units of 10 -24 cm -3 ) was 235 U 3.8393×10 -5 , 239 Pu 6.5875×10 -4 , 241 Pu<br />
7.0246×10 -6 , 16 O 4.1707×10 -2 , 238 U 1.8917×10 -2 , 240 Pu 4.2323×10 -5 . The RG composition was<br />
defined as 235 U 5.0×10 -5 , 239 Pu 1.16×10 -3 , 241 Pu 1.9×10 -4 , 241 Am 2.5×10 -5 , 238 U 2.21×10 -2 , 240 Pu<br />
4.9×10 -4 , 242 Pu 1.05×10 -4 , 16 O 4.63×10 -2 , 238 Pu 3.0×10 -5 . Calculations were performed for<br />
coolant without boron and coolant with 600-ppm natural boron. In this study, the onset of 10%<br />
void in the coolant was modelled as the appropriate coolant density change.<br />
Table II. VVER, With 600 ppm Boron<br />
Fuel Unvoided kinf 10% Void kinf Reactivity Effect (%)<br />
LEU 1.25893 1.24666 -0.782<br />
WG 1.20719 1.18716 -1.398<br />
RG 1.09500 1.07907 -1.348<br />
Table III. VVER, With no Boron<br />
Fuel Unvoided kinf 10% Void kinf Reactivity Effect (%)<br />
LEU 1.31401 1.29520 -1.105<br />
WG 1.23571 1.21204 -1.580<br />
RG 1.10762 1.08992 -1.466<br />
The results shown above for a 10% void were calculated for fresh fuel (i.e., zero burnup). The<br />
results from Table II-IV indicate that the void reactivity effect for 10% void is more negative for<br />
WG than for RG and more negative for RG than LEU. Also, as expected, the cases in which<br />
boron is modelled in the coolant have void reactivity effects that are less negative than the<br />
corresponding cases with no coolant boron (see Tables II and III), because of the effective<br />
reduction in the boron concentration.<br />
Table IV. PWR, With no Boron<br />
Fuel Unvoided kinf 10% Void kinf Reactivity Effect (%)<br />
LEU 1.38179 1.36123 -1.093<br />
WG 1.27695 1.25208 -1.556<br />
RG 1.12780 1.10876 -1.523<br />
6
Results shown in Tables III and IV allow a comparison of VVER and PWR void reactivity<br />
effects: though there are some differences in pin geometries and pitch (resulting in the kinf<br />
differences) the values for the void reactivities are very similar for VVER and PWR reactors.<br />
4.2 RELATIVE TEMPERATURE AND DENSITY EFFECTS IN MTC CONSIDERATIONS<br />
To assess phenomena associated with an actual moderator temperature coefficient (MTC), an<br />
additional series of SAS2H and HELIOS calculations were performed for a coolant temperature<br />
change that would result in an exact 10% coolant density change (the fuel temperature was not<br />
changed in these calculations): At 536.8K, the coolant density is 0.791 g/cm 3 ; at 580.0K, the<br />
coolant density is 0.712 g/cm 3 , exactly 10% less. For this example, the SAS2H and HELIOS<br />
cases did not include boron in the coolant.<br />
There were consistent results between the SAS2H and HELIOS calculations. The reactivity<br />
effect due to the +43.2K coolant temperature change alone is about -0.04% for LEU, -0.08% for<br />
RG, and -0.11% for WG; this compares to -1.1% to -1.5% for the partial reactivity effect of the<br />
coolant density change alone.<br />
4.3 VOID REACTIVITY IN PWRs FOR RANGES OF LEU AND MOX ENRICHMENTS<br />
Since a realistic operating reactor has a distribution of fuel burnups, it is important to assess the<br />
void reactivity effect as a function of burnup. To accomplish this, HELIOS cases were prepared<br />
for VVER geometries and standard PWR fuel pin geometry. HELIOS cases modeled the burnup<br />
of the appropriate LEU or MOX fuel from 0 to 40 MWd/kgHE burnup, and simulated voiding at<br />
different burnup points. Burnup of 20 MWd/kgHE is representative of midburnup for the fuel;<br />
this approximates the average conditions and fuel burnup for an equilibrium operating PWR.<br />
Table V presents an overview of void reactivity effects for fresh and midburnup LEU, WG, and<br />
RG fuel for 10% voiding up to 90% voiding.<br />
Table V. Reactivity Effects (%) From Voiding: HELIOS Calcs, With Boron in the Coolant<br />
Fuel<br />
10% void;<br />
0 MWd/kgHE<br />
10% void;<br />
20 MWd/kgHE<br />
50% void;<br />
0 MWd/kgHE<br />
7<br />
50% void;<br />
20 MWd/kgHE<br />
90% void;<br />
0 MWd/kgHE<br />
90% void;<br />
20 MWd/kgHE<br />
LEU 3.5 wt% -1.12 -1.87 -10.26 -15.35 -49.43 -58.32<br />
Nominal WG -1.50 -2.05 -11.92 -15.78 -44.57 -51.84<br />
Nominal RG -1.32 -1.38 -7.22 -7.43 -11.76 -11.30<br />
From the above results, for the representative fuel compositions considered, the void reactivity<br />
effect becomes more negative for each of the fuel types as the degree of voiding is increased.<br />
However, while for the modest 10% voiding the reactivity effect is less negative in LEU than in<br />
MOX and WG is more negative than RG; for large voids (90%), LEU is considerably more<br />
negative than MOX but RG is much less negative than WG.
The densities and isotopic compositions of actual MOX fuel to be considered in future<br />
applications will be different from these simple sample models. Accordingly, for consistency, a<br />
series of HELIOS cases was performed with standardized LEU, WG, and RG compositions. All<br />
the fuel was assumed to be 10.4 g/cm 3 , and for MOX fuel Pu-content was defined as total Pu<br />
wt% in total heavy element inventory (U+Pu). The vector for reactor grade Pu (RG) is assumed<br />
to be: 1% 238 Pu, 59% 239 Pu, 24% 240 Pu, 11% 241 Pu, and 5% 242 Pu. The vector for weapons grade<br />
Pu (WG) is assumed to be 0.05% 238 Pu, 94.3% 239 Pu, 5.0% 240 Pu, 0.6% 241 Pu, and 0.05% 242 Pu.<br />
For the following series of calculations, MOX loadings of 2, 4, 6, 8, 10, 12, 14, 16, 18, and 20<br />
wt% Pu were modelled, LEU enrichments of 2, 4, 6, 8, 10, 12, 14, 16, 18, and 20 wt% 235 U were<br />
considered. The level of natural boron in the coolant is assumed to be 600 ppm. The<br />
calculations were performed for void levels ranging from 0 - 100% in intervals of 10%.<br />
The attached Figures 6-8 show curves of calculated void reactivities as functions of void for<br />
LEU, WG, and RG fuel, for fresh and the midburnup (equilibrium) burnup levels. For each fuel<br />
type, the curves are shown for a large number of MOX loadings or enrichment levels. From the<br />
large set of data gathered in these studies, three representative examples are tabulated for the<br />
void reactivity and void reactivity coefficients for LEU, WG, and RG fuel. The results are<br />
summarized in Tables VI and VII.<br />
Table VI. Void Reactivity Effects (%) for Fresh and Midburnup Fuel<br />
Fuel<br />
10% void 50% void 100% void<br />
¨© § ¢¡£¤§¦ ¨© ¢¡¢£¤§¦ ¨© § ¡£¤§¦ ¨© ¢¡¢£¥¤§¦ ¨© § ¢¡£¤§¦ ¨©<br />
¢¡¢£¥¤§¦<br />
LEU 4 wt% -1.104 -1.761 -9.765 -14.088 -69.820 -73.835<br />
WG MOX 6 wt% -1.286 -1.628 -9.021 -10.691 -33.146 -32.939<br />
RG MOX 8 wt% -1.332 -1.441 -7.549 -8.039 -18.898 -17.870<br />
For 10% voiding, the void reactivity for WG and RG are similar, and more negative than LEU,<br />
for fresh fuel. For midburnup fuel, LEU is more negative while RG is least negative. For 100%<br />
voiding in fresh fuel, LEU has a much more negative void reactivity effect than MOX, and RG<br />
has the least negative. For midburnup fuel, the voiding reactivity effect for 100% voiding<br />
becomes more negative in LEU but becomes somewhat less negative in WG and RG.<br />
As seen in the curves in the Figures 6-8, the reactivity behavior of the different types of MOX<br />
and LEU fuel changes as the enrichment or MOX Pu content changes. An interesting threshold<br />
figure-of-merit (FOM) to consider is the calculated minimum enrichment or MOX loading at<br />
which the reactivity effect becomes positive upon voiding for the three fuel types. This FOM is<br />
tabulated in Table VII for LEU, WG MOX and RG MOX.<br />
Table VII. Minimum Fuel Enrich. or Pu Loading at Which Voiding Reactivity Becomes Positive.<br />
Fuel Type MOX loading or<br />
enrichment (wt%)<br />
LEU 20.0<br />
WG MOX 12.8<br />
RG MOX 12.4<br />
8
The thresholds are evident in Figures 6-8 where the lowest-enrichment curve first crosses the<br />
reactivity=0.00 line. The void reactivity becomes positive for midburnup fuel (20 MWd/kgHE)<br />
at the enrichment or MOX loading values tabulated in Table VII. The midburnup state is a good<br />
average representation of the equilibrium operating PWR. The enrichment or Pu-content<br />
thresholds for fresh fuel (solid curves) to have a positive reactivity feedback effect would be<br />
slightly higher than the corresponding midburnup thresholds (dashed curves), for all three fuel<br />
types.<br />
The results presented in Table VII are consistent with the findings of the OECD/NEA benchmark<br />
study of void reactivity effects in PWRs, as discussed in reference 8, which says that “the<br />
inherent void reactivity of MOX assemblies becomes positive somewhere between 10 and 14<br />
w/o total Pu content.” It is important to note that the Pu-content levels being considered for<br />
MOX fuel for Pu disposition are considerably less than the values presented in Table VII.<br />
5. CONCLUSIONS<br />
From the independent assessments of the Island and the full MOX LTA designs by ORNL<br />
(United States) and RRC-KI (Russian Federation), some of the conclusions include:<br />
• there is good general consistency between the results of LTA design assessments by<br />
HELIOS-1.4 (ORNL) and TVS-M (RRC-KI).<br />
• good agreement between HELIOS-1.4 and TVS-M results for the zero-power calculations.<br />
• the temperature reactivity effect (with boron in the coolant) is smaller (less positive, or<br />
negative) for MOX than the reference LEU case.<br />
• furthermore, the temperature reactivity effect is smaller (less positive, or negative) for the<br />
full MOX LTA designs than for the Island LTA designs.<br />
• when the temperature reactivity effect is positive for boronated coolant cases, it is mainly<br />
because of the expansion of the coolant and the resulting reduction in the 10 B concentration.<br />
From the study of void reactivity effects in PWRs for nominal LEU, RG, and WG fuels, some of<br />
the observations include:<br />
• for 10% voiding, the void reactivities for WG and RG are similar, and more negative than<br />
LEU, for fresh fuel.<br />
• for midburnup fuel, for 10% voiding, LEU voiding reactivity is most negative while RG<br />
voiding reactivity is least negative.<br />
• for 100% voiding in fresh fuel, LEU has a much more negative void reactivity effect than<br />
MOX, and RG has the least negative.<br />
• for midburnup fuel, the 100% voiding reactivity effect becomes even more negative in LEU<br />
but becomes somewhat less negative in WG and RG.<br />
From PWR scoping studies for a wide range of LEU enrichments or MOX Pu-content levels, it is<br />
observed that:<br />
• the minimum LEU 235 U enrichment for a positive void reactivity is 20.0 wt%.<br />
• the minimum Pu-content at which RG MOX has a positive void reactivity is 12.4 wt%.<br />
• the minimum Pu-content level for which WG MOX has a positive void reactivity (under<br />
these very unusual conditions) is 12.8 wt%.<br />
9
ACKNOWLEDGEMENTS<br />
The work reported in this paper was supported by the US DOE as part of the Fissile Materials<br />
Disposition Program (FMDP).<br />
REFERENCES<br />
1. R.J. <strong>Ellis</strong>, Presentations at the Sixth US/RF Technical Specialists’ Meeting US DOE FMDP<br />
Water Reactors 1 and 6, St. Petersburg, Russia, July, 1999.<br />
2. R.J.J. Stamml’er and M.J. Abbate, “Methods of Steady-State Reactor Physics in Nuclear<br />
Design”, Academic Press, London (1983)<br />
3. J.J. Casal, R.J.J. Stamml’er, E.A. Villarino, and A.A. Ferri, “HELIOS: Geometric<br />
Capabilities of a New Fuel-Assembly Program”, Proceedings of International Topical<br />
Meeting on Advances in Mathematics, Computations, and Reactor Physics”, Pittsburgh,<br />
Pennsylvania, April 28-May 2, 1991, Vol.2, p.10.2.1 1-13.<br />
4. E.A. Villarino, R.J.J. Stamml’er and A.A. Ferri, “HELIOS: Angular Dependent Collision<br />
Probabilities”, Nuclear Science and Engineering, Vol.112, 16 (1992)<br />
5. V.D. Sidorenko, et al, “Spectral Code TVS-M for Calculation of Characteristics of Cells,<br />
Supercells and Fuel Assemblies of VVER-Type Reactors”, Fifth Symposium of the AER,<br />
Dobogoko, Hungary, October 15-20, 1995.<br />
6. SCALE 4.3 - Modular Code System for Performing Standardized Computer Analyses for<br />
Licensing Evaluation for Workstations and Personal Computers”, RSICC, ORNL, CCC-545,<br />
Oak Ridge National Laboratory, January, 1997.<br />
7. R.J. <strong>Ellis</strong>, “Analysis of Weapons-Grade MOX VVER-1000 Neutronics Benchmarks: Pin-<br />
Cell Calculations with SCALE/SAS2H”, ORNL/TM-2000/4, Oak Ridge National<br />
Laboratory, in prep. February, 2000.<br />
8. PHYSICS OF PLUTONIUM RECYCLING: Volume III Void Reactivity Effect in Pressurizedwater<br />
Reactors, OECD/NEA Nuclear Science Committee, Paris, France, 1995.<br />
9. R.T. Primm, ed., “Neutronics Benchmarks for the Utilization of MOX Fuel: Joint<br />
U.S./Russian Progress Report for the Fiscal Year 1997, ORNL/TM-13603, Vol.3, Oak Ridge<br />
National Laboratory, 1998.<br />
10
Figure 1: Representation of a VVER LTA Assembly Surrounded by LEU Assemblies. This is a<br />
Full MOX LTA Design With 144 Inner, 102 Intermediate and 66 Peripheral Fuel Pins in the<br />
Three Zones (Graded From Higher Pu Content in the Central Zone to Lower Pu Content in the<br />
Peripheral Zone).<br />
11
keff<br />
1.40<br />
1.20<br />
1.00<br />
0.80<br />
0.60<br />
0.40<br />
0.20<br />
0.00<br />
Full MOX LTA:<br />
Comparison of keff Determinations<br />
HELIOS (ORNL)<br />
0.0 10.0 20.0 30.0 40.0<br />
Burnup (MWd/kgHE)<br />
Figure 2. Calculated keff as a Function of Burnup for the Full-MOX Lead Test Assembly Design.<br />
(Units of Burnup are Defined as Megawatt days per kilogram of Heavy Elements)<br />
12<br />
TVS-M
Peak Relative Pin Power<br />
1.20<br />
1.15<br />
1.10<br />
1.05<br />
1.00<br />
Full MOX LTA:<br />
Peak Relative Pin Power<br />
HELIOS (ORNL)<br />
TVS-M<br />
0.0 10.0 20.0 30.0 40.0<br />
Burnup (MWd/kgHE)<br />
Figure 3. Peak Relative Pin Powers as a Function of Fuel Burnup for the Full-MOX Lead Test<br />
Assembly. (Units of Burnup are Defined as Megawatt days per kilogram of Heavy Elements)<br />
13
% Difference [( HELIOS - TVS-M ) / HELIOS]<br />
Full MOX LTA:<br />
(ORNL) HELIOS & (RRC-KI) TVS-M Results<br />
3.0<br />
2.0<br />
1.0<br />
0.0<br />
-1.0<br />
-2.0<br />
Peak Pin Power<br />
0.0 10.0 20.0 30.0 40.0<br />
Burnup (MWd/kgHE)<br />
Figure 4. Comparisons of Code Calculations for Full-MOX Lead Test Assembly. (Units of<br />
Burnup are Defined as Megawatt days per kilogram of Heavy Elements)<br />
14<br />
keff
Peak Pin Power Ratio<br />
1.50<br />
1.45<br />
1.40<br />
1.35<br />
1.30<br />
1.25<br />
1.20<br />
1.15<br />
1.10<br />
Island-2 (surrounded by 3.7wt% enr UOX):<br />
Effect of Periphery Pin MOX Enrichment<br />
2.0 2.5 3.0 3.5 4.0 4.5<br />
Periphery MOX Pin Fissile Pu (wt%)<br />
Figure 5. Optimization Curves for Two-Zone Pu Concentrations for the Island LTA Studies<br />
15<br />
Central MOX Fissile<br />
Pu (wt% HE)<br />
4.2<br />
3.8<br />
3.5<br />
3.2<br />
3.0
Reactivity [1/k_inf,unvoid - 1/k_inf,void] (%)<br />
0.00<br />
-40.00<br />
-80.00<br />
-120.00<br />
Void Reactivity Effect for LEU<br />
0.0 20.0 40.0 60.0 80.0 100.0<br />
Void (%)<br />
Solid curves are for fresh fuel;<br />
Dashed curves are for midburnup fuel (20 MWd/kg)<br />
Figure 6. Void Reactivity Effects in LEU Fuel for Various Enrichments. The Fuel Enrichment<br />
(in wt% 235 U) is Shown at the Right Axis for Each Pair of Curves.<br />
16<br />
20%<br />
16%<br />
12%<br />
8%<br />
6%<br />
4%<br />
2%
Reactivity [1/k_inf,unvoid - 1/k_inf,void] (%)<br />
-120.00<br />
Void Reactivity Effect for Reactor-Grade MOX<br />
0.00<br />
-40.00<br />
-80.00<br />
0.0 20.0 40.0 60.0 80.0 100.0<br />
Void (%)<br />
Solid curves are for fresh fuel;<br />
Dashed curves are for midburnup fuel (20 MWd/kg)<br />
Figure 7. Void Reactivity Effects in RG MOX for Various Pu-Contents. The Fuel Pu Loading<br />
(in wt% Pu) is Shown at the Right Axis for Each Pair of Curves.<br />
17<br />
20%<br />
16%<br />
12%<br />
8%<br />
6%<br />
4%<br />
2%
Reactivity [1/k_inf,unvoid - 1/k_inf,void] (%)<br />
Void Reactivity Effect for Weapons-Grade MOX<br />
0.00<br />
-40.00<br />
-80.00<br />
-120.00<br />
0.0 20.0 40.0 60.0 80.0 100.0<br />
Void (%)<br />
Solid curves are for fresh fuel;<br />
Dashed curves are for midburnup (20 MWd/kg)<br />
Figure 8. Void Reactivity Effects in WG MOX Fuel for Various Pu-Contents. The Fuel Pu<br />
Loading (in wt% Pu) is Shown at the Right Axis for Each Pair of Curves.<br />
18<br />
20%<br />
16%<br />
12%<br />
8%<br />
6%<br />
4%<br />
2%