Automatic Mapping Clinical Notes to Medical - RMIT University
Automatic Mapping Clinical Notes to Medical - RMIT University
Automatic Mapping Clinical Notes to Medical - RMIT University

Create successful ePaper yourself
Turn your PDF publications into a flip-book with our unique Google optimized e-Paper software.
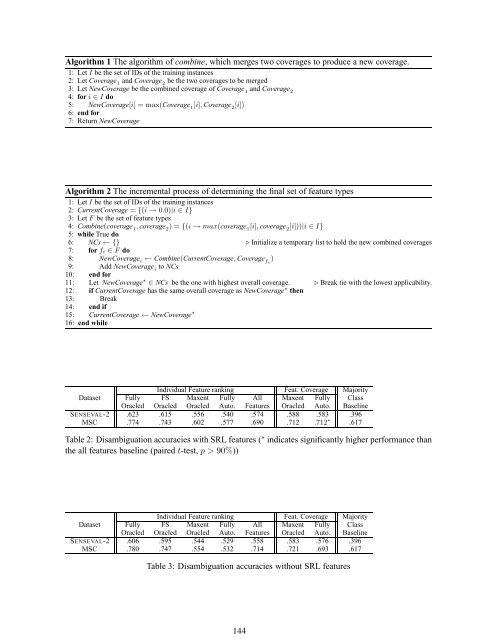
Algorithm 1 The algorithm of combine, which merges two coverages <strong>to</strong> produce a new coverage.<br />
1: Let I be the set of IDs of the training instances<br />
2: Let Coverage 1 and Coverage 2 be the two coverages <strong>to</strong> be merged<br />
3: Let NewCoverage be the combined coverage of Coverage 1 and Coverage 2<br />
4: for i ∈ I do<br />
5: NewCoverage[i] = max(Coverage 1 [i], Coverage 2 [i])<br />
6: end for<br />
7: Return NewCoverage<br />
Algorithm 2 The incremental process of determining the final set of feature types<br />
1: Let I be the set of IDs of the training instances<br />
2: CurrentCoverage = {(i → 0.0)|i ∈ I}<br />
3: Let F be the set of feature types<br />
4: Combine(coverage 1 , coverage 2 ) = {(i → max(coverage 1 [i], coverage 2 [i]))|i ∈ I}<br />
5: while True do<br />
6: NCs ← {} ⊲ Initialize a temporary list <strong>to</strong> hold the new combined coverages<br />
7: for fi ∈ F do<br />
8: NewCoverage i ← Combine(CurrentCoverage, Coverage fi )<br />
9: Add NewCoverage i <strong>to</strong> NCs<br />
10: end for<br />
11: Let NewCoverage ⋆ ∈ NCs be the one with highest overall coverage. ⊲ Break tie with the lowest applicability.<br />
12: if CurrentCoverage has the same overall coverage as NewCoverage ⋆ then<br />
13: Break<br />
14: end if<br />
15: CurrentCoverage ← NewCoverage ⋆<br />
16: end while<br />
Individual Feature ranking Feat. Coverage Majority<br />
Dataset Fully FS Maxent Fully All Maxent Fully Class<br />
Oracled Oracled Oracled Au<strong>to</strong>. Features Oracled Au<strong>to</strong>. Baseline<br />
SENSEVAL-2 .623 .615 .556 .540 .574 .588 .583 .396<br />
MSC .774 .743 .602 .577 .690 .712 .712 ∗<br />
.617<br />
Table 2: Disambiguation accuracies with SRL features ( ∗ indicates significantly higher performance than<br />
the all features baseline (paired t-test, p > 90%))<br />
Individual Feature ranking Feat. Coverage Majority<br />
Dataset Fully FS Maxent Fully All Maxent Fully Class<br />
Oracled Oracled Oracled Au<strong>to</strong>. Features Oracled Au<strong>to</strong>. Baseline<br />
SENSEVAL-2 .606 .595 .544 .529 .558 .583 .576 .396<br />
MSC .780 .747 .554 .532 .714 .721 .693 .617<br />
Table 3: Disambiguation accuracies without SRL features<br />
144