Automatic Mapping Clinical Notes to Medical - RMIT University
Automatic Mapping Clinical Notes to Medical - RMIT University
Automatic Mapping Clinical Notes to Medical - RMIT University

You also want an ePaper? Increase the reach of your titles
YUMPU automatically turns print PDFs into web optimized ePapers that Google loves.
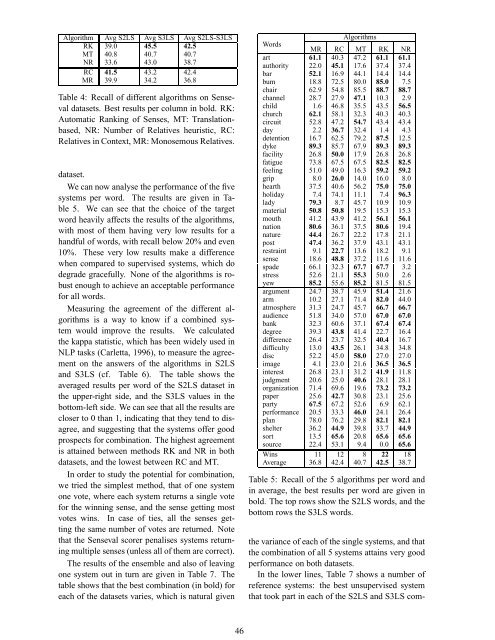
Algorithm Avg S2LS Avg S3LS Avg S2LS-S3LS<br />
RK 39.0 45.5 42.5<br />
MT 40.8 40.7 40.7<br />
NR 33.6 43.0 38.7<br />
RC 41.5 43.2 42.4<br />
MR 39.9 34.2 36.8<br />
Table 4: Recall of different algorithms on Senseval<br />
datasets. Best results per column in bold. RK:<br />
<strong>Au<strong>to</strong>matic</strong> Ranking of Senses, MT: Translationbased,<br />
NR: Number of Relatives heuristic, RC:<br />
Relatives in Context, MR: Monosemous Relatives.<br />
dataset.<br />
We can now analyse the performance of the five<br />
systems per word. The results are given in Table<br />
5. We can see that the choice of the target<br />
word heavily affects the results of the algorithms,<br />
with most of them having very low results for a<br />
handful of words, with recall below 20% and even<br />
10%. These very low results make a difference<br />
when compared <strong>to</strong> supervised systems, which do<br />
degrade gracefully. None of the algorithms is robust<br />
enough <strong>to</strong> achieve an acceptable performance<br />
for all words.<br />
Measuring the agreement of the different algorithms<br />
is a way <strong>to</strong> know if a combined system<br />
would improve the results. We calculated<br />
the kappa statistic, which has been widely used in<br />
NLP tasks (Carletta, 1996), <strong>to</strong> measure the agreement<br />
on the answers of the algorithms in S2LS<br />
and S3LS (cf. Table 6). The table shows the<br />
averaged results per word of the S2LS dataset in<br />
the upper-right side, and the S3LS values in the<br />
bot<strong>to</strong>m-left side. We can see that all the results are<br />
closer <strong>to</strong> 0 than 1, indicating that they tend <strong>to</strong> disagree,<br />
and suggesting that the systems offer good<br />
prospects for combination. The highest agreement<br />
is attained between methods RK and NR in both<br />
datasets, and the lowest between RC and MT.<br />
In order <strong>to</strong> study the potential for combination,<br />
we tried the simplest method, that of one system<br />
one vote, where each system returns a single vote<br />
for the winning sense, and the sense getting most<br />
votes wins. In case of ties, all the senses getting<br />
the same number of votes are returned. Note<br />
that the Senseval scorer penalises systems returning<br />
multiple senses (unless all of them are correct).<br />
The results of the ensemble and also of leaving<br />
one system out in turn are given in Table 7. The<br />
table shows that the best combination (in bold) for<br />
each of the datasets varies, which is natural given<br />
46<br />
Algorithms<br />
Words<br />
MR RC MT RK NR<br />
art 61.1 40.3 47.2 61.1 61.1<br />
authority 22.0 45.1 17.6 37.4 37.4<br />
bar 52.1 16.9 44.1 14.4 14.4<br />
bum 18.8 72.5 80.0 85.0 7.5<br />
chair 62.9 54.8 85.5 88.7 88.7<br />
channel 28.7 27.9 47.1 10.3 2.9<br />
child 1.6 46.8 35.5 43.5 56.5<br />
church 62.1 58.1 32.3 40.3 40.3<br />
circuit 52.8 47.2 54.7 43.4 43.4<br />
day 2.2 36.7 32.4 1.4 4.3<br />
detention 16.7 62.5 79.2 87.5 12.5<br />
dyke 89.3 85.7 67.9 89.3 89.3<br />
facility 26.8 50.0 17.9 26.8 26.8<br />
fatigue 73.8 67.5 67.5 82.5 82.5<br />
feeling 51.0 49.0 16.3 59.2 59.2<br />
grip 8.0 26.0 14.0 16.0 8.0<br />
hearth 37.5 40.6 56.2 75.0 75.0<br />
holiday 7.4 74.1 11.1 7.4 96.3<br />
lady 79.3 8.7 45.7 10.9 10.9<br />
material 50.8 50.8 19.5 15.3 15.3<br />
mouth 41.2 43.9 41.2 56.1 56.1<br />
nation 80.6 36.1 37.5 80.6 19.4<br />
nature 44.4 26.7 22.2 17.8 21.1<br />
post 47.4 36.2 37.9 43.1 43.1<br />
restraint 9.1 22.7 13.6 18.2 9.1<br />
sense 18.6 48.8 37.2 11.6 11.6<br />
spade 66.1 32.3 67.7 67.7 3.2<br />
stress 52.6 21.1 55.3 50.0 2.6<br />
yew 85.2 55.6 85.2 81.5 81.5<br />
argument 24.7 38.7 45.9 51.4 21.6<br />
arm 10.2 27.1 71.4 82.0 44.0<br />
atmosphere 31.3 24.7 45.7 66.7 66.7<br />
audience 51.8 34.0 57.0 67.0 67.0<br />
bank 32.3 60.6 37.1 67.4 67.4<br />
degree 39.3 43.8 41.4 22.7 16.4<br />
difference 26.4 23.7 32.5 40.4 16.7<br />
difficulty 13.0 43.5 26.1 34.8 34.8<br />
disc 52.2 45.0 58.0 27.0 27.0<br />
image 4.1 23.0 21.6 36.5 36.5<br />
interest 26.8 23.1 31.2 41.9 11.8<br />
judgment 20.6 25.0 40.6 28.1 28.1<br />
organization 71.4 69.6 19.6 73.2 73.2<br />
paper 25.6 42.7 30.8 23.1 25.6<br />
party 67.5 67.2 52.6 6.9 62.1<br />
performance 20.5 33.3 46.0 24.1 26.4<br />
plan 78.0 76.2 29.8 82.1 82.1<br />
shelter 36.2 44.9 39.8 33.7 44.9<br />
sort 13.5 65.6 20.8 65.6 65.6<br />
source 22.4 53.1 9.4 0.0 65.6<br />
Wins 11 12 8 22 18<br />
Average 36.8 42.4 40.7 42.5 38.7<br />
Table 5: Recall of the 5 algorithms per word and<br />
in average, the best results per word are given in<br />
bold. The <strong>to</strong>p rows show the S2LS words, and the<br />
bot<strong>to</strong>m rows the S3LS words.<br />
the variance of each of the single systems, and that<br />
the combination of all 5 systems attains very good<br />
performance on both datasets.<br />
In the lower lines, Table 7 shows a number of<br />
reference systems: the best unsupervised system<br />
that <strong>to</strong>ok part in each of the S2LS and S3LS com-