Automatic Mapping Clinical Notes to Medical - RMIT University
Automatic Mapping Clinical Notes to Medical - RMIT University
Automatic Mapping Clinical Notes to Medical - RMIT University

You also want an ePaper? Increase the reach of your titles
YUMPU automatically turns print PDFs into web optimized ePapers that Google loves.
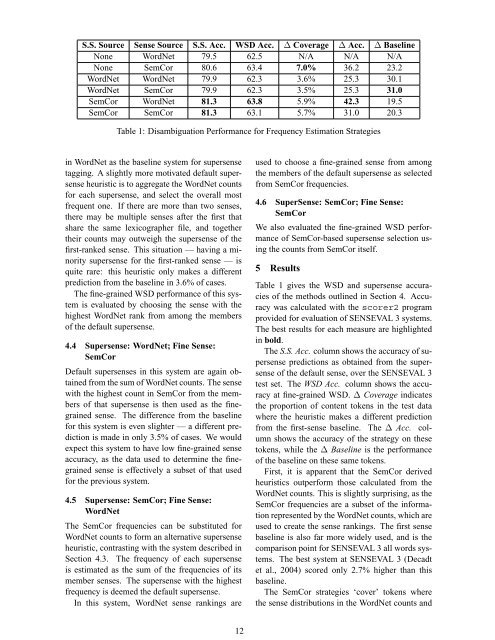
S.S. Source Sense Source S.S. Acc. WSD Acc. ∆ Coverage ∆ Acc. ∆ Baseline<br />
None WordNet 79.5 62.5 N/A N/A N/A<br />
None SemCor 80.6 63.4 7.0% 36.2 23.2<br />
WordNet WordNet 79.9 62.3 3.6% 25.3 30.1<br />
WordNet SemCor 79.9 62.3 3.5% 25.3 31.0<br />
SemCor WordNet 81.3 63.8 5.9% 42.3 19.5<br />
SemCor SemCor 81.3 63.1 5.7% 31.0 20.3<br />
Table 1: Disambiguation Performance for Frequency Estimation Strategies<br />
in WordNet as the baseline system for supersense<br />
tagging. A slightly more motivated default supersense<br />
heuristic is <strong>to</strong> aggregate the WordNet counts<br />
for each supersense, and select the overall most<br />
frequent one. If there are more than two senses,<br />
there may be multiple senses after the first that<br />
share the same lexicographer file, and <strong>to</strong>gether<br />
their counts may outweigh the supersense of the<br />
first-ranked sense. This situation — having a minority<br />
supersense for the first-ranked sense — is<br />
quite rare: this heuristic only makes a different<br />
prediction from the baseline in 3.6% of cases.<br />
The fine-grained WSD performance of this system<br />
is evaluated by choosing the sense with the<br />
highest WordNet rank from among the members<br />
of the default supersense.<br />
4.4 Supersense: WordNet; Fine Sense:<br />
SemCor<br />
Default supersenses in this system are again obtained<br />
from the sum of WordNet counts. The sense<br />
with the highest count in SemCor from the members<br />
of that supersense is then used as the finegrained<br />
sense. The difference from the baseline<br />
for this system is even slighter — a different prediction<br />
is made in only 3.5% of cases. We would<br />
expect this system <strong>to</strong> have low fine-grained sense<br />
accuracy, as the data used <strong>to</strong> determine the finegrained<br />
sense is effectively a subset of that used<br />
for the previous system.<br />
4.5 Supersense: SemCor; Fine Sense:<br />
WordNet<br />
The SemCor frequencies can be substituted for<br />
WordNet counts <strong>to</strong> form an alternative supersense<br />
heuristic, contrasting with the system described in<br />
Section 4.3. The frequency of each supersense<br />
is estimated as the sum of the frequencies of its<br />
member senses. The supersense with the highest<br />
frequency is deemed the default supersense.<br />
In this system, WordNet sense rankings are<br />
12<br />
used <strong>to</strong> choose a fine-grained sense from among<br />
the members of the default supersense as selected<br />
from SemCor frequencies.<br />
4.6 SuperSense: SemCor; Fine Sense:<br />
SemCor<br />
We also evaluated the fine-grained WSD performance<br />
of SemCor-based supersense selection using<br />
the counts from SemCor itself.<br />
5 Results<br />
Table 1 gives the WSD and supersense accuracies<br />
of the methods outlined in Section 4. Accuracy<br />
was calculated with the scorer2 program<br />
provided for evaluation of SENSEVAL 3 systems.<br />
The best results for each measure are highlighted<br />
in bold.<br />
The S.S. Acc. column shows the accuracy of supersense<br />
predictions as obtained from the supersense<br />
of the default sense, over the SENSEVAL 3<br />
test set. The WSD Acc. column shows the accuracy<br />
at fine-grained WSD. ∆ Coverage indicates<br />
the proportion of content <strong>to</strong>kens in the test data<br />
where the heuristic makes a different prediction<br />
from the first-sense baseline. The ∆ Acc. column<br />
shows the accuracy of the strategy on these<br />
<strong>to</strong>kens, while the ∆ Baseline is the performance<br />
of the baseline on these same <strong>to</strong>kens.<br />
First, it is apparent that the SemCor derived<br />
heuristics outperform those calculated from the<br />
WordNet counts. This is slightly surprising, as the<br />
SemCor frequencies are a subset of the information<br />
represented by the WordNet counts, which are<br />
used <strong>to</strong> create the sense rankings. The first sense<br />
baseline is also far more widely used, and is the<br />
comparison point for SENSEVAL 3 all words systems.<br />
The best system at SENSEVAL 3 (Decadt<br />
et al., 2004) scored only 2.7% higher than this<br />
baseline.<br />
The SemCor strategies ‘cover’ <strong>to</strong>kens where<br />
the sense distributions in the WordNet counts and