Annual Report 2010-2011 - Western Australian Museum
Annual Report 2010-2011 - Western Australian Museum
Annual Report 2010-2011 - Western Australian Museum

You also want an ePaper? Increase the reach of your titles
YUMPU automatically turns print PDFs into web optimized ePapers that Google loves.
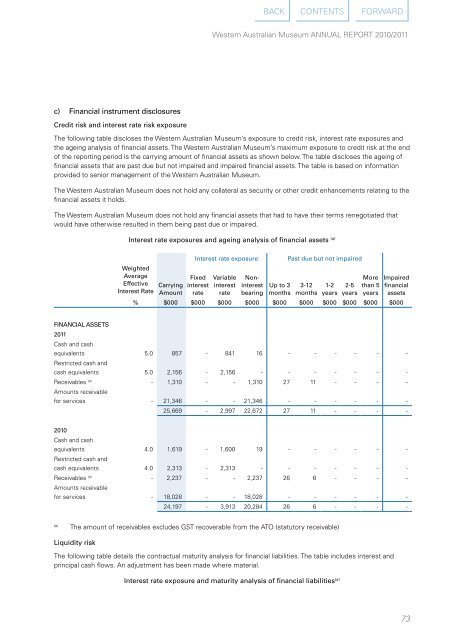
c) financial instrument disclosures<br />
credit risk and interest rate risk exposure<br />
<strong>Western</strong> <strong>Australian</strong> <strong>Museum</strong> ANNUAL REPORT <strong>2010</strong>/<strong>2011</strong><br />
The following table discloses the <strong>Western</strong> <strong>Australian</strong> <strong>Museum</strong>’s exposure to credit risk, interest rate exposures and<br />
the ageing analysis of financial assets. The <strong>Western</strong> <strong>Australian</strong> <strong>Museum</strong>’s maximum exposure to credit risk at the end<br />
of the reporting period is the carrying amount of financial assets as shown below. The table discloses the ageing of<br />
financial assets that are past due but not impaired and impaired financial assets. The table is based on information<br />
provided to senior management of the <strong>Western</strong> <strong>Australian</strong> <strong>Museum</strong>.<br />
The <strong>Western</strong> <strong>Australian</strong> <strong>Museum</strong> does not hold any collateral as security or other credit enhancements relating to the<br />
financial assets it holds.<br />
The <strong>Western</strong> <strong>Australian</strong> <strong>Museum</strong> does not hold any financial assets that had to have their terms renegotiated that<br />
would have otherwise resulted in them being past due or impaired.<br />
interest rate exposures and ageing analysis of financial assets (a)<br />
weighted<br />
Average<br />
effective<br />
interest Rate carrying<br />
Amount<br />
interest rate exposure past due but not impaired<br />
fixed<br />
interest<br />
rate<br />
variable<br />
interest<br />
rate<br />
noninterest<br />
bearing<br />
up to 3<br />
months<br />
3-12<br />
months<br />
1-2<br />
years<br />
2-5<br />
years<br />
More<br />
than 5<br />
years<br />
impaired<br />
financial<br />
assets<br />
% $000 $000 $000 $000 $000 $000 $000 $000 $000 $000<br />
finAnciAl Assets<br />
<strong>2011</strong><br />
Cash and cash<br />
equivalents<br />
Restricted cash and<br />
5.0 857 - 841 16 - - - - - -<br />
cash equivalents 5.0 2,156 - 2,156 - - - - - - -<br />
Receivables (a) Amounts receivable<br />
- 1,310 - - 1,310 27 11 - - - -<br />
for services - 21,346 - - 21,346 - - - - - -<br />
25,669 - 2,997 22,672 27 11 - - - -<br />
<strong>2010</strong><br />
Cash and cash<br />
equivalents<br />
Restricted cash and<br />
4.0 1,619 - 1,600 19 - - - - - -<br />
cash equivalents 4.0 2,313 - 2,313 - - - - - - -<br />
Receivables (a) Amounts receivable<br />
- 2,237 - - 2,237 26 6 - - - -<br />
for services - 18,028 - - 18,028 - - - - - -<br />
24,197 - 3,913 20,284 26 6 - - - -<br />
(a) The amount of receivables excludes GST recoverable from the ATO (statutory receivable)<br />
liquidity risk<br />
BACK CONTENTS FORWARD<br />
The following table details the contractual maturity analysis for financial liabilities. The table includes interest and<br />
principal cash flows. An adjustment has been made where material.<br />
interest rate exposure and maturity analysis of financial liabilities (a)<br />
73