SUNNYVALE CONSOLIDATED IN 2011 GENERAL PLAN - City of ...
SUNNYVALE CONSOLIDATED IN 2011 GENERAL PLAN - City of ...
SUNNYVALE CONSOLIDATED IN 2011 GENERAL PLAN - City of ...

You also want an ePaper? Increase the reach of your titles
YUMPU automatically turns print PDFs into web optimized ePapers that Google loves.
sunnyvale<br />
GeneRal plan<br />
consolidated in <strong>2011</strong>
Acknowledgments<br />
CITY COUNCIL<br />
Melinda Hamilton, Mayor<br />
Jim Griffith, Vice Mayor<br />
Otto Lee, Councilmember<br />
Ron Swegles, former Councilmember<br />
Christopher R. Moylan, Councilmember<br />
Anthony Spitaleri, Councilmember<br />
David Whittum, Councilmember<br />
<strong>PLAN</strong>N<strong>IN</strong>G COMMISSION<br />
Nick Travis, Chair<br />
Glenn Hendricks, Vice Chair<br />
Bo Chang<br />
Maria Dohadwala<br />
Charles Hungerford<br />
Gustav Larsson<br />
Brandon Sulser<br />
<strong>GENERAL</strong> <strong>PLAN</strong> CONSOLIDATION<br />
ADVISORY COMMITTEE<br />
Pedro Baltar, Board <strong>of</strong> Building Code Appeals<br />
Hannalore Dietrich, Housing and Human Services<br />
Commission<br />
Ralph Durham, Bicycle and Pedestrian Advisory<br />
Commission<br />
Tom Flaherty, Board <strong>of</strong> Library Trustees<br />
Fred Fowler, Housing and Human Services Commission<br />
Jim Griffith, <strong>City</strong> Council<br />
Robert Harms, Parks and Recreation Commission<br />
Glenn Hendricks, Personnel Board<br />
Noelle Hughes, Arts Commission<br />
Charles Hungerford, Planning Commission<br />
Larry Klein, Planning Commission<br />
Tara Martin-Milius, Arts Commission<br />
Nancy McDonough, Heritage Preservation Commission<br />
Christopher R. Moylan, <strong>City</strong> Council<br />
David Musgrave, Board <strong>of</strong> Building Code Appeals<br />
Judi Nickey, Personnel Board<br />
Narendra Pathak, Board <strong>of</strong> Library Trustees<br />
Robert Pochowski, Parks and Recreation Commission<br />
David Squellati, Heritage Preservation Commission<br />
Brandon Sulser, Planning Commission<br />
Patrick Walz, Bicycle and Pedestrian Advisory<br />
Commission<br />
David Whittum, <strong>City</strong> Council<br />
CITY STAff<br />
Gary Luebbers, <strong>City</strong> Manager<br />
David Kahn, <strong>City</strong> Attorney<br />
Hanson Hom, Director, CDD<br />
Trudi Ryan, Planning Officer, CDD<br />
Diana O’Dell, Project Planner, CDD<br />
Andrew Miner, CDD<br />
Jim Craig, DPW<br />
Michael Chan, DPW<br />
Cathy Merrill, DCS<br />
Don Johnson, DPS<br />
Coryn Campbell, OCM<br />
Yvette Blackford, OCM<br />
Rosemarie Zulueta, CDD<br />
Elise Lieberman, CDD<br />
GRAPhIC ARTIST<br />
Studio Em
table<br />
<strong>of</strong> contents
<strong>City</strong> <strong>of</strong> Sunnyvale GeneRal plan – July <strong>2011</strong><br />
ii<br />
Chapter 1<br />
IntroductIon........................................................................................... 1-1<br />
Introducing the Sunnyvale General Plan ...................................................... 1-3<br />
Chapter 2<br />
communIty VISIon ................................................................................ 2–1<br />
Sunnyvale’s History .......................................................................................... 2–3<br />
community conditions .................................................................................. 2–5<br />
Assets and Issues ............................................................................................. 2–27<br />
Future challenges ............................................................................................ 2–29<br />
Values and Vision ............................................................................................. 2–33<br />
citywide Vision Goals ..................................................................................... 2–35<br />
Balanced Growth .............................................................................................. 2–44<br />
Looking Forward to 2025 ................................................................................ 2–49<br />
Chapter 3<br />
LAnd uSe And trAnSPortAtIon ..................................................... 3–1<br />
Land use ............................................................................................................ 3–3<br />
transportation .................................................................................................. 3–18<br />
economy............................................................................................................ 3–26<br />
open Space ....................................................................................................... 3–31<br />
Chapter 4<br />
communIty cHArActer ..................................................................... 4–1<br />
design ................................................................................................................ 4–3<br />
Heritage Preservation ...................................................................................... 4–17<br />
Library ............................................................................................................... 4–22<br />
Arts..................................................................................................................... 4–25<br />
recreation ......................................................................................................... 4–28<br />
Chapter 5<br />
HouSInG ........................................................................................................ 5–1<br />
Housing ............................................................................................................. 5–3
Chapter 6<br />
SAFety And noISe .................................................................................... 6–1<br />
Hazards and disaster Preparedness and response ..................................... 6–3<br />
Police, Fire and emergency Services ............................................................. 6–18<br />
noise .................................................................................................................. 6–28<br />
Chapter 7<br />
enVIronmentAL mAnAGement ...................................................... 7–1<br />
Wastewater collection and treatment .......................................................... 7–14<br />
Water collection System ................................................................................. 7–15<br />
Water Pollution control Plant ........................................................................ 7–16<br />
urban run<strong>of</strong>f .................................................................................................... 7–20<br />
Air Quality ........................................................................................................ 7–28<br />
Solid Waste ........................................................................................................ 7–32<br />
appendix a<br />
ImPLementAtIon PLAnS ....................................................................... A–1<br />
citywide Implementation Programs ............................................................. A–2<br />
appendix B<br />
GLoSSAry ....................................................................................................... B–1<br />
appendix C<br />
Index............................................................................................................... c–1<br />
appendix d<br />
LISt oF AdoPtInG reSoLutIonS....................................................... d–1<br />
<strong>2011</strong> Adopting resolution .............................................................................. d–2<br />
appendix e, f, G and h<br />
iii<br />
taBle <strong>of</strong> ContentS
<strong>City</strong> <strong>of</strong> Sunnyvale GeneRal plan – July <strong>2011</strong><br />
iv<br />
taBle <strong>of</strong> fiGureS<br />
Figure 1-1 Sunnyvale Planning Area .....................................................1-6<br />
Figure 2-1 Population from 1912 – 2006 ..............................................2–5<br />
Figure 2-2 Labor Force Distribution ......................................................2–6<br />
Figure 2-3 Unemployment Rate By Year ..............................................2–7<br />
Figure 2-4 Median Household Income for Sunnyvale and<br />
Surrounding Cities ...............................................................2–8<br />
Figure 2-5 Age Characteristics .............................................................2–9<br />
Figure 2-6 Ethnicity ...............................................................................2–10<br />
Figure 2-7 Cities <strong>of</strong> Employment ..........................................................2–11<br />
Figure 2-8 Industrial Areas and Building Conditions Map ...................2–13<br />
Figure 2-9 Retail Sales Tax Analysis .....................................................2–15<br />
Figure 2-10 Community Shopping Centers and Grocery Stores Map .....2–16<br />
Figure 2-11 Land Uses .............................................................................2–17<br />
Figure 2-12 Housing Types ......................................................................2–18<br />
Figure 2-13 Residential Areas and Housing Conditions Map .................2–20<br />
Figure 2-14 Crime Totals by Year ............................................................2–23<br />
Figure 2-15 Sunnyvale School District Enrollment by Year ...................2–24<br />
Figure 2-16 <strong>City</strong>wide Growth Projections ...............................................2–44<br />
Figure 2-17 Potential Growth Areas – Housing Units and<br />
Office/Industrial Square Footage .........................................2–45<br />
Figure 2-18 Potential Growth Areas Map ................................................2–46<br />
Figure 2-19 Balanced Growth Pr<strong>of</strong>ile ......................................................2–47<br />
Figure 3-1 General Plan and Zoning Districts .......................................3–7<br />
Figure 3-2 General Plan Land Use Map ...............................................3–9<br />
Figure 3-3 Neighborhood Planning Areas .............................................3–32<br />
Figure 3-4 Level <strong>of</strong> Service for Park Types ...........................................3–33<br />
Figure 3-5 Park and School Field Service and Open Space Gap Areas 3–34<br />
Figure 3-6 Future Residential Growth Areas .........................................3–36<br />
Figure 3-7 Projected Residential Growth ..............................................3–37
Figure 4-1 <strong>City</strong> Form Map .....................................................................4–6<br />
Figure 4-2 Public Facilities Map ...........................................................4–15<br />
Figure 6-1 San Francisco Bay Region Earthquake Probability .............6–5<br />
Figure 6-2 FEMA Flood Hazard Map ...................................................6–7<br />
Figure 6-3 Decibel Levels <strong>of</strong> Common Sounds ....................................6–29<br />
Figure 6-4 010 Noise Conditions Map ..................................................6–31<br />
Figure 6-5 State <strong>of</strong> California Noise Guidelines for Land Use<br />
Planning Summary <strong>of</strong> Land Use Compatibility for<br />
Community Noise Environment ..........................................6–32<br />
Figure 6-6 Significant Noise Impacts from New Development<br />
on Existing Land Use ...........................................................6–33<br />
Figure 6-7 1997 Noise Exposure Map ...................................................6–39<br />
Figure 7-1 Water System Facilities Map ...............................................7–4<br />
Figure 7-2 Historical Percentage <strong>of</strong> Annual Water Deliveries<br />
by Source .............................................................................7–5<br />
Figure 7-3 Recycled Water System Map ..............................................7–7<br />
Figure 7-4 Annual Water Consumption by Use Category ....................7–9<br />
Figure 7-5 Historic and Projected Water Demand .................................7–10<br />
Figure 7-6 Capacities <strong>of</strong> Individual Sewer Collection Areas ................7–15<br />
Figure 7-7 Sewer Collection Area Maps ...............................................7–17<br />
Figure 7-8 Storm Drain System .............................................................7–24<br />
Figure 7-9 Where does it go? .................................................................7–25<br />
v<br />
taBle <strong>of</strong> fiGureS
<strong>City</strong> <strong>of</strong> Sunnyvale GeneRal plan – July <strong>2011</strong><br />
vi
chapteR 1<br />
intRoduction<br />
The Introduction describes the purpose <strong>of</strong> the General Plan, topics and<br />
organization and how this plan is put into action.
intRoduction — intRoducinG the sunnyvale GeneRal plan Chapter 1<br />
introduCinG the Sunnyvale General plan<br />
The <strong>City</strong> <strong>of</strong> Sunnyvale has a colorful history spanning almost 100 years since its<br />
incorporation. It began as a train stop in the agricultural promised land known as “The<br />
Valley <strong>of</strong> Hearts Delights” and with planning and foresight has transitioned into its<br />
current form as a desirable residential community and strategically located high-tech<br />
job center known as the “Heart <strong>of</strong> Silicon Valley.”<br />
The Sunnyvale General Plan has been a fundamental tool in guiding the <strong>City</strong> through<br />
change and growth. It addresses the physical development <strong>of</strong> the <strong>City</strong> and, when used<br />
together with a larger body <strong>of</strong> <strong>City</strong> Council policies, provides direction for decisionmaking<br />
on <strong>City</strong> services and resources. It is both a long-range and a strategic planning<br />
document, containing long-term goals and policies for the next 10-20 years and strategic<br />
actions for the next five to ten years.<br />
The past has shown us that change is constant and will occur whether planned for or<br />
not. While the future cannot be forecasted with certainty, the General Plan provides<br />
guiding goals and policies that have been selected to be both transforming yet realistic<br />
and practical so that Sunnyvale successfully emerges as a vibrant, innovative and<br />
attractive community in which both residents and businesses can thrive.<br />
Topics in the General Plan<br />
The state requires all cities to prepare and maintain a General Plan. Seven elements<br />
(topics) are required by state law: land use, circulation (transportation and utilities),<br />
housing, conservation, open space, noise, and safety. Communities have the ability to<br />
rename or combine these required elements as they choose as long as there is consistency<br />
within and among the documents. Communities may also incorporate within their<br />
General Plan other matters which are believed to be <strong>of</strong> particular local concern.<br />
Sunnyvale’s General Plan consists <strong>of</strong> a Community Vision and five supporting<br />
chapters addressing the physical development <strong>of</strong> the <strong>City</strong>. These chapters group related<br />
topics together such as Community Character, Safety and Noise, and Environmental<br />
Management. The following is a summary <strong>of</strong> the topics found in this General Plan.<br />
Mandated elements are noted.<br />
“Make no little plans; they<br />
have no magic to stir men’s<br />
blood and probably will<br />
themselves not be realized.<br />
Make big plans; aim high in<br />
hope and work, remembering<br />
that a noble, logical diagram<br />
once recorded will not die.”<br />
— Daniel H. Burnham<br />
1-3
<strong>City</strong> <strong>of</strong> Sunnyvale GeneRal plan – July <strong>2011</strong><br />
1-4<br />
Chapter 1 introduction<br />
• Overview <strong>of</strong> General Plan organization and topics<br />
Chapter 2 Community vision<br />
• Sunnyvale History<br />
• Community Conditions<br />
• Assets and Issues<br />
• <strong>City</strong>wide Vision Goals<br />
• Balanced Growth<br />
• Looking Forward<br />
Chapter 3 land use and transportation<br />
(state-mandated Land Use, Open Space and Circulation Element,<br />
transportation section)<br />
• Land Use<br />
• Transportation<br />
• Economy<br />
• Open Space<br />
Chapter 4 Community Character<br />
• Design<br />
• Heritage Preservation<br />
• Library<br />
• Arts<br />
• Recreation<br />
Chapter 5 housing<br />
(state-mandated Housing Element)<br />
Chapter 6 Safety and noise<br />
(state-mandated Safety and Noise Elements)<br />
• Hazards and Disaster Preparedness<br />
• Police, Fire and Emergency Services<br />
• Noise<br />
Chapter 7 environmental Management<br />
(state-mandated Conservation Element and Circulation Element, public<br />
utilities section)<br />
• Water Supply<br />
• Wastewater Collection and Treatment<br />
• Urban Run<strong>of</strong>f<br />
• Air Quality<br />
• Solid Waste
intRoduction — intRoducinG the sunnyvale GeneRal plan Chapter 1<br />
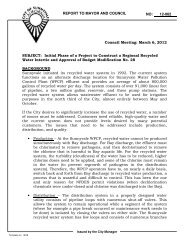
These elements address the areas within the boundaries <strong>of</strong> the <strong>City</strong>, including the sphere<br />
<strong>of</strong> influence (see Figure 1-1, Sunnyvale Planning Area).<br />
The Consolidation <strong>of</strong> the General Plan<br />
This General Plan was assembled from 22 separate General Plan elements and subelements<br />
that were adopted at different times. This consolidated and streamlined<br />
General Plan contains all necessary goal and policy language to address the required<br />
elements in a concise and easy-to use fashion. Goals reference the year <strong>of</strong> the original<br />
adoption as well as the original goal or policy number. Narrative has been condensed<br />
and the original General Plan text is still available on the <strong>City</strong>’s website at GeneralPlan.<br />
inSunnyvale.com for reference.<br />
how to Use the General Plan<br />
The General Plan provides both basic information about our community and goals<br />
and policies to help us achieve our desired future. The General Plan can be understood<br />
on a broad citywide level and also on an individual level. <strong>City</strong>wide, the General Plan<br />
provides demographic information, including population, housing, transportation and<br />
public works improvements that describe the <strong>City</strong>’s residents and businesses and future<br />
changes that will affect them. Land use plans, growth areas and projections and future<br />
infrastructure improvements are described. On an individual level, the General Plan<br />
also can provide information specific to a resident or business. Individuals can find<br />
general types <strong>of</strong> uses that are permitted in and near a home or business, long-range<br />
plans and changes that may affect a neighborhood or business area and actions the <strong>City</strong><br />
will take to retain and improve the quality <strong>of</strong> life in Sunnyvale.<br />
This General Plan is organized around a set <strong>of</strong> goals. Goals are long-range, broad and<br />
comprehensive targets. They are not necessarily measurable or achievable in the lifespan<br />
<strong>of</strong> this General Plan; rather, they describe the overall future outcome the community<br />
would like to achieve. Each goal is accompanied by a context for the goal, related<br />
community conditions, future trends or issues and supporting policies.<br />
policies indicate ways to achieve the goal. Policies are focused and specific instructional<br />
guidelines. This General Plan contains an Executive Summary <strong>of</strong> only goals and policies<br />
for ease <strong>of</strong> use.<br />
Translating the General Plan into Action<br />
Goals and policies are used by the community, staff and decision-makers to guide<br />
decisions relating to the physical development <strong>of</strong> the <strong>City</strong> including land use,<br />
infrastructure and related budgetary decisions. Future development decisions must<br />
be consistent with the General Plan. To assist community members and decisionmakers,<br />
goals and policies are referenced in all staff reports and findings related to the<br />
development <strong>of</strong> the <strong>City</strong>. Goals and policies are also carried out through two types <strong>of</strong><br />
activities: sub-policies and implementation programs.<br />
Sub-policies provide more specific directions and actions to further articulate and<br />
achieve the goals and policies. They are the critical link between long-range planning<br />
Sphere <strong>of</strong> Influence — a<br />
geographic area established<br />
by the Santa Clara County<br />
local agency formation<br />
Commission as “a plan<br />
for the probable physical<br />
boundaries and service<br />
area <strong>of</strong> a local government<br />
agency.” (Government Code<br />
Section 56076)<br />
the online version <strong>of</strong> the<br />
General plan provides<br />
easy-to-use links to other<br />
sections <strong>of</strong> the document,<br />
supporting information,<br />
and outside agencies and<br />
programs. please visit<br />
GeneralPlan.inSunnyvale.com<br />
to view the online version <strong>of</strong><br />
this document.<br />
1-5
<strong>City</strong> <strong>of</strong> Sunnyvale GeneRal plan – July <strong>2011</strong><br />
figure 1-1:<br />
Sunnyvale Planning Area<br />
Sunnyvale covers 22.8<br />
square miles with a sphere <strong>of</strong><br />
influence <strong>of</strong> approximately<br />
1.2 miles.<br />
1-6<br />
FOOTHILL EXPRESSWAY<br />
Sunnyvale Planning Area<br />
Palo Alto<br />
US-280<br />
RANCHO SAN ANTONIO<br />
OPEN SPACE PRESERVE<br />
<strong>City</strong> Boundary<br />
Sphere <strong>of</strong> Influence<br />
PERMANENTE CREEK<br />
US-101<br />
MIDDLEFIELD<br />
Mountain View<br />
EL CAM<strong>IN</strong>O REAL<br />
GRANT<br />
STEVENS CREEK<br />
Los Altos<br />
Community Development Department, <strong>2011</strong><br />
SAN<br />
FRANCISCO<br />
BAY<br />
NASA Ames<br />
Research Center<br />
CA-85<br />
M<strong>of</strong>fett Federal Airfield<br />
BERNARDO<br />
CA-237<br />
FREMONT<br />
MARY<br />
<strong>SUNNYVALE</strong><br />
SPHERE OF<br />
<strong>IN</strong>FLUENCE<br />
REM<strong>IN</strong>GTON<br />
HOLLENBECK<br />
STELL<strong>IN</strong>G<br />
MAUDE<br />
MATHILDA<br />
CENTRAL EXPRESSWAY<br />
<strong>SUNNYVALE</strong><br />
GUADALUPE SLO UGH<br />
CALIFORNIA<br />
<strong>SUNNYVALE</strong> SARATOGA OLD SAN FRANCISCO<br />
US-280<br />
Cupertino<br />
FAIR OAKS<br />
EL CAM<strong>IN</strong>O REAL<br />
WOLFE<br />
JAVA<br />
FAIR OAKS<br />
Sunnyvale<br />
ARQUES<br />
CARIBBEAN<br />
EVELYN<br />
TASMAN<br />
REED<br />
HOMESTEAD<br />
ALVISO SLOUGH<br />
LAWRENCE EXPRESSWAY<br />
LAWRENCE EXPRESSWAY<br />
Fremont<br />
CA-237<br />
MONROE<br />
CALAB AZAS CREEK<br />
KIFER<br />
San Jose<br />
GREAT AMERICA<br />
BOWERS<br />
US-101<br />
SAN TOMAS AQU<strong>IN</strong>O CREEK<br />
Santa Clara<br />
Highway/Expressway<br />
Major Streets<br />
! Train Station<br />
Railroad<br />
! Light Rail Station<br />
Light Rail<br />
0.5<br />
Miles<br />
¸<br />
SCOTT<br />
WALSH
and current decision making. Sub-policies steps are not needed for each policy and can<br />
be short-range or longer-term actions. Sub-policies, when applicable, are listed below<br />
each related policy as a bullet.<br />
Implementation programs are longer-range procedures, programs or activities that<br />
also carry out the goals and policies. Implementation programs can be included in<br />
Sunnyvale Municipal Code regulations, specific plans, capital improvement projects,<br />
or subdivision ordinances, as examples. A list <strong>of</strong> implementation programs is located<br />
in Appendix A.<br />
Public Participation<br />
This General Plan was consolidated with input from the community and an Advisory<br />
Committee made up <strong>of</strong> <strong>City</strong> Boards and Commissions members. Any future amendments<br />
<strong>of</strong> the General Plan will be subject to further community input and public hearings.<br />
Steps forward<br />
intRoduction — intRoducinG the sunnyvale GeneRal plan Chapter 1<br />
Future incremental updates <strong>of</strong> the General Plan may be needed as community conditions<br />
change. In approximately 10 years (2021) a comprehensive update <strong>of</strong> this document will<br />
be undertaken, updating the community’s conditions and all the goals, policies, and<br />
actions within the document.<br />
1-7
chapteR 2<br />
community<br />
vision<br />
The Community Vision describes the past, present and desired future<br />
<strong>of</strong> Sunnyvale in broad, citywide terms. It provides both the background<br />
statement and the forward-looking vision upon which the functional<br />
elements <strong>of</strong> the Plan are based. As such, it is the overarching component<br />
<strong>of</strong> the General Plan, the source from which each <strong>of</strong> the functional<br />
elements springs.
Sunnyvale’S hiStory<br />
community vision – sunnyvale’s histoRy Chapter 2<br />
Sunnyvale is a relatively young city, incorporated in 1912. Its mild climate and fertile<br />
soil, however, have provided a comfortable and productive place for human settlement<br />
for many millennia. A peaceful Ohlone Indian village (Posolmi) thrived in the area<br />
which is now M<strong>of</strong>fett Federal Airfield for thousands <strong>of</strong> years before arrival <strong>of</strong> European<br />
settlers. Spanish explorers built Mission Santa Clara nearby in 1777, and established El<br />
Camino Real to link together the 21 California missions. With the Mexican Revolution<br />
<strong>of</strong> 1821, a portion <strong>of</strong> the land that is now Sunnyvale was given to Estrada and Inez<br />
Castro as part <strong>of</strong> a Mexican land grant. They formed Rancho Pastoria de las Borregas<br />
(Pasture <strong>of</strong> the Sheep Ranch). Missouri settler Martin Murphy Jr. purchased much <strong>of</strong><br />
the Rancho in 1850 and established a wheat farm, which was soon replaced by fruit<br />
orchards.<br />
Early settlers were drawn by a mild climate, abundant sunshine and the fertile soil.<br />
Calabazas Creek and Stevens Creek ran through the area. There was also great scenic<br />
beauty in the San Francisco Bay to the north and the Diablo and Santa Cruz Mountain<br />
ranges which rimmed the valley. These natural attributes are still an important part <strong>of</strong><br />
Sunnyvale’s living environment and identity.<br />
The development <strong>of</strong> Sunnyvale began in earnest in 1864, when the Central Railroad built<br />
a line from San Francisco to San Jose. Murphy donated right-<strong>of</strong>-way for the railroad<br />
through his property in exchange for a railroad stop at Murphy Station. The original<br />
vision for Sunnyvale laid the foundation for its future growth. Early Sunnyvale residents<br />
wanted their community to be a complete city where people could live, work and play.<br />
This is a much different place than a resort or bedroom community. The concept <strong>of</strong> a<br />
complete city is still at the foundation <strong>of</strong> what Sunnyvale is and strives to be.<br />
Industry first came to Sunnyvale after the 1906 earthquake. The first industries included<br />
the Hendy Ironworks and the Libby cannery, located at the center <strong>of</strong> town, close to the<br />
railroad. Housing was also located downtown and was laid out in a traditional grid<br />
pattern, most efficient for the flat terrain <strong>of</strong> Sunnyvale. Simple, small bungalows and<br />
revival style homes were predominant. The downtown grew as a mix <strong>of</strong> uses in close<br />
proximity and walking distance <strong>of</strong> each other. When Sunnyvale was incorporated in<br />
1912, it had just 1,800 residents.<br />
Transportation routes also played a significant role in the <strong>City</strong>’s development. The<br />
earliest transportation facilities were the railroad and El Camino Real. The paving <strong>of</strong><br />
El Camino Real in 1913 heralded the arrival <strong>of</strong> the automobile and a pr<strong>of</strong>ound change<br />
in the pattern <strong>of</strong> development. The automobile allowed businesses and homes to spread<br />
out, rather than concentrate in the downtown or along transportation routes.<br />
By the end <strong>of</strong> World War II, Sunnyvale had made the change from an agricultural<br />
community to an industrial center, with its economy focused on the booming defense<br />
and aerospace industries. Naval Air Station Sunnyvale was built (now M<strong>of</strong>fett Federal<br />
Airfield) and Lockheed Martin became the <strong>City</strong>’s largest employer. By 1950, farms and<br />
fields were increasingly replaced with homes, factories and <strong>of</strong>fices as the population<br />
grew to 10,000.<br />
2–3
<strong>City</strong> <strong>of</strong> Sunnyvale GeneRal plan – July <strong>2011</strong><br />
2–4<br />
This change set the stage for the boom decades <strong>of</strong> the 1950s and 1960s. Nearly 65 percent<br />
<strong>of</strong> the <strong>City</strong>’s existing housing and 50 percent <strong>of</strong> the non-residential buildings were<br />
constructed between 1950 and 1969. By 1970, Sunnyvale had a population <strong>of</strong> 96,000.<br />
New development covered large areas <strong>of</strong> Sunnyvale and resulted in dramatic changes to<br />
the character and form <strong>of</strong> the <strong>City</strong>. Unlike the mix <strong>of</strong> uses at the core, new districts were<br />
developed in large tracts <strong>of</strong> land exclusively for residential, commercial or industrial<br />
uses. Neighborhood schools, shopping centers and parks were located in close proximity<br />
to housing. Automobiles were recognized as the primary travel mode and street widths<br />
and orientation were designed accordingly. Between 1950 and 1970, Sunnyvale saw itself<br />
as principally a community <strong>of</strong> single-family detached homes, with a goal to provide a<br />
job for every resident. Nevertheless, it was not long before most <strong>of</strong> the land available<br />
to housing was developed. As jobs continued to grow in the city, employees were<br />
increasingly forced to find housing outside its boundaries. Pressures for apartmentstyle<br />
living to provide housing for an increasingly diverse employment sector gradually<br />
changed the focus from a suburb <strong>of</strong> single-family homes to a community with a full<br />
range <strong>of</strong> housing choices.<br />
The last 30 years <strong>of</strong> the Twentieth Century saw Sunnyvale’s economy experience yet<br />
another large shift, as high technology companies launched the Silicon Valley era.<br />
The federal downsizing <strong>of</strong> defense development and manufacturing resulted in a loss<br />
<strong>of</strong> defense and aerospace jobs, which were quickly replaced with jobs designing and<br />
manufacturing circuits and computers. These, in turn, gave way to more high-value and<br />
knowledge-based jobs in computer programming, administration, and sophisticated<br />
research and design functions. The Mid-Peninsula and South Bay areas became known<br />
as Silicon Valley, the world center for high technology innovation. Located in the very<br />
heart <strong>of</strong> this area, Sunnyvale identified itself as the “Heart <strong>of</strong> the Silicon Valley. SM ” The<br />
<strong>City</strong> attracted successful companies such as AMD, Network Appliance, Juniper Networks<br />
and Yahoo! The population grew by 14 percent in the 1990s, rising to 131,800 by 2000.<br />
The high-tech slow-down in the early years <strong>of</strong> the new century brought rapid growth to<br />
a halt, with jobs declining rather dramatically between 2000 and 2005. But the economy<br />
has since rebounded, adapting to and developing new industries, jobs and sources <strong>of</strong><br />
revenue.<br />
Figure 2-1 traces Sunnyvale’s population growth from its incorporation as a city in 1912<br />
to the 2006 population <strong>of</strong> 133,544. The history <strong>of</strong> Sunnyvale has been one <strong>of</strong> nearly<br />
constant change and growth. The progressive, innovative spirit that characterized so<br />
much <strong>of</strong> the <strong>City</strong>’s history is still very much a part <strong>of</strong> Sunnyvale today.
figure 2-1: Population from 1912 – 2006<br />
160,000<br />
140,000<br />
120,000<br />
100,000<br />
80,000<br />
60,000<br />
40,000<br />
20,000<br />
0<br />
1912 1940 1950 1960 1970 1980 1990 2000 2006<br />
Source: U.S. Census and California State Department <strong>of</strong> Finance<br />
CoMMunity ConditionS<br />
community vision — community conditions Chapter 2<br />
Community conditions include information on demographics, the economy and the<br />
physical environment. These indicators describe the state <strong>of</strong> the <strong>City</strong> at a given point in<br />
time. Establishing and tracking this data over a period <strong>of</strong> time provides both a snapshot<br />
<strong>of</strong> current community conditions and an indication <strong>of</strong> change. This data generally<br />
measures factors which are outside <strong>of</strong> the control <strong>of</strong> the <strong>City</strong>, even though the actions <strong>of</strong><br />
the <strong>City</strong> may have some influence on them. In response to changes in Sunnyvale, the<br />
<strong>City</strong> must be prepared to adjust its policies and programs to most effectively achieve its<br />
Community Vision and long-range goals.<br />
In 2006, the <strong>City</strong> compiled a comprehensive report <strong>of</strong> community conditions as part<br />
<strong>of</strong> the Community Vision. That report is reproduced below with the numbers from<br />
the original Vision. Since 2006, key indicators described in the report have been<br />
updated. These Community Condition Indicators may be found on the <strong>City</strong>’s website at<br />
GeneralPlan.inSunnyvale.com with current and historical values, where available.<br />
See GeneralPlan.inSunnyvale.<br />
com for recent Community<br />
Condition indicators,<br />
including population.<br />
2–5
<strong>City</strong> <strong>of</strong> Sunnyvale GeneRal plan – July <strong>2011</strong><br />
2–6<br />
Demographics: Who We Are<br />
Population<br />
Sunnyvale is now the second-largest city in Santa Clara County and the fifth-largest<br />
in the Bay Area. In 2000, the population <strong>of</strong> Sunnyvale, at 131,760, was much smaller<br />
than San Jose (894,943), but bigger than the neighboring cities <strong>of</strong> Santa Clara (102,361),<br />
Mountain View (70,708) or Cupertino (50,546) (U.S. Census Bureau, 2000 Census).<br />
The latest Census data show a 2005 population <strong>of</strong> 132,725 for Sunnyvale, made up <strong>of</strong><br />
22.6 percent children up to age 18, 61.0 percent adults aged 19-64, and 16.4 percent older<br />
adults aged 65 and over (California State Department <strong>of</strong> Finance, 2006 Estimates).<br />
Sunnyvale, like many <strong>of</strong> its Silicon Valley neighbors, experienced significant population<br />
growth during the 1990s. In the 10 years between 1990 and 2000, the <strong>City</strong> welcomed<br />
14,600 new people, an increase <strong>of</strong> 12.5 percent (California State Department <strong>of</strong> Finance,<br />
<strong>City</strong>/County Population and Housing Estimates, 1991-2000). By comparison, Santa Clara<br />
County grew 12.0 percent during the same decade, and the Bay Area as a whole grew 12.6<br />
percent. Between 2000 and 2006, Sunnyvale’s population grew by a modest 0.7 percent.<br />
Labor force<br />
AsdefinedbytheU.S.Census,thelaborforceincludesresidentsover16years<strong>of</strong>ageworking<br />
or seeking work. In 1990, Sunnyvale had 70,900 employed residents; in 2000 the number<br />
was 75,272, a 6 percent increase; by 2005 the number had dropped to 72,421, a nearly<br />
4 percent decrease from 2000. In 2005, more than 31 percent <strong>of</strong> residents aged 16 years<br />
or older were not in the labor force; most likely these were retirees, students, or stay-athome<br />
parents.<br />
Figure 2-2 shows the labor force distribution for employed Sunnyvale residents (who may<br />
work in Sunnyvale or in nearby cities). Most employed residents, more than 56 percent,<br />
work in high-value management and pr<strong>of</strong>essional jobs (U.S. Census Bureau, 2000 Census).<br />
figure 2-2: Labor force Distribution<br />
Source: US Census Bureau, 2005 Census<br />
Management, Pr<strong>of</strong>essional, and Related<br />
Occupations 56.4%<br />
Sales and Office Occupations 19.2%<br />
Service Occupations 13.5%<br />
Production and Transportation Occupations 6.4%<br />
Construction/Maintenance Occupations 4.0%<br />
Other 0.5%
As <strong>of</strong> January 2007, the unemployment rate for Sunnyvale residents was 3.9 percent,<br />
lower than rates in both Santa Clara County (4.6 percent) and California (5.3<br />
percent) (California Employment Development Department). Figure 2-3 shows the<br />
unemployment rate for Sunnyvale residents, from 2000 to 2007, in the context <strong>of</strong> nearby<br />
counties and the State.<br />
figure 2-3: Unemployment Rate By Year<br />
<strong>City</strong>/County 2000 2001 2002 2003 2004 2005 2006 2007 1<br />
California 5.0% 5.4% 6.7% 6.8% 6.2% 5.4% 4.9% 5.3%<br />
Alameda County 3.6% 4.8% 6.8% 7.0% 6.0% 5.2% 4.4% 4.6%<br />
Contra Costa County 3.6% 4.0% 5.7% 6.1% 5.4% 4.8% 4.3% 4.5%<br />
San Francisco 3.4% 5.1% 7.0% 6.9% 5.9% 5.1% 4.2% 4.4%<br />
Santa Clara County 3.1% 5.1% 8.5% 8.5% 6.6% 5.5% 4.8% 4.6%<br />
San Mateo County 2.9% 3.8% 5.7% 5.9% 5.0% 4.3% 3.7% 3.8%<br />
Sunnyvale 2.6% 4.3% 7.2% 7.2% 5.6% 4.6% 4.1% 3.9%<br />
1 As <strong>of</strong> January 2007 - the latest month for which the data was available<br />
Source: California Employment Development Department<br />
Income<br />
community vision — community conditions Chapter 2<br />
The median household income in Sunnyvale in 2005 was $74,449, very similar to the<br />
Santa Clara County median income, and well above the median household income <strong>of</strong><br />
both the U.S. ($41,994) and the state ($47,493) (U.S. Census Bureau, 2000 Census).<br />
Sunnyvale has a smaller percentage <strong>of</strong> people living below the poverty level (7.9 percent)<br />
compared to the County (8.3 percent), and well below the nation as a whole (13.3<br />
percent) (U.S. Census Bureau, 2000 Census). Higher incomes are combined with a<br />
higher cost <strong>of</strong> living in the Bay Area than in other regions <strong>of</strong> the state and the nation;<br />
Sunnyvale households spend over one-third <strong>of</strong> their incomes on housing (U.S. Census<br />
Bureau, 2000 Census). Despite a relatively low level <strong>of</strong> poverty in the community as a<br />
whole, 41 percent <strong>of</strong> students in the Sunnyvale School District qualify for free lunches<br />
(Sunnyvale School District). Figure 2-4 shows median family income for Sunnyvale<br />
and neighboring cities.<br />
unemployment rates for<br />
Sunnyvale residents were<br />
far lower than the State and<br />
the County, even during the<br />
worst years <strong>of</strong> the economic<br />
slowdown. See GeneralPlan.<br />
inSunnyvale.com for recent<br />
Community Condition<br />
indicators, including updated<br />
unemployment figures.<br />
2–7
<strong>City</strong> <strong>of</strong> Sunnyvale GeneRal plan – July <strong>2011</strong><br />
See GeneralPlan.inSunnyvale.<br />
com for recent Community<br />
Condition indicators, including<br />
income figures.<br />
2–8<br />
figure 2-4: Median household Income for Sunnyvale and Surrounding Cities<br />
140,000<br />
120,000<br />
100,000<br />
80,000<br />
60,000<br />
40,000<br />
20,000<br />
0<br />
Cupertino Los Altos Mountain View San Jose Santa Clara Sunnyvale<br />
Source: US Census Bureau, 2005 Census<br />
Education<br />
The overall education level <strong>of</strong> Sunnyvale residents is high and has been steadily increasing.<br />
In 2005, the <strong>City</strong>’s education levels <strong>of</strong> residents aged 25 years and older were similar to<br />
Santa Clara County; however, Sunnyvale had a slightly higher percentage <strong>of</strong> residents<br />
with a bachelor’s degree (54 percent compared with 45 percent) or graduate degree<br />
(24 percent compared with 19 percent). Compared to the state, Sunnyvale had more<br />
than twice as many people with graduate degrees (11 percent compared to 24 percent).<br />
Sunnyvale residents are also more highly educated than those in the United States as a<br />
whole—twice as many have college degrees (54 percent for Sunnyvale compared with<br />
27 percent for the United States) (U.S. Census Bureau, 2005 Census).<br />
Between 1990 and 2005, the number <strong>of</strong> Sunnyvale residents, aged 25 years and older,<br />
with a bachelor’s degree or higher increased from 38 percent to 54 percent. Some <strong>of</strong> this<br />
was due to educated immigrants recruited to fill high-tech jobs. The percentage <strong>of</strong> high<br />
school students who graduate also increased. Nonetheless, in 2005, almost 10 percent<br />
<strong>of</strong> Sunnyvale residents 25 and older had less than a high school degree (U.S. Census<br />
Bureau, 1990 and 2005 Census).<br />
Age<br />
Like many communities in California and the U.S., the average age <strong>of</strong> Sunnyvale’s<br />
population is increasing. The median age in the <strong>City</strong> in 1990 was 32.3, and by 2005 it was<br />
36.6 (U.S. Census Bureau, 1990 and 2000 Census). The median age in Santa Clara County<br />
in 2005 was 36.2 (U.S. Census Bureau, 1990 and 2000 Census). The elderly population grew<br />
by 3,200 between 1990 and 2005. In 2005, 11.6 percent <strong>of</strong> Sunnyvale’s total population was<br />
comprised <strong>of</strong> seniors age 65 and older, less than the U.S. average <strong>of</strong> 12.1 percent.
Between 2000 and 2005, the proportion <strong>of</strong> pre-school and school-age children in<br />
Sunnyvale slightly increased. That five year period brought an additional 3,472 schoolage<br />
children to the city (U.S. Census Bureau, 1990 and 2000 Census). Figure 2-5 shows<br />
the changes in the ages <strong>of</strong> Sunnyvale’s population between 2000 and 2005 (comparisons<br />
with 1990 are not able to be made due to changes in the age categories recorded by the<br />
U.S. Census).<br />
figure 2-5: Age Characteristics<br />
2000 2005<br />
Age Group Number % <strong>of</strong> Total Number % <strong>of</strong> Total<br />
Preschool (0 – 4 years) 9,270 7.0% 10,634 8.0%<br />
School Age (5 – 19 years) 17,627 13.4% 21,099 15.9%<br />
College Age (20 – 24 years) 10,195 7.7% 6,417 4.8%<br />
Young Adults (25 – 44 years) 54,438 41.3% 47,979 36.2%<br />
Middle Age (45 – 64 years) 26,273 20.0% 31,118 23.5%<br />
Senior Adults (65+ years) 13,957 10.6% 15,478 11.6%<br />
Total 131,760 100.0% 132,725 100.0%<br />
Sources: US Census Bureau, 2000 and 2005 Census<br />
Ethnicity<br />
community vision — community conditions Chapter 2<br />
Sunnyvale’s trend toward diversity reflects the diversity <strong>of</strong> the Bay Area. In 2005, <strong>of</strong> the<br />
residents reporting only one race, 45.9 percent were white (down from 71.6 percent in<br />
1990), 40.1 percent Asian, and 3.8 percent African-American. A total <strong>of</strong> 16.6 percent<br />
were Hispanic or Latino (which includes residents reporting one race or more than one<br />
race). Today, Sunnyvale—unlike Santa Clara County, the Bay Area and California—<br />
has no single racial or ethnic majority (U.S. Census Bureau, American Community<br />
Survey, 2005). Figure 2-6 shows the ethnicity <strong>of</strong> Sunnyvale’s population (As individuals<br />
are allowed to report more than one race, the population ethnicity percentages do not<br />
add up to 100 percent).<br />
Sunnyvale’s fastest growing ethnic populations have been Asian, a trend throughout<br />
the Bay Area (The Innovation Economy, Protecting the Talent Advantage, based on the<br />
U.S. Census Bureau data, ABAG report, February 2006). Between 1990 and 2005, the<br />
percentage <strong>of</strong> Asians in Sunnyvale increased from 19.3 percent to 40.1 percent. In fact,<br />
a significant difference between Sunnyvale and Santa Clara County is this city’s large<br />
community <strong>of</strong> Asian residents. A large part <strong>of</strong> Sunnyvale’s Asian population is from<br />
India. Another shift was in the Hispanic population, which grew from 13.2 percent in<br />
1990 to 16.6 percent in 2005.<br />
See GeneralPlan.inSunnyvale.<br />
com for recent Community<br />
Condition indicators,<br />
including age characteristics.<br />
2–9
<strong>City</strong> <strong>of</strong> Sunnyvale GeneRal plan – July <strong>2011</strong><br />
like California, Sunnyvale<br />
does not have a single<br />
majority racial or ethnic<br />
group.<br />
2–10<br />
figure 2-6: Ethnicity<br />
Source: US Census Bureau, 2005 Census<br />
White 46%<br />
Asian/Pacific Islander 40%<br />
Other Races 10%<br />
African American 4%<br />
Hispanic or Latino (<strong>of</strong> any race) 17%<br />
According to the 2005 U.S. Census, 43.7 percent <strong>of</strong> Sunnyvale’s residents are foreignborn.<br />
Sunnyvale had a higher percentage <strong>of</strong> foreign-born residents than Santa Clara or<br />
San Mateo Counties and nearly four times more than the U.S. average <strong>of</strong> 12.4 percent.<br />
In 2005, <strong>of</strong> the 57,951 foreign-born residents, 20,316 were naturalized U.S. citizens.<br />
Approximately 50 percent <strong>of</strong> Sunnyvale’s households speak a language other than<br />
English as the primary language at home (U.S. Census Bureau, 2000 Census).<br />
Community<br />
The data and information presented in the preceding paragraphs emphasize the<br />
tremendous diversity <strong>of</strong> the city’s population, and the trend toward increased diversity in<br />
the future. “Who we are” is continuously changing. This affects the sense <strong>of</strong> community,<br />
and community identity.<br />
The forces <strong>of</strong> change are undermining the strength <strong>of</strong> local, geographically-based<br />
communities everywhere. Internet-based communities, on the other hand, are gaining<br />
strength, bolstered by ease <strong>of</strong> worldwide communications. Nonetheless, Sunnyvale<br />
residents generally feel connected to their community. In 2005, 94 percent <strong>of</strong> residents<br />
rated Sunnyvale as a good place to live. Four out <strong>of</strong> five residents stated that they were<br />
proud to call Sunnyvale their home. Only 58 percent however, believed Sunnyvale has a<br />
strong sense <strong>of</strong> community (<strong>City</strong> <strong>of</strong> Sunnyvale 2005 Resident Satisfaction Survey).<br />
Economy: What Drives The <strong>City</strong>?<br />
Sunnyvale’s economy has a long history <strong>of</strong> reinventing itself to be at the forefront <strong>of</strong><br />
economic change. Jobs in Sunnyvale have shifted from agriculture, to manufacturing, to<br />
aerospace and defense, to computer chips, to high-tech and to the Internet, adapting as<br />
the economy and its industries changed. The dramatic transformations since 2000 have<br />
proven once again that Sunnyvale can rapidly evolve by creating new businesses and new
jobs. The <strong>City</strong> survived the “dot-com bust” and emerged with major concentrations <strong>of</strong><br />
jobs in high-tech industries (biomedical, semiconductor, computer and communications<br />
hardware, electronics, s<strong>of</strong>tware, and industries employing nanotechnology) and<br />
innovative services like design, engineering, marketing and consulting.<br />
Jobs in Sunnyvale<br />
Silicon Valley experienced a sustained and significant decline in manufacturing jobs<br />
between 1980 and 2000, which was more than <strong>of</strong>fset by strong growth in management,<br />
pr<strong>of</strong>essional and service jobs. Sunnyvale experienced a 7 percent net growth <strong>of</strong> jobs<br />
during this period despite a loss <strong>of</strong> 23,000 manufacturing and wholesale jobs (Sunnyvale<br />
Workspace Demand and Capacity Analysis, p. 3). It is estimated the number <strong>of</strong> jobs<br />
in the <strong>City</strong> peaked in 1999-2000 at about 89,900 (<strong>City</strong> <strong>of</strong> Sunnyvale, Employment<br />
Development Department). In a broad sense, this means Sunnyvale’s economy shifted<br />
from blue-collar jobs to white-collar jobs during the past 20 years.<br />
The rapid increase in jobs in Silicon Valley came to an abrupt halt in 2001 with the<br />
economic downturn. Severe job losses were suffered throughout Silicon Valley, including<br />
Sunnyvale. It is estimated that by 2005 the number <strong>of</strong> jobs in the <strong>City</strong> had dropped to<br />
84,800. Sunnyvale experienced moderate job growth to 86,300 in 2006 as the economy<br />
gradually recovered (<strong>City</strong> <strong>of</strong> Sunnyvale, Employment Development Department).<br />
Sunnyvale in 2000 was job-rich, with 1.2 jobs for every employed person who lived<br />
in Sunnyvale. This compared to the following jobs per-employed-resident <strong>of</strong> the<br />
neighboring cities: 1.6 in Mountain View, 2.2 in Santa Clara, and 1.5 in Cupertino<br />
(ABAG Projections, 2007). This meant that all four cities needed to import a significant<br />
number <strong>of</strong> their workers from other cities.<br />
It is interesting to note, as shown in Figure 2-7, that in 2000 only 23 percent <strong>of</strong> Sunnyvale’s<br />
more than 75,000 employed residents worked in Sunnyvale. A full 19 percent traveled<br />
to San Jose for employment, 13 percent to Santa Clara, 9 percent to Mountain View and<br />
7 percent to Palo Alto (U.S. Census Bureau, 2000 Census).<br />
figure 2-7: Cities <strong>of</strong> Employment<br />
Source: US Census Bureau, 2000 Census<br />
community vision — community conditions Chapter 2<br />
Everywhere Else 14.73%<br />
Sunnyvale 23.01%<br />
Fremont 1.97%<br />
Menlo Park 2.05%<br />
Redwood <strong>City</strong> 2.24%<br />
Milpitas 2.59%<br />
Cupertino 5.01%<br />
Palo Alto 7.11%<br />
Mountain View 8.64%<br />
Santa Clara 13.47%<br />
San Jose 19.18%<br />
fortune 1,000 Companies<br />
headquartered in Sunnyvale<br />
in 2006<br />
n advanced Micro devices<br />
n Juniper networks<br />
n Maxim integrated<br />
products<br />
n network appliance, inc.<br />
n Spansion<br />
n yahoo!, inc.<br />
2–11
<strong>City</strong> <strong>of</strong> Sunnyvale GeneRal plan – July <strong>2011</strong><br />
other Major employers<br />
in 2006<br />
n advanced technical<br />
resources (headquarters)<br />
n affymetrix, inc.<br />
n applied Signal<br />
technologies<br />
(headquarters)<br />
n ariba, inc. (headquarters)<br />
n Blue Coat Systems, inc.<br />
(headquarters)<br />
n Camino Medical Group<br />
n ex electric<br />
n finisar Corporation<br />
n fujitsu Computer Systems<br />
(headquarters)<br />
n harmonic, inc.<br />
n interwoven, inc.<br />
(headquarters)<br />
n lockheed Martin Space<br />
Systems and lockheed<br />
Martin technical<br />
operations<br />
n palm, inc. (headquarters)<br />
n Silicon Storage technology<br />
(headquarters)<br />
n Synopsys, inc.<br />
n West valley engineering inc.<br />
2–12<br />
The subregional nature <strong>of</strong> the job market is further demonstrated when viewed in the<br />
other direction. Of the nearly 90,000 jobs in Sunnyvale in 2000, only 18 percent were held<br />
by Sunnyvale residents. San Jose residents held 31 percent <strong>of</strong> jobs located in Sunnyvale, and<br />
residents <strong>of</strong> other cities (primarily Santa Clara, Mountain View, Fremont, Cupertino and<br />
Milpitas) held the remaining 51 percent <strong>of</strong> the jobs (U.S. Census Bureau, 2000 Census).<br />
These figures demonstrate that while it is desirable at a subregional level to have<br />
sufficient housing to house all <strong>of</strong> the persons employed in the subregion, the same does<br />
not necessarily apply to each individual city in the subregion. Those in the workforce<br />
consistently choose jobs from throughout the subregion, rather than show a preference<br />
for the city <strong>of</strong> their residence.<br />
Office and Industrial Sector<br />
Sunnyvale’s major industry clusters are s<strong>of</strong>tware, hardware, innovation services,<br />
biomedical and electronic components. About 8,500 companies in Sunnyvale generate<br />
approximately $2.45 billion in gross sales (<strong>City</strong> <strong>of</strong> Sunnyvale, Department <strong>of</strong> Finance).<br />
Six Fortune 1,000 companies have headquarters in Sunnyvale. Four businesses employ<br />
more than 1,000 people each and the 20 largest private employers employ a total <strong>of</strong><br />
30,000 people (<strong>City</strong> <strong>of</strong> Sunnyvale, Business License Database).<br />
Sunnyvale has five major geographical areas <strong>of</strong> workforce concentrations: M<strong>of</strong>fett<br />
Park, The Woods, Fair Oaks, Peery Park, and Oakmead. Figure 2-8 shows the major<br />
employment areas in the <strong>City</strong>, together with the general quality <strong>of</strong> the buildings in those<br />
areas, rated as Class A, Class B or Class C.<br />
The key employment areas in Sunnyvale were generally developed earlier in time than<br />
similar areas in adjacent cities. Sunnyvale has, therefore, a relatively fewer number <strong>of</strong><br />
modern structures for <strong>of</strong>fice or research and development use.<br />
On a floor area basis, only 17 percent <strong>of</strong> such structures are rated as Class A, which is new<br />
or high-end and suitable for large corporate headquarters. 34 percent are rated Class B,<br />
which are less modern and less spacious, and do not provide the signature architecture<br />
sought by corporate headquarters. Class C space amounts to 49 percent <strong>of</strong> existing floor<br />
area, which is in the oldest, most affordable buildings, suitable for start-up companies<br />
and service businesses (<strong>City</strong> <strong>of</strong> Sunnyvale, Community Development Department).<br />
By comparison, the adjacent cities <strong>of</strong> Santa Clara, Milpitas and Mountain View have<br />
many more properties <strong>of</strong> newer Class A space in their stock. Office projects which have<br />
been approved by the <strong>City</strong> and are now under construction (primarily development <strong>of</strong><br />
the M<strong>of</strong>fett Towers <strong>of</strong>fice complex and the expansion <strong>of</strong> Network Appliance in M<strong>of</strong>fett<br />
Park) will add 2.6 million square feet <strong>of</strong> new <strong>of</strong>fice space, boosting Sunnyvale’s share <strong>of</strong><br />
Class A space to 22 percent.<br />
In mid-2006, Sunnyvale had 9.7 percent vacant <strong>of</strong>fice workspace and 16.6 percent vacant<br />
research and development space. For industrial and warehouse space, vacancy rates<br />
were less than 10 percent. Rents are stabilizing. The average <strong>of</strong>fice rental rate is $2.37<br />
per square foot. The average R&D rental rate is $0.92 per square foot. For comparison,<br />
the average <strong>of</strong>fice rental rate in Silicon Valley is $2.27 and the average R&D rental rate is<br />
$0.93 (Cornish & Carey 2006 Market Summary, Silicon Valley/South Bay).
CENTRAL<br />
Industrial Building Conditions<br />
Class A<br />
Class B<br />
Class C<br />
Vacant<br />
CA-85<br />
Warehouse<br />
BERNARDO<br />
CA-237<br />
FREMONT<br />
MARY<br />
Community Development Department, 2005<br />
REM<strong>IN</strong>GTON<br />
HOLLENBECK<br />
STELL<strong>IN</strong>G<br />
CENTRAL EXPRESSWAY<br />
community vision — community conditions Chapter 2<br />
PEERY PARK<br />
MOFFETT PARK<br />
<strong>SUNNYVALE</strong> SARATOGA<br />
<strong>SUNNYVALE</strong><br />
MATHILDA<br />
OLD SAN FRANCISCO<br />
US-280<br />
MAUDE<br />
CALIFORNIA<br />
FAIR OAKS<br />
EL CAM<strong>IN</strong>O REAL<br />
WOLFE<br />
JAVA<br />
FAIR OAKS<br />
FAIR OAKS<br />
CARIBBEAN<br />
TASMAN<br />
OAKMEAD<br />
EVELYN<br />
REED<br />
HOMESTEAD<br />
LAWRENCE EXPRESSWAY<br />
THE WOODS<br />
US-101<br />
ARQUES<br />
KIFER<br />
MONROE<br />
Highway/Expressway<br />
Major Streets<br />
Å Train Station<br />
Railroad<br />
! Light Rail Station<br />
Light Rail<br />
Creek<br />
Channel<br />
0.5<br />
Miles<br />
GREAT AMERICA<br />
BOWERS<br />
¸<br />
US-101<br />
figure 2-8:<br />
Industrial Areas and<br />
Building Conditions Map<br />
2–13
<strong>City</strong> <strong>of</strong> Sunnyvale GeneRal plan – July <strong>2011</strong><br />
2–14<br />
Retail Sector<br />
The retail sector also creates jobs (approximately 11,000 in 2006 (<strong>City</strong> <strong>of</strong> Sunnyvale,<br />
Employment Development Department)), but it does not drive the economy like the<br />
basic economic sectors <strong>of</strong> <strong>of</strong>fice and industrial. More importantly, retail provides<br />
important services to the residents and businesses <strong>of</strong> Sunnyvale, and contributes<br />
substantially to the <strong>City</strong>’s fiscal stability through generation <strong>of</strong> sales tax.<br />
Unlike the <strong>of</strong>fice and industrial sector, the retail sector in Sunnyvale is underperforming.<br />
In most retail subsectors, there are insufficient establishments within the<br />
<strong>City</strong> to meet the community’s demand for retail products and services. This means<br />
Sunnyvale residents and businesses must meet their needs by making purchases in other<br />
nearby communities, thereby exporting their retail purchase dollars and the sales tax<br />
which goes with them. This is known as “leakage.” Overall, 7.4 percent <strong>of</strong> Sunnyvale’s<br />
retail sales are leaked to other cities. As shown in Figure 2-9, some retail subsectors<br />
suffer substantial leakage: 40.8 percent for restaurants and bars, 21.2 percent for general<br />
merchandise, 9.6 percent for clothing, 28.5 percent for grocery and liquor, 33.3 percent<br />
for building supplies, and 54.5 percent for furniture (Pacific Municipal Consultants,<br />
ESRI). These areas <strong>of</strong> leakage represent opportunities for new retail development and<br />
sales in Sunnyvale.<br />
The most significant cluster <strong>of</strong> retail establishments in Sunnyvale is along El Camino<br />
Real. Here are found most <strong>of</strong> the <strong>City</strong>’s major shopping centers, grocery stores and<br />
auto dealers (in contrast to leakage, auto sales have a 4.4 percent surplus, meaning<br />
that Sunnyvale dealers sell more vehicles than purchased by Sunnyvale residents). The<br />
El Camino Real corridor currently generates approximately 25 percent <strong>of</strong> the <strong>City</strong>’s<br />
retail sales tax revenue, more than half <strong>of</strong> which is from auto sales (<strong>City</strong> <strong>of</strong> Sunnyvale,<br />
Department <strong>of</strong> Finance).
figure 2-9: Retail Sales Tax Analysis<br />
Comparison <strong>of</strong> Sunnyvale’s Per Capita Retail Sales Tax Compared to Santa Clara County<br />
-60 -40 -20 0<br />
Less than<br />
Santa Clara County<br />
–9.6%<br />
4.4%<br />
4.2%<br />
–21.2%<br />
–26.4%<br />
–28.5%<br />
–33.3%<br />
–40.8%<br />
–45.4%<br />
–54.5%<br />
55.1%<br />
27.9%<br />
17.8%<br />
Santa Clara<br />
County Average<br />
Source: Pacific Municipal Consultants, ESRI, 2006<br />
community vision — community conditions Chapter 2<br />
Motor Vehicle and Parts Dealers<br />
Miscellaneous Store Retailers<br />
Clothing and Clothing Accessories Stores<br />
General Merchandise Stores<br />
Health and Personal Care Stores<br />
Food and Beverage Stores<br />
Bldg Materials, Garden Equip, and Supply Stores<br />
Food Services and Drinking Places<br />
Non-store Retailers<br />
Gasoline Stations<br />
Furniture and Home Furnishings Stores<br />
Electronics and Appliance Stores<br />
Sporting Goods, Hobby, Book, and Music Stores<br />
20<br />
More than<br />
40 60 80 100<br />
Santa Clara County<br />
Downtown Sunnyvale is currently a disappointment from a retail sales standpoint.<br />
Despite the existence <strong>of</strong> Macy’s, Target and the many fine restaurants along Murphy<br />
Avenue, Downtown lacks many <strong>of</strong> the products and services which residents demand.<br />
Downtown has been declared a Redevelopment Area by the <strong>City</strong>, and a major effort is<br />
now underway to revitalize the area through redevelopment <strong>of</strong> the Town Center Mall<br />
and Town & Country Village sites. Completion <strong>of</strong> the Town Center Project, alone,<br />
will increase retail sales tax revenue to the <strong>City</strong> by over $2 million per year (<strong>City</strong> <strong>of</strong><br />
Sunnyvale, Department <strong>of</strong> Finance and Community Development Department).<br />
Sales tax represents approximately 26 percent <strong>of</strong> the <strong>City</strong>’s General Fund budget. This<br />
includes tax on business-to-business sales, which varies widely year to year based on the<br />
strength <strong>of</strong> the economy, and tax on consumer retail purchases, which tends to be more<br />
stable. In 2006 the total sales tax collected by the <strong>City</strong> was $23.4 million. This amounted<br />
to $175 in sales tax per capita for the <strong>City</strong> in 2005, compared to $182 for Mountain View,<br />
$283 for Palo Alto, $318 for Santa Clara, and $128 for Santa Clara County as a whole<br />
(<strong>City</strong> <strong>of</strong> Sunnyvale, Finance Department).<br />
Figure 2-10 shows the location <strong>of</strong> major shopping centers and grocery stores in and<br />
immediately adjacent to Sunnyvale. This map reveals not only the strength <strong>of</strong> El Camino<br />
Real, but also the virtual absence <strong>of</strong> shopping centers and grocery stores serving the<br />
northern part <strong>of</strong> the <strong>City</strong>.<br />
See GeneralPlan.inSunnyvale.<br />
com for recent Community<br />
Condition indicators, including<br />
sales tax revenue figures.<br />
2–15
<strong>City</strong> <strong>of</strong> Sunnyvale GeneRal plan – July <strong>2011</strong><br />
figure 2-10:<br />
Community Shopping<br />
Centers and Grocery<br />
Stores Map<br />
2–16<br />
MIDDLEFIELD<br />
GRANT<br />
CENTRAL<br />
Community Shopping Centers<br />
Building Condition<br />
CA-85<br />
Good<br />
Data Collected July 2005<br />
Moderate<br />
Needs Improvement<br />
Outside <strong>City</strong> Limits<br />
Full Service Grocery Store<br />
> 35,000 sq ft<br />
Residential Neighborhoods<br />
BERNARDO<br />
CA-237<br />
FREMONT<br />
MARY<br />
REM<strong>IN</strong>GTON<br />
HOLLENBECK<br />
STELL<strong>IN</strong>G<br />
CENTRAL EXPRESSWAY<br />
<strong>SUNNYVALE</strong> SARATOGA<br />
<strong>SUNNYVALE</strong><br />
MATHILDA<br />
OLD SAN FRANCISCO<br />
US-280<br />
MAUDE<br />
CALIFORNIA<br />
FAIR OAKS<br />
EL CAM<strong>IN</strong>O REAL<br />
WOLFE<br />
JAVA<br />
FAIR OAKS<br />
EVELYN<br />
CARIBBEAN<br />
TASMAN<br />
REED<br />
HOMESTEAD<br />
LAWRENCE EXPRESSWAY<br />
US-101<br />
ARQUES<br />
KIFER<br />
MONROE<br />
GREAT AMERICA<br />
BOWERS<br />
Highway/Expressway<br />
Major Streets<br />
Å Train Station<br />
Railroad<br />
! Light Rail Station<br />
Light Rail<br />
Creek<br />
Channel<br />
0.5<br />
Miles<br />
¸<br />
US-101
Physical Environment: how We Live<br />
The <strong>City</strong> <strong>of</strong> Sunnyvale is in the flatlands <strong>of</strong> Northwest Santa Clara Valley. Less than an<br />
hour from the Pacific Ocean, it is 40 miles south <strong>of</strong> San Francisco, on the southern tip <strong>of</strong><br />
San Francisco Bay. The <strong>City</strong> encompasses approximately 23 square miles and is almost<br />
entirely surrounded by the cities <strong>of</strong> Santa Clara, Cupertino, Los Altos and Mountain<br />
View, generally between Calabazas Creek on the east and Steven’s Creek on the west. It<br />
is between two major earthquake faults, the San Andreas Fault approximately 14 miles<br />
to the west and the Hayward fault approximately 18 miles to the east. Sunnyvale has no<br />
geographically defining borders, except for the small portion that touches the southern<br />
tip <strong>of</strong> San Francisco Bay.<br />
Sunnyvale is at the crossroads <strong>of</strong> four <strong>of</strong> the South Bay’s major freeways and expressways,<br />
with three international airports nearby. It is located at the center <strong>of</strong> the Silicon Valley,<br />
where primary resources such as the land, air basin, transportation, water supply and<br />
housing stock are interconnected with those <strong>of</strong> the entire region.<br />
Nearly all <strong>of</strong> the properties in Sunnyvale have development on them; only 0.5 percent<br />
<strong>of</strong> parcels are vacant. Figure 2-11 shows the distribution <strong>of</strong> land uses over the developed<br />
area (baylands and streets excluded) <strong>of</strong> the <strong>City</strong>. Residential areas account for the single<br />
largest land use in the city, amounting to 52 percent <strong>of</strong> the developed area. Industrial<br />
uses constitute 26 percent <strong>of</strong> the developed area (<strong>City</strong> <strong>of</strong> Sunnyvale, Community<br />
Development Department).<br />
figure 2-11: Land Uses<br />
Residential 52%<br />
Industrial/Office 26%<br />
Open Space 8%<br />
Commercial 7%<br />
Other 7%<br />
Note: Based on developable area only (excludes streets and Baylands)<br />
Source: <strong>City</strong> <strong>of</strong> Sunnyvale, Community Development Department, 2006<br />
community vision — community conditions Chapter 2<br />
residential areas account for<br />
the single largest land use<br />
in the <strong>City</strong> See GeneralPlan.<br />
inSunnyvale.com for recent<br />
Community Condition<br />
indicators, including land<br />
use breakdowns.<br />
2–17
<strong>City</strong> <strong>of</strong> Sunnyvale GeneRal plan – July <strong>2011</strong><br />
Sunnyvale has a wide range<br />
<strong>of</strong> housing options. See<br />
GeneralPlan.inSunnyvale.<br />
com for recent Community<br />
Condition indicators, including<br />
percent <strong>of</strong> housing types.<br />
2–18<br />
housing<br />
In 2006, Sunnyvale had approximately 55,000 housing units (single-family, condominiums,<br />
apartments and mobile homes), with only 2.4 percent vacancy. (<strong>City</strong> <strong>of</strong> Sunnyvale,<br />
Community Development Department). Single-family detached homes accounted<br />
for 39 percent <strong>of</strong> the housing units; single-family attached homes (townhouses and<br />
condominiums) totaled 10 percent <strong>of</strong> the housing units. Another 42 percent were multifamily<br />
(duplexes, tri-plexes, apartments), and 7 percent were mobile homes. Figure 2-12<br />
shows the types <strong>of</strong> housing units in Sunnyvale.<br />
figure 2-12: housing Types<br />
Multi-Family 42%<br />
Single Family Detached 39%<br />
Single Family Attached 10%<br />
Mobile Homes 7%<br />
Specialty Housing 2%<br />
Source: <strong>City</strong> <strong>of</strong> Sunnyvale, Community Development Department, 2006<br />
The homeownership rate in Sunnyvale changed from 51 percent in 1980, to 49 percent<br />
in 1990, to 48% in 2000. The rate <strong>of</strong> homeownership in Sunnyvale is lower than in Santa<br />
Clara County as a whole (60 percent) and in the state (57 percent). Approximately 15<br />
percent <strong>of</strong> Sunnyvale’s single-family attached and detached homes are renter-occupied<br />
(U.S. Census Bureau, 1980, 1990, and 2000 Census).<br />
Owning a home is not for everyone. Nevertheless, from a municipal standpoint,<br />
homeownership represents an investment in, and commitment to, a community. It<br />
tends to result in a somewhat greater and sustained level <strong>of</strong> property maintenance and<br />
higher participation in community affairs. The shift in the housing market in 2002 to<br />
favor construction <strong>of</strong> for-sale housing has, at least temporarily, halted the decline in<br />
homeownership, and actually increased the rate <strong>of</strong> homeownership to 49 percent in 2005.<br />
From 2000 to 2006, approximately 2,400 new housing units were constructed in<br />
Sunnyvale. Of these units, 369 were reserved for very-low, low, and moderate income<br />
households. Nearly 1,000 additional units were approved during this time but have not<br />
yet been constructed. A total <strong>of</strong> 85 percent <strong>of</strong> the new housing units approved during this<br />
time were for ownership housing (single-family attached and detached). In addition,<br />
in 2005 and 2006, there was more interest in conversion <strong>of</strong> apartment buildings to
community vision — community conditions Chapter 2<br />
condominium units. Approximately 250 apartment units have been converted or are<br />
pending for conversion to condominiums (<strong>City</strong> <strong>of</strong> Sunnyvale, Community Development<br />
Department).<br />
The high cost <strong>of</strong> housing is the most daunting housing problem in Sunnyvale, reflecting<br />
a region-wide problem in the Bay Area. Because it is a regional problem, it cannot be<br />
completely addressed at the local level.<br />
The 2006 median price <strong>of</strong> a single-family detached home in Sunnyvale was $835,000;<br />
the median price a single-family attached home was $555,000 (RE InfoLink, 2006). This<br />
is similar to neighboring cities and the Bay Area. Based on 2005 income levels and<br />
housing prices, fewer than 40 percent <strong>of</strong> Sunnyvale households could qualify to buy a<br />
median-priced home in the <strong>City</strong> (U.S. Census Bureau, 2005 Census). The median rent<br />
for a three bedroom apartment in Sunnyvale in December 2006 was $1,800 and the<br />
apartment vacancy rate was 2.4 percent (<strong>City</strong> <strong>of</strong> Sunnyvale Report to Council (RTC 07-<br />
025), January 30, 2007).<br />
Nevertheless, Sunnyvale has been a model for local governments in addressing<br />
affordability issues. Through adoption <strong>of</strong> inclusionary zoning in 1980, creation <strong>of</strong> the<br />
housing mitigation fee in 1983, and establishment <strong>of</strong> housing as a priority in the use <strong>of</strong><br />
Federal Community Development Block Grant funds, the <strong>City</strong> has created nearly 2,000<br />
housing units with prices which are affordable to low and very-low income households<br />
(through 2006) (<strong>City</strong> <strong>of</strong> Sunnyvale, Community Development Department).<br />
These 2,000 affordable housing units, representing almost 4 percent <strong>of</strong> the <strong>City</strong>’s<br />
housing stock, have rent or sale prices controlled by the government to remain below<br />
market rate, usually for 20 years. About one-third <strong>of</strong> these units are set to convert back<br />
to market-rate housing within the next five years when price controls expire. The <strong>City</strong><br />
has targeted preserving 52 percent <strong>of</strong> these “at risk” units as affordable and has aimed<br />
for at least 12 percent <strong>of</strong> all new units to be affordable (<strong>City</strong> <strong>of</strong> Sunnyvale, Community<br />
Development Strategy, 2003). Based on new guidelines established by the <strong>City</strong> Council,<br />
new affordable units will have controlled prices for up to 55 years.<br />
Although most <strong>of</strong> the <strong>City</strong>’s housing stock is now in good repair, this varies from<br />
neighborhood to neighborhood. As <strong>of</strong> 2005, nearly 90 percent <strong>of</strong> Sunnyvale’s housing<br />
stock is more than 20 years old and only 5 percent <strong>of</strong> the housing is less than 10 years<br />
old (U.S. Census Bureau, 2005 Census). Figure 2-13 shows the residential areas <strong>of</strong> the<br />
<strong>City</strong>, the distribution <strong>of</strong> single-family homes vs. multi-family housing, and the general<br />
condition <strong>of</strong> all housing based upon a 2002 field survey. Approximately 2,600 singlefamily<br />
homes in Sunnyvale, or 11 percent <strong>of</strong> all single-family homes, are in need <strong>of</strong><br />
substantial reinvestment to maintain their long-term quality and livability. Nearly<br />
4,500 multi-family housing units, or 17 percent <strong>of</strong> all multi-family units, are in need <strong>of</strong><br />
substantial reinvestment (<strong>City</strong> <strong>of</strong> Sunnyvale, Housing Conditions Survey, 2001). This is<br />
a surprisingly high number compared to single-family units, since multi-family units<br />
are generally younger in age.<br />
See GeneralPlan.inSunnyvale.<br />
com for recent Community<br />
Condition indicators,<br />
including median prices <strong>of</strong><br />
single-family detached and<br />
attached homes.<br />
2–19
<strong>City</strong> <strong>of</strong> Sunnyvale GeneRal plan – July <strong>2011</strong><br />
CENTRAL<br />
figure 2-13:<br />
Residential Areas and<br />
housing Conditions Map US-101<br />
2–20<br />
Housing Conditions<br />
Single-Family Properties<br />
Building Conditions<br />
New Construction/Remodel<br />
Average Level <strong>of</strong> Maintenance<br />
Needs Reinvestment<br />
Multi-Family Properties<br />
Building Conditions<br />
New Construction/Remodel<br />
Average Level <strong>of</strong> Maintenance<br />
Needs Reinvestment<br />
CA-85<br />
BERNARDO<br />
CA-237<br />
FREMONT<br />
MARY<br />
Community Development Department, 2005<br />
REM<strong>IN</strong>GTON<br />
HOLLENBECK<br />
STELL<strong>IN</strong>G<br />
CENTRAL EXPRESSWAY<br />
<strong>SUNNYVALE</strong> SARATOGA<br />
<strong>SUNNYVALE</strong><br />
MATHILDA<br />
OLD SAN FRANCISCO<br />
US-280<br />
MAUDE<br />
CALIFORNIA<br />
FAIR OAKS<br />
EL CAM<strong>IN</strong>O REAL<br />
WOLFE<br />
JAVA<br />
FAIR OAKS<br />
EVELYN<br />
CARIBBEAN<br />
TASMAN<br />
REED<br />
HOMESTEAD<br />
LAWRENCE EXPRESSWAY<br />
US-101<br />
ARQUES<br />
KIFER<br />
MONROE<br />
GREAT AMERICA<br />
BOWERS<br />
Highway/Expressway<br />
Major Streets<br />
Å Train Station<br />
Railroad<br />
! Light Rail Station<br />
Light Rail<br />
Creek<br />
Channel<br />
0.5<br />
Miles<br />
¸
The <strong>City</strong> actively encourages and requires property owners to maintain their properties<br />
and to preserve the safety and integrity <strong>of</strong> their structures through the Neighborhood<br />
Preservation Program. When a field survey in 2002 revealed a high level <strong>of</strong> residential<br />
property maintenance violations in the Lakewood Village area (39 percent <strong>of</strong> properties<br />
with more than one property maintenance violation, compared to 5 percent in the rest <strong>of</strong><br />
the city (<strong>City</strong> <strong>of</strong> Sunnyvale Community Development Strategy, 2003)), a Neighborhood<br />
Enhancement Program was launched to engage Lakewood homeowners in a neighborhood<br />
improvement effort. A follow-up field survey <strong>of</strong> property maintenance in 2005 revealed<br />
significant improvement in Lakewood Village (only 18 percent <strong>of</strong> properties with more<br />
than one violation). The 2005 survey did not reevaluate the condition <strong>of</strong> structures, but if<br />
it had, it is expected that improvements would have been recorded in housing conditions,<br />
as well, over those shown in Figure 2-13.<br />
Sunnyvale was one <strong>of</strong> the first cities to recognize that as industrial and research and<br />
development uses become more land intensive (i.e., multi-story buildings with less floor<br />
area per employee), land is freed up for other uses. As part <strong>of</strong> a program called “Industrial<br />
to Residential” (ITR), introduced in 1993, the <strong>City</strong> has encouraged redevelopment <strong>of</strong><br />
specific industrial areas to residential use, while permitting higher intensity industrial<br />
development in other areas more suitable over the long-term for such uses. New housing<br />
near jobs encourages employees to take jobs in the city and helps local businesses recruit<br />
new employees. As <strong>of</strong> 2007, areas designated ITR total approximately 320 acres, which<br />
can accommodate up to 7,700 housing units (<strong>of</strong> these, 1,500 units have already been<br />
constructed) (<strong>City</strong> <strong>of</strong> Sunnyvale, Community Development Department).<br />
Transportation<br />
community vision — community conditions Chapter 2<br />
The <strong>City</strong>’s transportation system is a mixture <strong>of</strong> roads, public transit, and bike and<br />
pedestrian paths. Sunnyvale has about 300 miles <strong>of</strong> roadways, including major freeways,<br />
expressways, arterial streets, and neighborhood streets (<strong>City</strong> <strong>of</strong> Sunnyvale, Department<br />
<strong>of</strong> Public Works). The city is well served by regional freeways: U.S. 101 and S.R. 237 on<br />
the north, SR 85 on the west, and I-280 on the south. The two most heavily traveled<br />
arterial streets, Mathilda/Sunnyvale-Saratoga flowing north/south and El Camino Real<br />
flowing east/west, intersect in the middle <strong>of</strong> the <strong>City</strong> and essentially divide it into four<br />
large quadrants.<br />
The amount <strong>of</strong> traffic congestion on a roadway is measured by its “level <strong>of</strong> service”, or<br />
LOS. The LOS ranges from a free flowing LOS A, to a stop-and-go LOS F. Sunnyvale<br />
has established LOS D as an acceptable level <strong>of</strong> traffic congestion on most <strong>City</strong> streets,<br />
with LOS E the standard for roadways carrying heavy regional traffic. Traffic flow in<br />
Sunnyvale today meets these acceptable levels <strong>of</strong> service at all major intersections at<br />
which LOS is regularly measured (<strong>City</strong> <strong>of</strong> Sunnyvale, Department <strong>of</strong> Public Works).<br />
Public transit serves only 4 percent <strong>of</strong> the daily commute trips in Sunnyvale. This is<br />
similar to the transit share <strong>of</strong> work trips in Santa Clara County (4 percent) and in the<br />
state as a whole (5 percent) (U.S. Census Bureau, 2000 Census). Almost all residents<br />
have transit access within walking distance <strong>of</strong> their homes. The major transit service<br />
provider is the Santa Clara Valley Transportation Authority (VTA) which provides<br />
17 bus routes, with nearly 400 bus stops. The main transit destinations in Sunnyvale<br />
2–21
<strong>City</strong> <strong>of</strong> Sunnyvale GeneRal plan – July <strong>2011</strong><br />
2–22<br />
are Downtown, M<strong>of</strong>fett Park, and El Camino Real. Buses have approximately 14,000<br />
boardings and deboardings per day in Sunnyvale. There are also 1,500 light rail<br />
boardings and deboardings every work day in Sunnyvale, along the Mountain View/<br />
Winchester line running through the extreme northern part <strong>of</strong> the <strong>City</strong>, serving M<strong>of</strong>fett<br />
Park and residential areas along Tasman Drive (Valley Transportation Authority and<br />
Peninsula Corridor/Joint Powers Board, 2006).<br />
The Peninsula Corridor Joint Powers Board operates Caltrain service north to San<br />
Francisco and south to Gilroy. There are about 70 Caltrain daily weekday commuter<br />
trains serving Sunnyvale, with stops at the Downtown Sunnyvale Station and at the<br />
Lawrence Station. VTA buses and local shuttles connect to the stations, which <strong>of</strong>fer rain<br />
shelters, bike lockers, and inexpensive parking to encourage ridership. The Sunnyvale<br />
Caltrain Station has an average <strong>of</strong> 1,342 boardings per weekday; the Lawrence Station<br />
has an average <strong>of</strong> 514 boardings per weekday (Peninsula Corridor Joint Powers Board).<br />
Sunnyvale is one <strong>of</strong> only 80 designated Bicycle Friendly Communities across the nation,<br />
as judged by The League <strong>of</strong> American Bicyclists. The <strong>City</strong>’s Bicycle and Pedestrian<br />
Advisory Committee prepared a 2006 Comprehensive Bicycle Plan which was recently<br />
adopted by the <strong>City</strong> Council. The <strong>City</strong> has worked to encourage bicycling over the past<br />
10 years. Bicyclists now safely share Sunnyvale roads with cars on 80 miles <strong>of</strong> striped<br />
bike lanes. There are also bike paths, exclusively for bicycle and pedestrian use, including<br />
the John W. Christian Greenbelt, Calabazas Creek Trail and the San Francisco Bay Trail.<br />
The <strong>City</strong> provides a free bicycle map that shows all the bicycle lanes and trails, and rates<br />
all Sunnyvale streets for suitability for beginner, intermediate, and advanced bicyclists.<br />
Pedestrian facilities include sidewalks, <strong>of</strong>f-street paths shared with bicyclists, and<br />
neighborhood and regional park path systems such as the Bay Trail. The vast majority<br />
<strong>of</strong> Sunnyvale streets have sidewalks. Sunnyvale has many wide, heavily traveled arterial<br />
streets with four to six lanes that can make pedestrian crossing difficult. Pedestrian<br />
crossings are facilitated at many controlled intersections by pedestrian crossing signal<br />
push buttons, and at some locations by countdown signals. The development pattern <strong>of</strong><br />
the <strong>City</strong> makes walking to shopping and other destinations difficult. Many residential<br />
streets were designed on cul-de-sacs rather than in the traditional grid system, which<br />
can inhibit residents from walking around their neighborhoods. Many residents live<br />
more than one-half mile from a retail area. Older shopping areas were built with parking<br />
lots in front, obstructing pedestrian access to the stores from curbside sidewalks.<br />
Public Safety<br />
The <strong>City</strong> <strong>of</strong> Sunnyvale is proud to rank among the safest cities in the nation. In 2005,<br />
Sunnyvale had the fourth-lowest crime rate for cities <strong>of</strong> its size in the State <strong>of</strong> California<br />
(Morgan Quinto Press). Although many local cities have experienced increases in crime<br />
rates, Sunnyvale has been able to maintain its high level <strong>of</strong> public safety. According to 2005<br />
Federal Bureau <strong>of</strong> Investigation data, Sunnyvale’s crime rate was approximately 25 percent<br />
lower than the crime rates <strong>of</strong> the adjacent cities <strong>of</strong> Mountain View and Santa Clara.
The <strong>City</strong> <strong>of</strong> Sunnyvale is unique in that it has a combined police and fire department.<br />
Each <strong>of</strong> the <strong>City</strong>’s 210 sworn <strong>of</strong>ficers is highly trained to perform the functions <strong>of</strong> both<br />
police <strong>of</strong>ficer and firefighter. They respond to approximately 100,000 calls for service a<br />
year. Together with the <strong>City</strong> management team, they prepare contingency plans to address<br />
possible future emergencies, ranging from an industrial explosion with toxic materials<br />
to a major earthquake. More than 90 percent <strong>of</strong> surveyed residents are satisfied with the<br />
<strong>City</strong>’s Public Safety services (<strong>City</strong> <strong>of</strong> Sunnyvale 2005 Resident Satisfaction Survey).<br />
figure 2-14: Crime Totals by Year<br />
3,500<br />
3,000<br />
2,500<br />
2,000<br />
1,500<br />
1,000<br />
1995 1996 1997 1998 1999 2000 2001 2002 2003 2004 2005 2006<br />
Source: <strong>City</strong> <strong>of</strong> Sunnyvale, Public Safety Department, 2006<br />
Schools and Education<br />
community vision — community conditions Chapter 2<br />
Under state law, responsibility for public education rests not with the <strong>City</strong> <strong>of</strong> Sunnyvale,<br />
but with the public school districts which serve Sunnyvale. The <strong>City</strong> <strong>of</strong> Sunnyvale is<br />
served by four different school districts: Sunnyvale (K-8), Santa Clara Unified (K-12),<br />
Cupertino Union (K-8), and Fremont Union (9-12). Sunnyvale contains twelve public<br />
elementary schools, four public middle schools and one public high school. Of these<br />
schools, eight have been recognized as California Distinguished Schools and two as<br />
National Blue Ribbon Schools. The total student enrollment in Sunnyvale schools for all<br />
four districts for the 2005-2006 school year was about 12,100. Sunnyvale also has nine<br />
private schools serving the community. The total 2005-2006 school year enrollment for<br />
these private schools was more than 4,000.<br />
Only the Sunnyvale School District (K-8) is entirely within the boundaries <strong>of</strong> Sunnyvale.<br />
The total number <strong>of</strong> students in the Sunnyvale School District has remained relatively<br />
stable for the past 10 years. Figure 2-15 shows historical enrollment in the Sunnyvale<br />
School District.<br />
See GeneralPlan.inSunnyvale.<br />
com for recent Community<br />
Condition indicators,<br />
including crime figures.<br />
2–23
<strong>City</strong> <strong>of</strong> Sunnyvale GeneRal plan – July <strong>2011</strong><br />
See GeneralPlan.inSunnyvale.<br />
com for recent Community<br />
Condition indicators, including<br />
school enrollment figures.<br />
2–24<br />
figure 2-15: Sunnyvale School District Enrollment by Year<br />
6200<br />
6100<br />
6000<br />
5900<br />
5800<br />
5700<br />
5600<br />
5500<br />
’93-’94 ’94-’95 ’95-’96 ’96-’97 ’97-’98 ’98-’99 ’99-’00 ’00-’01 ’01-’02 ’02-’03 ’03-’04 ’04-’05 ’05-’06 ’06-’07<br />
Source: California Department <strong>of</strong> Education, 2006<br />
In 2006, 55 percent <strong>of</strong> the students in the Sunnyvale School District speak a language other<br />
than English at home; in fact, more than 15 different languages are spoken by Sunnyvale<br />
students. Student scores are well above the national average (Sunnyvale School District).<br />
Local schools receive strong support from parents and from numerous Sunnyvale<br />
corporations.<br />
Parks/Recreation and Library Services<br />
Sunnyvale is proud <strong>of</strong> its beautiful parks and popular library. About 745 acres, more than<br />
7 percent <strong>of</strong> the <strong>City</strong>’s land, is devoted to open space facilities owned or maintained by<br />
the <strong>City</strong> for public use, including 20 neighborhood parks, athletic fields and golf courses.<br />
The <strong>City</strong> operates 25 tennis courts, two golf courses and 6 swimming pools, including<br />
the Fremont Pool constructed in cooperation with Fremont High School. The <strong>City</strong><br />
owns and operates 143 acres <strong>of</strong> playfields, and through a partnership with three school<br />
districts, improves and maintains an additional 118 acres <strong>of</strong> playfields on school property<br />
for public use. The community can now use nearly 40 baseball and soccer fields on<br />
school grounds after school hours. The <strong>City</strong> recently completed the 1.5-mile Calabazas<br />
Creek Trail, a pedestrian and bicycle trail between U.S. 101 and S.R. 237. The trail allows<br />
residents to connect to the 400-mile San Francisco Bay Trail, 3.45 miles <strong>of</strong> which are<br />
within Sunnyvale (Association <strong>of</strong> Bay Area Governments, San Francisco Bay Trail).<br />
The Sunnyvale Community Center <strong>of</strong>fers a 200-seat theater, a recreation center, and an<br />
indoor sports center. The adjacent Orchard Heritage Park includes a 10-acre working<br />
orchard, Orchard Heritage Interpretive Exhibit and the new Historical Museum<br />
(under construction), which will be operated by the Sunnyvale Historical Society.<br />
The Community Center Theater hosts two resident theater companies, producing<br />
many children’s productions and Sunnyvale’s Summer Repertory. The 23,000 square<br />
foot Senior Center, which opened in 2003, hosts many social, cultural and educational<br />
activities for seniors, and has rooms for large events.<br />
The <strong>City</strong> provides a wide variety <strong>of</strong> recreation and personal growth activities for the<br />
preschool, youth, teen, adult, and senior populations. Class subjects include art, music,
community vision — community conditions Chapter 2<br />
dance, sports, fitness and special interest. During the summer, a full array <strong>of</strong> camps and<br />
day trips are <strong>of</strong>fered for youth and teens together with an enrichment summer school<br />
program and a full roster <strong>of</strong> swim lessons and open swim opportunities. More than<br />
80 percent <strong>of</strong> Sunnyvale residents rate recreation programs and activities in the <strong>City</strong> as<br />
good or very good; nearly 90 percent rate the condition <strong>of</strong> community facilities and parks<br />
maintenance as good or very good (<strong>City</strong> <strong>of</strong> Sunnyvale 2005 Resident Satisfaction Survey).<br />
The Sunnyvale Public Library is one <strong>of</strong> the busiest in the state. Among the materials<br />
available are books, magazines, recorded books, CDs and DVDs. The Library <strong>of</strong>fers<br />
on-site access to the Internet, including wireless access. A variety <strong>of</strong> online resources,<br />
such as e-books, podcasts, interlibrary loan and collections <strong>of</strong> audio/video downloads<br />
are also available free <strong>of</strong> charge through the Library’s website. The Language Collection<br />
reflects the variety <strong>of</strong> world languages, cultures, and ethnicities found in the Sunnyvale<br />
community. The Library caters to the large pr<strong>of</strong>essional and business community as<br />
well, <strong>of</strong>fering a strong collection <strong>of</strong> business, technology, intellectual property materials<br />
and patent library reference services. Children’s materials are highly used, an indication<br />
<strong>of</strong> the community’s strong focus on families and their interest in early childhood literacy<br />
and education. The Sunnyvale Public Library supports education, literacy, and lifelong<br />
learning, all <strong>of</strong> which are heartily embraced by the community.<br />
The Library building in Civic Center has served the community for 47 years, and is<br />
in need <strong>of</strong> modernization and expansion or replacement. The current Library <strong>of</strong> the<br />
Future Study will recommend an appropriate course <strong>of</strong> action to <strong>City</strong> Council.<br />
A cool down area where children can enjoy the outdoors on a hot day is one example <strong>of</strong> the many recreational<br />
opportunities the <strong>City</strong> provides its community.<br />
2–25
<strong>City</strong> <strong>of</strong> Sunnyvale GeneRal plan – July <strong>2011</strong><br />
2–26<br />
Public Utilities<br />
The <strong>City</strong> provides high-quality water service to residents and businesses, funded through<br />
user and service fees, not taxes. The fees for water services also cover capital improvements<br />
and maintenance. The <strong>City</strong> closely monitors the quality <strong>of</strong> all water it purchases from<br />
the San Francisco Public Utilities Commission (Hetch Hetchy) and from the Santa Clara<br />
Valley Water District, and all water which it draws from nine groundwater wells, assuring<br />
that it complies with state and federal water quality requirements.<br />
The <strong>City</strong> owns and operates a Water Pollution Control Plant that treats wastewater from<br />
residences and businesses and safely discharges it into the San Francisco Bay. The Plant<br />
also manufactures recycled water for non-potable use, such as irrigation and decorative<br />
fountains. The plant has an estimated capacity <strong>of</strong> 29.5 million gallons per day, which<br />
is far in excess <strong>of</strong> current average waste water volume <strong>of</strong> approximately 15.0 million<br />
gallons per day (<strong>City</strong> <strong>of</strong> Sunnyvale, Public Works Department).<br />
Sunnyvale provides a broad range <strong>of</strong> solid waste management services to its residents<br />
and businesses by way <strong>of</strong> a municipal solid waste utility fund. No tax dollars are used<br />
to fund this utility, as revenues are primarily from refuse collection charges and sale <strong>of</strong><br />
recyclable materials. The three most costly service components are collection <strong>of</strong> solid<br />
waste and recyclables, operation <strong>of</strong> the Sunnyvale Materials Recovery and Transfer<br />
Station (SMaRT Station®) that serves Sunnyvale, Mountain View and Palo Alto,<br />
and landfill disposal <strong>of</strong> SMaRT Station residues, all <strong>of</strong> which are provided by private<br />
companies working under contract with the <strong>City</strong>.<br />
The Environment<br />
Air quality in Sunnyvale is similar to all non-coastal areas <strong>of</strong> the Bay Area. In 2006,<br />
the <strong>City</strong> had three days on which ozone pollution exceeded state standards—as did<br />
nearby cities (Bay Area Air Quality Management District). Vehicles on local roads are<br />
the largest source <strong>of</strong> pollutants, especially during peak periods <strong>of</strong> congestion.<br />
The <strong>City</strong> lies between Calabazas Creek on the east and Stevens Creek on the west.<br />
Elevations rise slightly from sea level at the Bay to 300 feet in the <strong>City</strong>’s southwest corner.<br />
During rainy periods the two streams, along with two flood control channels, help control<br />
surface run<strong>of</strong>f. The <strong>City</strong> has an extensive storm drainage system and only 4 percent <strong>of</strong> land<br />
in the <strong>City</strong> is in a designated 100-year flood plain (an area that has a 1 percent chance <strong>of</strong><br />
flooding in any given year) (Federal Emergency Management Agency — Flood Insurance<br />
Rate Map and <strong>City</strong> <strong>of</strong> Sunnyvale, Community Development Department).<br />
Baylands Park is in the northern part <strong>of</strong> the <strong>City</strong> at the edge <strong>of</strong> San Francisco Bay. This<br />
unique and irreplaceable natural resource comprises 70 acres <strong>of</strong> developed recreation<br />
areas and 105 acres <strong>of</strong> seasonal wetlands in a protected wetlands preserve (<strong>City</strong> <strong>of</strong><br />
Sunnyvale, Parks and Recreation Department). The area was once connected to the<br />
Bay through sloughs and tidal flows, but levees have since blocked <strong>of</strong>f the daily tidal<br />
flows and the wetlands now receive all their water from winter rains. The grasslands<br />
are essential habitat for burrowing owls and shorebirds. These wetlands also help<br />
replenish the area’s ground wells and absorb flood waters. Part <strong>of</strong> the San Francisco Bay<br />
Trail, which will eventually provide pedestrian and bicycle access along the entire Bay
shoreline, goes through the Baylands Park. Since only 10 percent <strong>of</strong> the San Francisco<br />
Bay’s wetlands remain, Baylands Park is an invaluable resource for Sunnyvale and for<br />
the entire Bay Area region.<br />
Efforts by the <strong>City</strong> <strong>of</strong> Sunnyvale over many years to promote sustainability are beginning<br />
to show significant signs <strong>of</strong> success. Responding to a 1989 state mandate to reduce solid<br />
waste disposal, the <strong>City</strong> expanded its recycling programs and increased the amount <strong>of</strong><br />
solid waste diverted from disposal from 18 percent <strong>of</strong> generated waste in 1990, to 56<br />
percent in 2000, exceeding the state goal <strong>of</strong> 50 percent. In 2005, a full 63 percent <strong>of</strong> solid<br />
waste generated in Sunnyvale was diverted to productive reuse. This not only reduces<br />
the need to consume virgin resources, but also significantly reduces energy and water<br />
consumption in the manufacture <strong>of</strong> new products. Excessive air and water pollution<br />
are also eliminated in the process. <strong>City</strong> staff has estimated, using the Environmental<br />
Protection Agency’s Waste Reduction Model, that greenhouse gas emissions (CO 2 ) were<br />
reduced by 56,782 tons per year due to increased recycling efforts between 1990 and<br />
2005 (<strong>City</strong> <strong>of</strong> Sunnyvale, Public Works Department).<br />
The <strong>City</strong>’s water conservation efforts have reduced potable water consumption from<br />
161 gallons per capita per day in 2000, to 139 gallons per capita per day in 2006, a<br />
13.6 percent reduction (<strong>City</strong> <strong>of</strong> Sunnyvale, Public Works Department). This was<br />
achieved by promoting use <strong>of</strong> low flow toilets and shower heads, by industries using less<br />
water for manufacturing purposes, and by increasing the availability <strong>of</strong> recycled water<br />
for landscape irrigation and decorative fountains. Recycled water is primarily available<br />
at present in the M<strong>of</strong>fett Park area, Baylands Park, and the Sunnyvale Golf Course;<br />
distribution is gradually being expanded to also serve other areas <strong>of</strong> the <strong>City</strong>.<br />
The <strong>City</strong> has also used it regulatory powers to require private developments to mitigate<br />
potential negative impacts on the natural environment. It enforces California Title 24<br />
energy conservation requirements, requires sidewalks in all new development, requires<br />
solar heating if cost-effective, prohibits wood-burning fireplaces, and requires all sites<br />
to have 20 percent permeable, landscaped area (70 percent to be water-conserving<br />
plants), with 50 percent <strong>of</strong> all parking lot areas to be shaded within 15 years. Beginning<br />
in 2009, all new developments in excess <strong>of</strong> 10,000 square feet in M<strong>of</strong>fett Park must meet<br />
the design intent <strong>of</strong> a LEED-certified building, and they will be granted a streamlined<br />
review process if they actually complete the LEED certification.<br />
aSSetS and iSSueS<br />
community vision — assests and issues Chapter 2<br />
During the month <strong>of</strong> October 2006, the people and businesses <strong>of</strong> Sunnyvale were invited<br />
to participate in an exercise to formulate a desired vision for the long-range future <strong>of</strong> the<br />
community. The <strong>City</strong> designed a multi-faceted approach to solicit input from a diverse<br />
cross-section <strong>of</strong> the community in terms <strong>of</strong> age, neighborhood, ethnicity and interest. It<br />
included an online survey, a series <strong>of</strong> neighborhood workshops and a large community<br />
visioning festival. Through these three methods, input was collected from over 350<br />
community members.<br />
2–27
<strong>City</strong> <strong>of</strong> Sunnyvale GeneRal plan – July <strong>2011</strong><br />
2–28<br />
Although the focus <strong>of</strong> the exercise was to create a 20-year vision for the desired future,<br />
the responses also identified current assets <strong>of</strong> Sunnyvale and current issues to be<br />
addressed. Following is a summary <strong>of</strong> the most frequently mentioned assets and issues<br />
as defined by the people <strong>of</strong> Sunnyvale.<br />
Assets<br />
n A mild climate conducive to an active lifestyle.<br />
n A central location in the world-renown Silicon Valley, with good highway and train<br />
access to regional activity centers.<br />
n Quality public education.<br />
n High level <strong>of</strong> public safety.<br />
n Innovative businesses providing quality jobs.<br />
n A diverse population.<br />
n Attractive, clean, comfortable living which is in balance with the natural environment.<br />
n Quality parks, playgrounds, library and community center.<br />
n A community <strong>of</strong> residents and businesses which take pride in Sunnyvale and which<br />
are willing to commit their time and energy to making it even better.<br />
n A responsive, efficient and open local government.<br />
Issues<br />
n Lack <strong>of</strong> an active and attractive Downtown which provides commercial services,<br />
community identity and pride.<br />
n Lack <strong>of</strong> sufficient affordable housing.<br />
n Limited fiscal resources to meet a growing demand for quality public services.<br />
n Overuse <strong>of</strong> energy and natural resources in the face <strong>of</strong> global environmental<br />
problems.<br />
n Limited participation <strong>of</strong> many minority and foreign-born residents in the overall life<br />
<strong>of</strong> the community.<br />
n Insufficient number and variety <strong>of</strong> retail establishments to meet the needs <strong>of</strong> the<br />
community.<br />
n Lack <strong>of</strong> access to public and private services for residents <strong>of</strong> northern neighborhoods.<br />
n Lack <strong>of</strong> sufficient high-quality arts and entertainment venues to meet the needs <strong>of</strong><br />
the community.<br />
n Limited public transportation options.
future ChallenGeS<br />
As the previous chapters demonstrate, residents and businesses find Sunnyvale to be<br />
a quality city in which to live and work. Sunnyvale <strong>of</strong>fers attractive neighborhoods,<br />
prize-winning parks and high quality <strong>City</strong> services. Residents are centrally located near<br />
world-class research centers and the country’s most innovative, cutting-edge companies.<br />
Sunnyvale was recently named the second-most inventive town in America by The<br />
Wall Street Journal (Wall Street Journal, July 22, 2006). And perhaps most importantly,<br />
Sunnyvale is fortunate to have residents, businesses and leaders who take pride in the<br />
<strong>City</strong> and want to preserve its strengths while planning for an even stronger future.<br />
The overall attractiveness <strong>of</strong> Sunnyvale as a place to live and do business is one <strong>of</strong> the<br />
forces pushing continued growth and change in the <strong>City</strong>. Attractiveness is obviously a<br />
two-sided attribute. On the positive side, it brings the <strong>City</strong> a broad mix <strong>of</strong> high-value<br />
jobs, an increased tax base to provide services, new people with new ideas from a variety<br />
<strong>of</strong> backgrounds and cultures, and an overall dynamic quality that encourages vitality<br />
and spirit. Change is better than atrophy. However, on the negative side, change that is<br />
too great and too rapid can be disruptive, causing stress and creating congestion. More<br />
people and more jobs bring more cars, greater demand for services, and more competition<br />
for limited space and resources. Too much <strong>of</strong> a good thing might be too much.<br />
History has shown that the one constant in Sunnyvale over the past century has been<br />
change. As each cycle <strong>of</strong> change occurred, Sunnyvale adapted and prospered. It is clear<br />
that there will be more changes in the years ahead. Change is inevitable. How the <strong>City</strong><br />
changes is largely dependent upon the will and the energy <strong>of</strong> its people.<br />
Projections for the future<br />
community vision — futuRe challenGes Chapter 2<br />
Projections, by their very nature, are extensions <strong>of</strong> the past and the present into the<br />
future. An objective projection does not take into account desires and aspirations, but<br />
predicts the future based upon observable trends.<br />
Visioning, on the other hand, is value-based. It describes a future that is not necessarily<br />
the most probable, but the most desirable. Rational visioning, however, takes into<br />
account the reality <strong>of</strong> current trends, so it does not drift into the realm <strong>of</strong> fantasy.<br />
Therefore, a review <strong>of</strong> current projections is a first step to inform the visioning process.<br />
Most projections for the Bay Area are produced by the Association <strong>of</strong> Bay Area Governments<br />
(ABAG), the agency charged with planning for the future <strong>of</strong> the region. Their projections<br />
are both economic and demographic, and they are developed for the region as a whole, for<br />
counties within the region and for individual cities. They are based upon, and consistent<br />
with statewide projections prepared by the California State Department <strong>of</strong> Finance.<br />
The entire Bay Area will feel the pressures <strong>of</strong> growth over the next two decades, and<br />
California will remain the country’s most populous state. ABAG creates a biennial<br />
population forecast through various demographic projection models. Each future year<br />
is forecast using the latest U.S. Census population figure as a base, with additional data<br />
drawn from the California Departments <strong>of</strong> Health Services and Finance, and regional<br />
land use and household trend data drawn from ABAG’s database. ABAG predicts 2–29
<strong>City</strong> <strong>of</strong> Sunnyvale GeneRal plan – July <strong>2011</strong><br />
2–30<br />
continued growth for the <strong>City</strong> <strong>of</strong> Sunnyvale, but at a slower rate than in the recent past.<br />
By 2025, Sunnyvale is expected to have a population <strong>of</strong> 150,600, a 13 percent increase<br />
over the population in 2005.<br />
The median age <strong>of</strong> Sunnyvale residents will increase from 35 to 40 by 2025, consistent<br />
with the national trend. In the U.S., seniors 65 and older will be almost 20 percent <strong>of</strong> the<br />
population by 2030, according to the Center for Disease Control. ABAG predicts that<br />
the Bay Area will experience this aging even more than other regions, placing a strain<br />
on social and health services.<br />
According to the U.S. Census, Sunnyvale had 89,899 jobs in 2000. Based upon data from<br />
the state Employment Development Department (EDD), the <strong>City</strong> estimates the “dot.com<br />
bust” left Sunnyvale with 84,800 jobs in 2005. This is a larger number <strong>of</strong> jobs than estimated<br />
by ABAG (73,630) but one that seems more realistic based upon the <strong>City</strong>’s business tax<br />
data and EDD figures. Because <strong>of</strong> its disagreement with ABAG’s estimate <strong>of</strong> the current<br />
number <strong>of</strong> jobs, the <strong>City</strong> is cautious about accepting ABAG’s job projections for the future.<br />
An independent analysis by the <strong>City</strong>’s Economic Development Division in cooperation<br />
with NOVA yields a 2025 job projection <strong>of</strong> 109,600 (compared to 104,190 by ABAG). This<br />
projection utilized a trend line <strong>of</strong> job growth using the actual jobs in Sunnyvale, as reported<br />
by EDD, from 1990-2005. This results in a projected average growth <strong>of</strong> 2 percent through<br />
2010 and 1 percent thereafter to 2025. The <strong>City</strong>’s current job estimate and projections<br />
(rather than the ABAG projections) are utilized throughout this report.<br />
As a key player in the world’s knowledge-based economy, Sunnyvale is in a good<br />
position to capitalize on new industries as they emerge. According to ABAG, Sunnyvale<br />
can expect to see the most economic growth in the next few years in pr<strong>of</strong>essional and<br />
business services (computer system design and scientific R&D), information services<br />
(especially Internet service providers), and education and health services. The <strong>City</strong> may<br />
also attract new convergence technology—companies that combine biotechnology,<br />
information technology and nanotechnology. In addition, the aerospace and defense<br />
sectors may improve due to recent increases in defense spending.<br />
In summary, the future challenge posed by the above projections is the ability and the<br />
willingness <strong>of</strong> Sunnyvale to accommodate more than the 20 years between 2005 and<br />
2025 an additional 18,000 residents and 24,800 jobs. This translates into a net increase <strong>of</strong><br />
approximately 7,200 housing units and 7,600,000 square feet <strong>of</strong> <strong>of</strong>fice/industrial floor area.<br />
Analysis <strong>of</strong> Projections<br />
Although the growth predicted in the foregoing projections is modest in comparison to<br />
the rapid growth experienced by Sunnyvale over many previous decades, the numbers are<br />
significant in light <strong>of</strong> the fact that there is very little vacant land in the city. The willingness<br />
<strong>of</strong> the community to accommodate this growth will be addressed in subsequent chapters.<br />
The analysis here will compare the projections to previously adopted growth policy, as<br />
expressed in the 1997 Land Use and Transportation Element <strong>of</strong> the General Plan.<br />
If all properties in the <strong>City</strong> were to develop in accordance with the adopted 1997 Land<br />
Use and Transportation Element <strong>of</strong> the General Plan, the <strong>City</strong> could accommodate a<br />
total <strong>of</strong> 65,900 housing units, about 10,900 more than currently exist. If one assumes a
future average household size equal to the 2005 actual <strong>of</strong> 2.42 persons per household,<br />
the built-out city could hold a population <strong>of</strong> 159,500. Comparing this to the ABAG 2025<br />
population projection <strong>of</strong> 150,600 reveals that the city could accommodate its projected<br />
population growth under the current General Plan.<br />
An important factor that must be kept in mind when considering likely and/or desirable<br />
population growth is that the State <strong>of</strong> California requires all cities and counties in<br />
the state to plan for their fair share <strong>of</strong> growth. The population projection for the Bay<br />
Area is prepared by the state. The state then requires the Bay Area’s regional planning<br />
body, ABAG, to allocate that population growth to each city based upon a “fair share<br />
formula” developed by ABAG. For the period from January 1999 to June 2006, the<br />
allocation to Sunnyvale required it to plan for 3,832 new housing units. Although the<br />
<strong>City</strong> appropriately zoned land to accommodate this number <strong>of</strong> new units, applications<br />
for only 2,555 units were received, and all applications were approved. ABAG is now<br />
preparing its fair share formula for allocating projected regional population growth<br />
over the next five years. Again, Sunnyvale will be required to plan for the number <strong>of</strong><br />
new housing units allocated to it.<br />
With regard to commercial and industrial space, the adopted 1997 Land Use and<br />
Transportation Element <strong>of</strong> the General Plan would accommodate a total <strong>of</strong> 49 million<br />
square feet, about 14 million square feet more than currently exists. At today’s intensity<br />
<strong>of</strong> building use, this would yield a total <strong>of</strong> about 160,000 jobs. When this figure is<br />
compared to the <strong>City</strong>’s 2025 projection <strong>of</strong> 109,570 jobs for the <strong>City</strong>, it is apparent that<br />
Sunnyvale has more than adequate capacity for projected job growth.<br />
The General Plan also provides sufficient area designated for retail uses to support<br />
the population at build-out. At present, however, Sunnyvale lacks sufficient retail<br />
development to serve its current population. This is evidenced by the fact that retail<br />
sales volume in the city is $9,364 per capita, compared to $9,976 per capita for Santa<br />
Clara County as a whole. Sunnyvale residents must travel to adjacent cities to do some<br />
<strong>of</strong> their shopping, particularly for clothing, furniture and specialty goods.<br />
Infrastructure to Support Sunnyvale <strong>of</strong> the future<br />
community vision — futuRe challenGes Chapter 2<br />
Infrastructure consists <strong>of</strong> the physical systems that support urban life. It includes streets<br />
and highways, utilities, and water and sewer systems. As the <strong>City</strong> changes and grows,<br />
increased pressure is placed on its supporting infrastructure.<br />
Sunnyvale has planned for the improvement and expansion <strong>of</strong> its infrastructure as the<br />
<strong>City</strong> grows. The Transportation Strategic Program, adopted by <strong>City</strong> Council in 2003,<br />
evaluated traffic impacts associated with the full build-out <strong>of</strong> the adopted 1997 Land<br />
Use and Transportation Element <strong>of</strong> the General Plan and identified major transportation<br />
facility improvements required to maintain a smooth flow <strong>of</strong> people and goods as the<br />
city grows. The cost <strong>of</strong> needed improvements was estimated, and traffic impact fees were<br />
established to cover the <strong>City</strong>’s share <strong>of</strong> the cost <strong>of</strong> such facilities. These impact fees are paid<br />
by all major development, so that as development occurs, the <strong>City</strong> obtains the necessary<br />
funding to provide transportation improvements to accommodate that development.<br />
2–31
<strong>City</strong> <strong>of</strong> Sunnyvale GeneRal plan – July <strong>2011</strong><br />
2–32<br />
Similarly, the <strong>City</strong> has adopted a Park Impact Fee Program, through which residential<br />
developments are required to pay fees to expand or improve park and recreation facilities<br />
needed to support additional residents. School impact fees paid primarily by residential<br />
development also exist, with a maximum fee set by state mandate. The fee level set<br />
by the state may be sufficient to pay for needed new school construction in outlying<br />
suburban and rural areas, but is inadequate to meet the high land and construction<br />
costs in more urban areas like Sunnyvale.<br />
New development also pays sewer connection fees, which are designed to provide the<br />
resources necessary to expand the capacity <strong>of</strong> the sanitary sewer system to meet the<br />
demand imposed by new development. Sunnyvale’s Water Pollution Control Plant,<br />
designed to serve high demand industries <strong>of</strong> the past, has more than sufficient capacity<br />
to meet today’s needs and the projected needs at General Plan build-out. The problem<br />
with the Plant is not capacity, but age. As the Plant reaches the end <strong>of</strong> its useful life, the<br />
<strong>City</strong> is studying whether it should be modernized and repaired, or replaced. This major<br />
reinvestment will be required even if Sunnyvale develops no further.<br />
Sunnyvale’s water supply is adequate to meet projected growth <strong>of</strong> the <strong>City</strong>. Current<br />
improvements to the San Francisco Water System (Hetch Hetchy) provide for an<br />
approximate 5 percent increase in future supply to Sunnyvale. In addition, the <strong>City</strong><br />
has the ability to double its supply from groundwater through the drilling <strong>of</strong> additional<br />
wells. These measures, together with water conservation efforts and increased use <strong>of</strong><br />
recycled water for non-potable purposes, are more than adequate to ensure sufficient<br />
water supply to meet the foreseeable needs <strong>of</strong> the future.<br />
Other future Challenges<br />
The graceful accommodation <strong>of</strong> growth is not the only challenge facing Sunnyvale over<br />
the next two decades. As articulated by the residents and business in the community<br />
visioning process, Sunnyvale has numerous issues to address if it is going to maintain<br />
and improve its quality <strong>of</strong> life. Among these are the following:<br />
n Downtown: While the 100 block <strong>of</strong> South Murphy Avenue is a sense <strong>of</strong> pride for<br />
Sunnyvale, much <strong>of</strong> the remainder <strong>of</strong> Downtown is an embarrassment. The goals <strong>of</strong><br />
the Downtown Specific Plan and the Central Core Redevelopment Project are yet to<br />
be achieved.<br />
n Affordable housing: Sunnyvale may be doing as much or more than other<br />
communities to provide affordable housing, but it is still insufficient in light <strong>of</strong> the<br />
ever-increasing cost <strong>of</strong> housing in the community.<br />
n Limited Resources to Provide Public Services: The downturn in the economy<br />
during the first five years <strong>of</strong> the new century made manifest underlying weaknesses in<br />
California’s system <strong>of</strong> local public finance. Sunnyvale’s prudent 20-year budgeting and<br />
efficient management helped to weather the storm, but the <strong>City</strong> will continue to face<br />
an imbalance between the demand for services and the resources to provide them.<br />
n Environmental Issues: The impacts <strong>of</strong> man upon the environmental systems <strong>of</strong><br />
the Earth are only now becoming recognized by the general public. These problems
affect the entire civilized world, and Sunnyvale will be faced with difficult local<br />
decisions as it tries to do its part to address them.<br />
n Aging Population: Sunnyvale reflects the national pattern <strong>of</strong> an aging population.<br />
As the retired portion <strong>of</strong> the population increases, the <strong>City</strong> will need to alter the<br />
types <strong>of</strong> services delivered and the method <strong>of</strong> their delivery.<br />
n Cultural Diversity: The diversity <strong>of</strong> the population appears likely to continue to<br />
increase over the next 20 years. The successful integration <strong>of</strong> all the ethnicities and<br />
cultures into the single community <strong>of</strong> Sunnyvale is a challenge, as is the diversity in<br />
the demand for public services which is likely to arise.<br />
n Rapid Technological Change: Advances in technology are generally viewed as<br />
positive, but the ability to adjust behaviors, habits and methodologies to effectively<br />
utilize new technologies is a challenge to the <strong>City</strong> and its people. The Internet and<br />
related advances in communication technology will dramatically alter the way in<br />
which people interact with each other and with their government.<br />
n Community Identity: Population change and advances in worldwide communication<br />
technology will make it increasingly difficult to maintain and enhance a sense <strong>of</strong><br />
community within Sunnyvale. The degree to which residents are engaged in the<br />
community and feel a part <strong>of</strong> it will affect the overall quality <strong>of</strong> life in Sunnyvale,<br />
and its ability to address unforeseen problems as they arise in the future.<br />
valueS and viSion<br />
The community visioning process in October 2006, resulted in a consensus among<br />
residents and businesses on the characteristics <strong>of</strong> today’s Sunnyvale which they cherish,<br />
and the attributes <strong>of</strong> the future Sunnyvale to which they aspire. The former represent<br />
current values; the latter represent the future vision.<br />
Values<br />
community vision — values and vision Chapter 2<br />
Certain core community values emerged from the process. These values are reflected<br />
in a very positive current self-image <strong>of</strong> the community, which can be summarized as<br />
follows:<br />
SunnYvAle iS An attractive, safe, environmentally-sensitive<br />
CoMMuniTY whiCh TAkeS PRide in The diveRSiTY oF iTS PeoPle, The<br />
innovation oF iTS buSineSSeS And The responsiveness oF iTS<br />
goveRnMenT.<br />
2–33
<strong>City</strong> <strong>of</strong> Sunnyvale GeneRal plan – July <strong>2011</strong><br />
2–34<br />
Vision<br />
A vision statement is usually thought <strong>of</strong> as a desired end state – an ideal future. A vision<br />
may not be achievable all at once, even for many years, and certainly not without the<br />
efforts <strong>of</strong> many individuals and institutions. The following vision statement reflects a<br />
high level <strong>of</strong> community discussion and agreement. This vision establishes a framework<br />
for future strategies and actions and a benchmark from which to evaluate future<br />
proposals.<br />
It is the aspiration <strong>of</strong> the people <strong>of</strong> Sunnyvale to build upon the attributes which the<br />
<strong>City</strong> currently enjoys, so that Sunnyvale <strong>of</strong> the future will become …<br />
A strong, diverse community … that is inclusive <strong>of</strong> and accessible to people <strong>of</strong> all<br />
cultures, ages, and lifestyles. Neighborhood and citywide events regularly provide<br />
residents with opportunities to connect with each other and to actively participate<br />
in city government. Sunnyvale <strong>of</strong>fers a variety <strong>of</strong> housing options for its diverse and<br />
changing population.<br />
A community with a vibrant and innovative local economy … comprised <strong>of</strong> cuttingedge<br />
businesses that provide meaningful employment and partnership opportunities.<br />
Sunnyvale continues to be the heart <strong>of</strong> innovation in Silicon Valley.<br />
A regional leader in environmental sustainability … advocating to reduce dependence<br />
on non-renewable resources by providing greater transportation options, reducing waste,<br />
protecting our natural resources, and promoting alternative energy usage and research.<br />
We take environmental preservation and protection seriously and consider how each<br />
action will affect Sunnyvale for future generations.<br />
A safe, secure and healthy place for all people … where the health and safety <strong>of</strong> residents<br />
is a primary concern. Sunnyvale is a clean and attractive city with many opportunities<br />
for physical activity in a natural environment.<br />
A city managed by a responsible and responsive government … that delivers quality<br />
services in a comprehensive, cost-effective manner. The <strong>City</strong> evolves gracefully with<br />
the changing needs <strong>of</strong> the community and regularly communicates with residents and<br />
businesses to engage them in decision-making processes.<br />
A community with a distinctive identity … enhanced by a Downtown that provides<br />
a sense <strong>of</strong> place, convenience and is pedestrian-oriented. New development is<br />
concentrated in nodes along major transportation corridors and around transit hubs.
<strong>City</strong>Wide viSion GoalS<br />
community vision — citywide vision Goals Chapter 2<br />
Long-range goals are the heart <strong>of</strong> the General Plan. Within this Community Vision, the<br />
goals are <strong>City</strong>wide in nature, and quite general. The long-range goals in each functional<br />
element <strong>of</strong> the General Plan are much more specific, focusing on the subject matter <strong>of</strong><br />
that element.<br />
General Plan goals are long-range in nature and are generally mission-based. They are<br />
comprehensive, covering the full range <strong>of</strong> physical, social and economic aspirations.<br />
General Plan goals are generally not prioritized; each one is as important as all others<br />
in charting the long-range course for the <strong>City</strong>. The comprehensive and general nature <strong>of</strong><br />
the goals give the General Plan a semblance <strong>of</strong> a constitution. Goals are the inspiration,<br />
constraints, touchstones, and context upon which unforeseen future decisions and<br />
actions may be based. Like the elements <strong>of</strong> a constitution, the goals are long-lasting, and<br />
modified only infrequently through a comprehensive and potentially lengthy process.<br />
Following are 15 <strong>City</strong>wide vision goals which are reflective <strong>of</strong> the Community Vision<br />
and which provide context and direction for the more specific long-range goals in each<br />
functional element.<br />
I. Long-Range Planning: To engage in long-range physical, fiscal and economic<br />
development planning so as to create and sustain an outstanding quality <strong>of</strong><br />
life in a community with appropriate balances between jobs and residences,<br />
development and supporting infrastructure, and the demand for services and<br />
the fiscal ability to provide them.<br />
Sunnyvale accepts the expected growth in its population and jobs over the next<br />
two decades, and plans to accommodate that growth in a manner which preserves<br />
the character <strong>of</strong> the <strong>City</strong> and its neighborhoods. By utilizing the principles <strong>of</strong><br />
smart growth, the <strong>City</strong> will direct residential development to Downtown, to<br />
mixed use development in other nodes with high transit access, and to areas<br />
designated for conversion from industrial to residential uses. Job growth will be<br />
focused in the M<strong>of</strong>fett Park and Peery Park areas, both <strong>of</strong> which have excellent<br />
freeway access. Careful land use planning, and the imposition <strong>of</strong> transportation,<br />
park, housing, school and utility impact fees on new development, will assure<br />
that proper balances are maintained between uses and the public facilities which<br />
serve them.<br />
2–35
<strong>City</strong> <strong>of</strong> Sunnyvale GeneRal plan – July <strong>2011</strong><br />
2–36<br />
II. Attractive Community: To maintain and enhance the appearance <strong>of</strong> Sunnyvale,<br />
and to distinguish it from surrounding communities, through the promotion <strong>of</strong><br />
high quality architecture, the preservation <strong>of</strong> historic districts and structures,<br />
the maintenance <strong>of</strong> a healthy urban forest, and the provision <strong>of</strong> abundant and<br />
attractive open space.<br />
The physical attractiveness <strong>of</strong> a city is a major contributing factor and manifestation<br />
<strong>of</strong> its high quality <strong>of</strong> life. The form and features <strong>of</strong> the city should create a place<br />
with which residents identify and which visitors can understand. Lacking strong<br />
natural boundaries and natural landmarks, Sunnyvale must utilize manmade<br />
gateways, landmarks and special districts to establish its identity. Since much<br />
<strong>of</strong> the experience <strong>of</strong> the <strong>City</strong> is from and along public rights-<strong>of</strong>-way, a healthy<br />
canopy <strong>of</strong> attractive street trees and well landscaped medians and parkways can<br />
create a lasting positive impression. Likewise, the insistence upon well-designed<br />
private development and a high level <strong>of</strong> maintenance <strong>of</strong> public spaces reflect the<br />
high standards <strong>of</strong> the city and its people.<br />
III. Environmental Sustainability: To promote environmental sustainability and<br />
remediation in the planning and development <strong>of</strong> the <strong>City</strong>, in the design and<br />
operation <strong>of</strong> public and private buildings, in the transportation system, in the<br />
use <strong>of</strong> potable water and in the recycling <strong>of</strong> waste.<br />
Sustainability is a practice <strong>of</strong> meeting the needs <strong>of</strong> the present without compromising<br />
the ability <strong>of</strong> future generations to meet their own needs. It requires the utilization<br />
<strong>of</strong> natural resources at rates no greater than nature can replace them. There is<br />
a growing awareness that our planet’s environment is fragile, and that every<br />
person and every community must do its part to protect the environment. Past<br />
environmental degradation must be remediated. The <strong>City</strong> will seek opportunities<br />
to utilize “green” practices in its operation and delivery <strong>of</strong> services, and encourage<br />
residents and businesses to adopt such practices. These might include reduced use<br />
<strong>of</strong> non-renewable energy, reduced emissions <strong>of</strong> greenhouse gases, greater recycling<br />
<strong>of</strong> waste and use <strong>of</strong> recycled materials, reduced per-capita use <strong>of</strong> potable water,<br />
green building design and reduced storm water run<strong>of</strong>f.<br />
IV. Safe and Healthy Community: To maintain Sunnyvale’s traditional high level<br />
<strong>of</strong> public health and safety, so all residents, employees and visitors feel safe at all<br />
times and in all places in the <strong>City</strong>.<br />
The people and businesses <strong>of</strong> Sunnyvale take great pride and comfort in the <strong>City</strong>’s<br />
high level <strong>of</strong> public health and safety. These feelings are attributable to a wellbalanced<br />
service delivery, including effective law enforcement, a quality park and<br />
recreation system, an outstanding library, clean streets, vigilant code enforcement<br />
and a community culture which does not tolerate anti-social behavior. The future<br />
challenge is not so much to improve public health and safety as it is to maintain<br />
the high level <strong>of</strong> public health and safety which is currently enjoyed.
community vision — citywide vision Goals Chapter 2<br />
V. Diverse Population: To celebrate the diversity <strong>of</strong> the population and to provide<br />
equal opportunity for all residents to participate fully in community life.<br />
Sunnyvale’s knowledge-based economy has attracted a diverse population in<br />
which individuals are judged more on their personal abilities and traits than<br />
upon their ethnicity, national origin, age or lifestyle. Despite this acceptance <strong>of</strong><br />
diversity, there are few opportunities to celebrate our differences or learn more<br />
about each other’s culture. Some groups in the community participate more fully<br />
in civic affairs than others, and wield more influence on public decision-making.<br />
Sunnyvale can create opportunities which will draw all residents to participate<br />
fully in the life <strong>of</strong> the community.<br />
VI. Affordable Housing Options: To provide a variety <strong>of</strong> housing options by style,<br />
size, density and tenure, so all segments <strong>of</strong> the population may find appropriate<br />
high-quality housing in Sunnyvale that is affordable to them.<br />
The <strong>City</strong> <strong>of</strong> Sunnyvale does not build housing, but through its land use regulations<br />
it can influence and control the type and quality <strong>of</strong> housing that is developed.<br />
Sunnyvale cannot have a major impact on the regional housing market which<br />
drives the high cost <strong>of</strong> housing, but it can take steps to provide and protect<br />
affordable housing within its boundaries. The <strong>City</strong> has historically lead the way<br />
in affordable housing and will continue to do so in the future.<br />
VII. Quality Education: To support and work cooperatively with the educational<br />
institutions which serve Sunnyvale so as to provide the opportunity for a quality<br />
education for all youth, and life-long learning for all residents.<br />
Excellent public education is an essential ingredient to a high quality <strong>of</strong> life.<br />
For many families with young children, the quality <strong>of</strong> the schools is a primary<br />
determinant <strong>of</strong> where they will chose to live. Although the <strong>City</strong> <strong>of</strong> Sunnyvale does<br />
not have jurisdictional authority over public education, it can help maintain a<br />
quality educational system by working closely with the school districts that serve<br />
the <strong>City</strong>. It can share facilities with the schools (as is now the case with school<br />
playfields), help schools build community partnerships, provide safe places for<br />
youth to gather for positive activity outside <strong>of</strong> school hours, and provide excellent<br />
public library services.<br />
2–37
<strong>City</strong> <strong>of</strong> Sunnyvale GeneRal plan – July <strong>2011</strong><br />
2–38<br />
VIII. Outstanding Recreation, Arts and Culture: To provide outstanding recreation<br />
programs, library services, and visual and performing arts to meet the interests<br />
and needs <strong>of</strong> the diverse population.<br />
A complete community provides its residents not only employment opportunities<br />
to realize income, but also leisure activities to stimulate the mind, body and<br />
spirit. Sunnyvale has long been recognized for its diverse recreational programs<br />
and popular Library. Less well represented are visual and performing arts, to be<br />
enjoyed either as a participating artist or as a spectator. Sunnyvale residents must<br />
<strong>of</strong>ten travel to other nearby communities to enjoy theater, concerts or dance. This<br />
cultural and entertainment “leakage,” like the present leakage <strong>of</strong> retail purchases,<br />
provides an opportunity for development <strong>of</strong> more visual and performing arts<br />
programs and venues within the <strong>City</strong>.<br />
IX. Dynamic Downtown: To create and support a strong and attractive traditional<br />
downtown which serves as the community’s central marketplace, common<br />
gathering place and symbolic center.<br />
The vitality and attractiveness <strong>of</strong> Sunnyvale are not reflected in its Downtown<br />
today. Vacant storefronts and a shuttered mall suggest a distressed community,<br />
lacking in positive identity. It is clear that both the desire <strong>of</strong> the public and the<br />
demand <strong>of</strong> the market are to recreate a traditional downtown <strong>of</strong> shops, restaurants,<br />
<strong>of</strong>fices and residences, as a common gathering place, central market place and<br />
symbolic center for the <strong>City</strong> <strong>of</strong> Sunnyvale.<br />
X. Robust Economy: To retain, attract and support strong and innovative<br />
businesses, which provide quality jobs for the <strong>City</strong>’s workforce, tax revenue to<br />
support public services, and a positive reputation for Sunnyvale as a center <strong>of</strong><br />
creativity and productivity.<br />
Sunnyvale sits in the very center <strong>of</strong> the Silicon Valley, world renowned for its<br />
innovative and entrepreneurial spirit. The businesses which have grown up in<br />
the community bring wealth to its residents and cutting edge products to the<br />
world market. But the competition for such businesses, among the cities <strong>of</strong> the<br />
region and among similar regions throughout the world, is intense. To maintain<br />
its position <strong>of</strong> predominance, Sunnyvale must continue to provide opportunities<br />
for strong and innovative businesses, both large and small, including start-up<br />
companies and headquarters <strong>of</strong> large successful companies, to locate in the <strong>City</strong>;<br />
and it must strengthen its reputation as a business-friendly community.
community vision — citywide vision Goals Chapter 2<br />
XI. Balanced Transportation: To provide and maintain a balanced multi-modal<br />
transportation system which provides choice, convenience and efficiency for the<br />
movement <strong>of</strong> people and goods.<br />
A modern multi-modal transportation system consists <strong>of</strong> streets and freeways,<br />
mass transit, bikeways and walkways. While in the foreseeable future the private<br />
automobile will continue to be the dominant mode <strong>of</strong> travel, a reasonable balance<br />
<strong>of</strong> the other modes is necessary to conserve energy, reduce air pollution, reduce<br />
congestion and provide convenient conveyance for those without ready access<br />
to an automobile. The system must have the physical capacity to expand as the<br />
<strong>City</strong> grows, and must have access to sufficient financial resources to support<br />
that expansion.<br />
XII. Supportive Utilities: To provide and maintain water, sewer, solid waste disposal,<br />
and drainage facilities that are safe, efficient, and reliable, and which can develop<br />
sufficient capacity to meet the expected growth <strong>of</strong> the city.<br />
The health, safety, and quality <strong>of</strong> life <strong>of</strong> a city is dependent upon the quality <strong>of</strong> its<br />
supporting infrastructure, including water distribution, sanitary sewer system,<br />
solid waste collection and disposal, and surface drainage. Much <strong>of</strong> the utility<br />
infrastructure serving Sunnyvale has been in place for many years, requiring<br />
a high level <strong>of</strong> maintenance and replacement. In addition, the <strong>City</strong> must be<br />
prepared to expand the capacity <strong>of</strong> that infrastructure in step with population<br />
and economic growth so as to maintain the overall quality <strong>of</strong> life.<br />
XIII. Community Identity: To foster a strong sense <strong>of</strong> community which promotes<br />
participation in civic affairs, community pride and a sense <strong>of</strong> place.<br />
A community’s identity influences the willingness <strong>of</strong> residents to become<br />
involved, and ultimately the ability <strong>of</strong> the <strong>City</strong> to accomplish its municipal goals.<br />
Residents must take pride in their community and have faith that they can make<br />
a difference; otherwise they will not participate and feel they have a stake in the<br />
future. <strong>City</strong>wide public events reinforce a sense <strong>of</strong> community, and physical<br />
landmarks, districts and gateways help to create a sense <strong>of</strong> place. Sunnyvale’s goal<br />
is to create a community with which all residents identify, so they are prepared to<br />
work together to plan and take actions to build a better community.<br />
2–39
<strong>City</strong> <strong>of</strong> Sunnyvale GeneRal plan – July <strong>2011</strong><br />
2–40<br />
XIV. Caring Community: To provide support for those in the community who are<br />
not able to fully support themselves, so all residents may enjoy the <strong>City</strong>’s high<br />
quality <strong>of</strong> life.<br />
Sunnyvale is fortunate that most residents are physically, mentally and financially<br />
able to support themselves. A caring community provides support for those<br />
among them who are not fully self-supporting. Although responsibility for<br />
health and welfare programs rests primarily with the county, state and federal<br />
governments, Sunnyvale can play a role to ensure that its residents have access to<br />
those services, to support local nonpr<strong>of</strong>it agencies which fill gaps in those services,<br />
to provide facilities in targeted areas <strong>of</strong> need for delivery <strong>of</strong> those services (such as<br />
the Columbia Neighborhood Center), and to promote housing which is affordable to<br />
low-income households, the elderly and those with special physical or mental needs.<br />
XV. Responsive Government: To continue to provide local governance which meets<br />
the many and diverse needs <strong>of</strong> the people and businesses, which is managed to be<br />
efficient, effective and compassionate, and which welcomes public participation<br />
in an open and accountable public decision-making process.<br />
The Council-Manager form <strong>of</strong> governance has proven to be the right structure<br />
for the <strong>City</strong> <strong>of</strong> Sunnyvale. Through this structure, and through the commitment<br />
and innovation <strong>of</strong> elected and appointed leaders over time, the <strong>City</strong> has been<br />
able to attain a reputation as being responsive, efficient and customer-serving.<br />
It is also generally considered to be an open and accessible government. Such a<br />
reputation is difficult to build, but easy to lose unless the people <strong>of</strong> Sunnyvale<br />
and their elected and appointed leaders vigilantly demand that exceptional level<br />
<strong>of</strong> local governance.<br />
Goal Cv-1<br />
CoMMunity partiCipation and enGaGeMent<br />
AChieve A CoMMuniTY in whiCh All CoMMuniTY MeMbeRS ARe well<br />
inFoRMed AbouT loCAl iSSueS, CiTY PRogRAMS And SeRviCeS ARe ACTivelY<br />
involved in ShAPing The QuAliTY oF liFe And PARTiCiPATe in loCAl<br />
CoMMuniTY And goveRnMenT ACTiviTieS. (Previously Community Engagement<br />
Goal A / Adopted in 2007)<br />
The <strong>City</strong> <strong>of</strong> Sunnyvale has a strong tradition <strong>of</strong> informing community members and<br />
supporting community participation and engagement. An informed community leads<br />
to more effective involvement in the <strong>City</strong>’s decision making, and is a cornerstone <strong>of</strong><br />
democratic government. As the <strong>City</strong> has changed over the years, so have the issues and<br />
methods used to inform and engage the in community engagement. Sunnyvale has
experienced nearly constant change, growth and innovation since it was incorporated<br />
in 1912 with a mere 1,800 residents.<br />
In <strong>2011</strong>, the <strong>City</strong> is home to 140,450 residents, the second-largest city in Santa Clara<br />
County. As Sunnyvale has grown over the years, the population has become ever-more<br />
diverse. As a community diversifies, the challenge <strong>of</strong> informing, communicating with<br />
and engaging the broad audience becomes more difficult. In the 1980s the <strong>City</strong> established<br />
a community relations function which has evolved with the Communications Office<br />
in the Office <strong>of</strong> the <strong>City</strong> Manager. <strong>City</strong> efforts include news media relations, public<br />
information, community education, coordination <strong>of</strong> major special events and projects,<br />
and program and service accessibility.<br />
The 1983 adoption <strong>of</strong> a Community Participation Sub-element in the General Plan<br />
established a long-term formal commitment to community engagement. Sunnyvale,<br />
by policy and practice, values the input <strong>of</strong> an engaged community. Numerous outreach<br />
meetings are conducted on a wide variety <strong>of</strong> topics every year. Sunnyvale’s community<br />
outreach activities are dynamic, responding to the ever-changing needs and demands<br />
<strong>of</strong> the community. Some <strong>of</strong> the <strong>City</strong>’s key efforts have included:<br />
n Created an Advisory Committee on Accessibility;<br />
n Created a Human Relations Cultural Diversity Committee;<br />
community vision — citywide vision Goals Chapter 2<br />
n Maintains 10 boards and commissions to advise <strong>City</strong> Council;<br />
n Established the “Connect” database <strong>of</strong> Sunnyvale associations and community groups;<br />
n Established an interactive, state-<strong>of</strong>-the-art resource in the <strong>City</strong> website (www.<br />
sunnyvale.ca.gov) and its community events calendar; and<br />
n Conducts both Neighborhood and Community Event grant programs.<br />
In addition to working with reporters from print, broadcast and Internet-based<br />
organizations, the <strong>City</strong> produces a variety <strong>of</strong> print and electronic newsletters to keep<br />
residents informed, including Quarterly Report, which is mailed to all residents. <strong>City</strong><br />
Council and Planning Commission meetings are broadcast live via cable television;<br />
these same meetings are also streamed on the Internet and archived, allowing easy<br />
access and transparency to the <strong>City</strong>’s policy-making process.<br />
As is appropriate to a city known for its innovative approaches to serving the community,<br />
Sunnyvale will continue to explore new technologies and systems to further community<br />
engagement efforts. Just as we created the first One-Stop Center to speed various<br />
permitting processes, we have continued to empower and engage our community<br />
members in the conduct <strong>of</strong> <strong>City</strong> business. New tools and systems, such as Internet social<br />
networking, are carefully reviewed and, where there is a cost-effective benefit to using<br />
these systems to better involve our community, they are adopted and made a part <strong>of</strong><br />
Sunnyvale’s ongoing engagement practices. Socioeconomic conditions and trends will<br />
continue to affect the future nature and levels <strong>of</strong> community engagement in Sunnyvale<br />
and the <strong>City</strong> will continue to find creative ways to involve our citizenry.<br />
2–41
<strong>City</strong> <strong>of</strong> Sunnyvale GeneRal plan – July <strong>2011</strong><br />
2–42<br />
policy cv-1.1 ASSuRe ThAT All CoMMuniTY MeMbeRS hAve ReASon-<br />
Able ACCeSS To CiTY inFoRMATion, SeRviCeS And PRogRAMS wiThin<br />
budgeTed ReSouRCeS. (Previously Community Engagement Policy A.1)<br />
n CV-1.1a Provide news media with timely and comprehensive information regarding<br />
Council actions and <strong>City</strong> information <strong>of</strong> interest to the general public. (Previously<br />
Community Engagement Action Strategy A.1e)<br />
n CV-1.1b Monitor communications technology and policy developments and evaluate<br />
their potential impact on public information activities to improve communications,<br />
reduce duplication <strong>of</strong> effort, and enhance cost-effectiveness. (Previously Community<br />
Engagement Action Strategy A.1h)<br />
n CV-1.1c Ensure an integrated approach to informing community members about<br />
local issues, <strong>City</strong> programs and services, and community activities that reaches<br />
segments <strong>of</strong> a diverse community. (Previously Community Engagement Policy A.13)<br />
n CV-1.1d Work with businesses, local institutions, school districts and other public<br />
agencies to develop informational networks serving the community and assist in<br />
informing the community about local issues, <strong>City</strong> services and programs, and<br />
community activities. (Previously Community Engagement Action Strategy A.3e)<br />
n CV-1.1e Comply with all applicable laws prohibiting discrimination against<br />
individuals with disabilities, including the Americans with Disabilities Act, and<br />
create an environment <strong>of</strong> inclusion in all <strong>City</strong> programs and services. (NEW!)<br />
policy cv-1.2 PRovide ACCuRATe And ThoRough inFoRMATion<br />
in A TiMelY MAnneR To enSuRe ThAT CoMMuniTY MeMbeRS hAve<br />
An oPPoRTuniTY To ReSPond eFFeCTivelY. (Previously Community<br />
Engagement Policy A.2)<br />
n CV-1.2a Identify residents, community organizations and businesses affected<br />
by significant <strong>City</strong> actions and decisions and ensure that they receive timely and<br />
appropriate information enabling participation in planning and decision-making<br />
processes. (Previously Community Engagement Action Strategy A.2b)<br />
n CV-1.2b Ensure that effective public notification and access, in accordance with<br />
relevant laws and <strong>City</strong> Council policies, are provided to enhance meaningful<br />
community participation in the policy making process. (Previously Community<br />
Engagement Action Strategy A.2c)
community vision — citywide vision Goals Chapter 2<br />
n CV-1.2c Publish and distribute timely and accurate information regarding <strong>City</strong><br />
programs and services, <strong>City</strong> Council actions and policy issues. (Previously<br />
Community Engagement Action Strategy A.2i)<br />
policy cv-1.3 enCouRAge CoMMuniTY involveMenT in The<br />
develoPMenT And iMPleMenTATion oF CiTY And CoMMuniTY<br />
ACTiviTieS, PRogRAMS And SeRviCeS. (Previously Community Engagement<br />
Policy B.1)<br />
n CV-1.3a Simplify processes and procedures to make it easy and convenient for<br />
community members to participate in <strong>City</strong> activities and programs. (Previously<br />
Community Engagement Policy B.2)<br />
n CV-1.3b. Provide community outreach programs throughout the <strong>City</strong> to improve<br />
service delivery and communication with community members. (Previously<br />
Community Engagement Action Strategy B.2a)<br />
n CV-1.3c Facilitate the development <strong>of</strong> relationships and partnerships among<br />
community organizations, the business community and the <strong>City</strong> to achieve common<br />
goals. (Previously Community Engagement Action Strategy B.2b)<br />
n CV-1.3d Develop specific criteria and plans to obtain a diversity <strong>of</strong> representation<br />
in community engagement activities. (Previously Community Engagement Action<br />
Strategy B.6a)<br />
n CV-1.3e Encourage a diverse pool <strong>of</strong> applicants for membership on boards,<br />
commissions, advisory committees and task forces to reflect the diversity <strong>of</strong> the<br />
community. (Previously Community Engagement Action Strategy B.6b)<br />
n CV-1.3f Work with local school districts, community organizations and corporate<br />
employers to encourage community members’ involvement in local government,<br />
community activities and issues. (Previously Community Engagement Action Strategy<br />
B.3a)<br />
2–43
<strong>City</strong> <strong>of</strong> Sunnyvale GeneRal plan – July <strong>2011</strong><br />
2–44<br />
BalanCed GroWth<br />
The projections for growth <strong>of</strong> the <strong>City</strong> <strong>of</strong> Sunnyvale over the 20-year period from 2005<br />
to 2025 are shown in Figure 2-16.<br />
figure 2-16: <strong>City</strong>wide Growth Projections<br />
2005<br />
Projected<br />
Growth<br />
2025<br />
Population 132,725 18,000 150,725<br />
housing units 54,300 7,200 61,500<br />
Jobs 84,800 24,800 109,600<br />
<strong>of</strong>fice/industrial Floor Area 30,100,000 7,600,000 37,700,000<br />
Sources: U.S. Census 2005 and <strong>City</strong> <strong>of</strong> Sunnyvale, Community Development Department<br />
On an annual basis, this averages a net increase <strong>of</strong> 360 housing units and 380,000 sq ft<br />
<strong>of</strong> <strong>of</strong>fice/industrial floor area per year. These figures seem quite reasonable in relation<br />
to annual development rates in recent years.<br />
The Community Vision and the Long-range Planning Goal seek to achieve this<br />
growth while sustaining an outstanding quality <strong>of</strong> life; and to accommodate growth<br />
in a balanced manner, so development <strong>of</strong> new housing units generally keeps up with<br />
development <strong>of</strong> new jobs, and infrastructure capacity improvements keep up with the<br />
growth overall. These are the challenges addressed in this section.<br />
The <strong>City</strong> <strong>of</strong> Sunnyvale has identified areas <strong>of</strong> the <strong>City</strong> in which growth is encouraged.<br />
These areas were identified in the Futures Study (1993), the Downtown Specific Plan<br />
(2003), the M<strong>of</strong>fett Park Specific Plan (2004), the El Camino Real Precise Plan (2006),<br />
the Community Development Strategy (2003) and the Housing Element (2002). Figure<br />
2-17 lists these preferred growth areas and presents estimates for their development<br />
potential. The areas are mapped in Figure 2-18.
figure 2-17: Potential Growth Areas –<br />
housing Units and Office/Industrial Square footage<br />
Area<br />
New housing Units<br />
Potential for Growth<br />
New Office/Industrial<br />
floor Area (sq. ft.)<br />
downtown 1,100 588,000<br />
M<strong>of</strong>fett Park — 8,730,000<br />
Peery Park — 600,000<br />
industrial to Residential (iTR) Sites<br />
iTR 4a (evelyn Av & wolfe Rd)<br />
iTR 4b (Aster Av)<br />
iTR 6a (Arques Av)<br />
iTR 7 (Fair oaks Av & Tasman dr)<br />
iTR – (lawrence exp & duane Av)<br />
other Areas<br />
Corn Palace<br />
el Camino Real nodes<br />
other industrial Areas<br />
other Commercial Areas<br />
6,200 —<br />
3,600 3,782,000<br />
Totals: 10,900 13,700,000<br />
Note: All numbers rounded <strong>of</strong>f to the nearest 100<br />
Source: <strong>City</strong> <strong>of</strong> Sunnyvale, Community Development Department, 2005<br />
community vision — balanced GRowth Chapter 2<br />
The total potential growth in these designated development areas exceeds the 20-year<br />
growth projections, indicating the projected growth can be accommodated in a manner<br />
which is consistent with current policy, which will achieve economic development<br />
and community design objectives, and which will not negatively impact low-density<br />
residential neighborhoods. More specific planning for this growth will be accomplished<br />
through the updates <strong>of</strong> the Land Use and Transportation Element and the Housing<br />
Element <strong>of</strong> the General Plan.<br />
The final challenge is to maintain a reasonable balance between population growth and<br />
job growth, and between development and the infrastructure which supports it. Figure<br />
2-19 presents a Balanced Growth Pr<strong>of</strong>ile, a planning tool which can be used to monitor<br />
growth and to determine the relative balance among the factors cited above.<br />
2–45
<strong>City</strong> <strong>of</strong> Sunnyvale GeneRal plan – July <strong>2011</strong><br />
figure 2-18: Potential<br />
Growth Areas Map<br />
2–46<br />
CENTRAL<br />
Potential Growth Areas<br />
CA-85<br />
Mixed Use<br />
Office/Industrial<br />
Residential<br />
BERNARDO<br />
CA-237<br />
FREMONT<br />
MARY<br />
Community Development Department, 2005<br />
REM<strong>IN</strong>GTON<br />
HOLLENBECK<br />
STELL<strong>IN</strong>G<br />
PEERY PARK<br />
CENTRAL EXPRESSWAY<br />
MATHILDA<br />
DOWNTOWN<br />
<strong>SUNNYVALE</strong> SARATOGA<br />
<strong>SUNNYVALE</strong><br />
MOFFETT PARK<br />
OLD SAN FRANCISCO<br />
US-280<br />
MAUDE<br />
CALIFORNIA<br />
FAIR OAKS<br />
EL CAM<strong>IN</strong>O REAL<br />
WOLFE<br />
JAVA<br />
FAIR OAKS<br />
EVELYN<br />
CARIBBEAN<br />
TASMAN<br />
REED<br />
HOMESTEAD<br />
LAWRENCE EXPRESSWAY<br />
US-101<br />
ARQUES<br />
KIFER<br />
MONROE<br />
GREAT AMERICA<br />
BOWERS<br />
Highway/Expressway<br />
Major Streets<br />
Å Train Station<br />
Railroad<br />
! Light Rail Station<br />
Light Rail<br />
Creek<br />
Channel<br />
0.5<br />
Miles<br />
¸<br />
US-101
figure 2-19: Balanced Growth Pr<strong>of</strong>ile<br />
2005 2006 Projected Increases<br />
2005-2025<br />
Park Capacity Improvements (0)<br />
Utility Capacity Improvements (0)<br />
Transportation Capacity Improvements (0)<br />
162<br />
1.5 Million<br />
200,000<br />
227,900<br />
348<br />
1,537<br />
819<br />
Office/Industrial Floor Area<br />
Housing Units<br />
Jobs<br />
Population<br />
Public School Capacity<br />
Increase in Annual Tax Revenue<br />
Retail/Service Floor Area<br />
0% 5% 10% 15% 20% 25%<br />
community vision — balanced GRowth Chapter 2<br />
100%<br />
Planned<br />
Improvements<br />
1,356 Students<br />
16.7 Million Dollars<br />
2.2 Million sq. ft.<br />
7.6 Million sq. ft.<br />
7,200 Units<br />
24,800 Jobs<br />
18,000 People<br />
100%<br />
Figure 2-19 shows only the first five years, or 25 percent, <strong>of</strong> the 20-year planning period.<br />
The pr<strong>of</strong>ile will be extended one year each year, adding on the incremental growth from<br />
the preceding year. Eventually, the pr<strong>of</strong>ile will extend all the way to 2025. The pr<strong>of</strong>ile<br />
assumes that Sunnyvale is in a reasonably balanced state in 2005. This is supported<br />
by the high level <strong>of</strong> satisfaction expressed by the population in the 2005 Resident<br />
Satisfaction Survey, by the adequate functioning <strong>of</strong> utilities, by the satisfactory level <strong>of</strong><br />
service in traffic operation, and by the lack <strong>of</strong> severe overcrowding in the schools.<br />
The first two rows in the pr<strong>of</strong>ile are the major drivers <strong>of</strong> growth, population and jobs.<br />
The population growth over 20 years is projected to be 18,000; the average annual<br />
population increase would be 5 percent <strong>of</strong> the 20 year total, or 900. Since the population<br />
between 2005 and 2006 grew by only 819, the population growth bar on the pr<strong>of</strong>ile falls<br />
short <strong>of</strong> what would be expected in 2006 at an average annual growth rate. The opposite<br />
is true <strong>of</strong> jobs, where a 1,537 one-year increase exceeded the average annual increase<br />
<strong>of</strong> 1,240 based on a 20-year projected increase <strong>of</strong> 24,800 jobs. The current situation <strong>of</strong><br />
jobs increasing more rapidly than population is to be expected during a period where<br />
the economy is rebounding from a slump. The job increase is largely making up for job<br />
loss in the early part <strong>of</strong> the decade, employing the unemployed before it stimulates an<br />
increase in population.<br />
A similar process is used to create each <strong>of</strong> the bars in the pr<strong>of</strong>ile. With regard to<br />
supporting infrastructure and facilities (the last three rows in the pr<strong>of</strong>ile), capacity<br />
improvements necessary to support the expected growth are listed in the Transportation<br />
Strategic Program, the Sanitary Sewer Plan and the Water Distribution Plan (the last<br />
two are currently being prepared and will be completed in 2009 and 2010, respectively).<br />
Similarly, the <strong>City</strong> proposes to prepare a plan in 2008 for Parks and Open Space <strong>of</strong><br />
the Future, which will project park capacity improvement needs through 2025. These<br />
See GeneralPlan.inSunnyvale.<br />
com for yearly updates to the<br />
Balanced Growth pr<strong>of</strong>ile.<br />
2–47
<strong>City</strong> <strong>of</strong> Sunnyvale GeneRal plan – July <strong>2011</strong><br />
2–48<br />
plans include the current estimated cost for each projected improvement. A comparison<br />
<strong>of</strong> the cost <strong>of</strong> an individual infrastructure improvement (e.g., a street intersection<br />
improvement) to the total cost <strong>of</strong> all such proposed infrastructure improvements<br />
(i.e., all required transportation capacity improvements through 2025) indicates the<br />
proportion (percentage) <strong>of</strong> the total program that the specific improvement represents.<br />
As the construction <strong>of</strong> each improvement is completed and the increase in capacity is<br />
realized, the bar <strong>of</strong> that element is extended by the percentage <strong>of</strong> the total program that<br />
the improvement represents.<br />
It should be noted, particularly with regard to transportation capacity improvements,<br />
that many <strong>of</strong> the capacity improvements that will be made over the next 20 years will be<br />
initiated and funded by state, regional and county agencies, not by the <strong>City</strong> <strong>of</strong> Sunnyvale.<br />
Even though the traffic model utilized by the Transportation Strategic Program takes<br />
into account these planned regional improvements, only improvements funded in<br />
whole or in part by the <strong>City</strong> <strong>of</strong> Sunnyvale are included in the Balanced Growth Pr<strong>of</strong>ile.<br />
The Pr<strong>of</strong>ile assumes that the other jurisdictions are proceeding with planned capacity<br />
improvements at a reasonable pace in accordance with their plans.<br />
If all elements were growing in a balanced manner, all <strong>of</strong> the bars in the pr<strong>of</strong>ile would<br />
be <strong>of</strong> equal length every year, extending exactly to the then current year. Obviously, this<br />
will not always be the case. An imbalance in a single year does not signify a problem. An<br />
imbalance over multiple years, however, should be <strong>of</strong> some concern to decision-makers,<br />
who may want to consider modifications <strong>of</strong> development policy to achieve a more<br />
balanced growth. As the Sunnyvale Community Vision is updated in the future, or as<br />
functional element updates result in different projected goals for 2025, the Balanced<br />
Growth Pr<strong>of</strong>ile must be recalibrated to reflect revised projected increases.<br />
For the first year <strong>of</strong> the 20-year planning period, Figure 2-19 shows not only that job growth<br />
exceeded population growth, but also that there were no significant improvements in the<br />
capacity <strong>of</strong> infrastructure and parks to support that growth. While not significant in this<br />
single year, if this trend should continue over multiple years, decision-makers should be<br />
concerned that infrastructure and park improvement plans are not being implemented<br />
at a satisfactory rate, and that steps should be taken to accelerate implementation.
lookinG forWard to 2025<br />
community vision — lookinG foRwaRd to 2025 Chapter 2<br />
This Community Vision presents the desired future for the <strong>City</strong> <strong>of</strong> Sunnyvale. It sets<br />
forth a specific vision, long-range <strong>City</strong>wide goals, and a strategy <strong>of</strong> balanced growth<br />
which will maintain the basic character and attractiveness <strong>of</strong> the community. It is the<br />
desire <strong>of</strong> the people <strong>of</strong> Sunnyvale to maintain and enhance today’s community values,<br />
expressed in the following value statement:<br />
SunnYvAle iS An attractive, safe, environmentally sensitive<br />
CoMMuniTY whiCh TAkeS PRide in The diveRSiTY oF iTS PeoPle, The<br />
innovation oF iTS buSineSSeS And The responsiveness oF iTS<br />
goveRnMenT.<br />
Maintenance and enhancement <strong>of</strong> these values, however, does not imply the <strong>City</strong> will<br />
remain exactly as it is today. As it has throughout its relatively short history, Sunnyvale<br />
will continue to change. A diverse population will enrich and diversify the culture <strong>of</strong> the<br />
<strong>City</strong>, and future populations will interpret the community values in a manner different<br />
from today’s interpretation. The economy will change, but prosperity will remain,<br />
hopefully shared by all segments <strong>of</strong> the community.<br />
The physical <strong>City</strong> will change as well. Some <strong>of</strong> that change will be driven by growth, but<br />
much <strong>of</strong> that change will reflect the commitment <strong>of</strong> individual residents and businesses<br />
to maintain and improve their properties, cumulatively resulting in a better and more<br />
attractive city. The Community Vision has demonstrated that change can be positive,<br />
and that growth can be accommodated without sacrificing community values or<br />
jeopardizing Sunnyvale’s outstanding quality <strong>of</strong> life.<br />
The Community Vision sets the stage for a better future. But it is not self-fulfilling.<br />
Its achievement is dependent upon the commitment <strong>of</strong> community leaders, today and<br />
in the future. <strong>City</strong> government must do its part, translating the Vision into specific<br />
policies and action strategies. Each resident, property owner and business must also do<br />
his or her part — step by step — building upon today’s strengths, overcoming today’s<br />
shortcomings, and creating the great city which the people <strong>of</strong> Sunnyvale envision.<br />
2–49
chapteR 3<br />
land use and<br />
tRanspoRtation<br />
The Land Use and Transportation chapter contains information on<br />
the following topics:<br />
n Land use — information on land use categories and the general<br />
plan land use map, with discussion and policies relating to future<br />
land use development.<br />
n Transportation — goals and policies related to transportation<br />
improvements.<br />
n Economy — information on current economic conditions and<br />
discussion and policies relating to future trends and challenges.<br />
n Open space — information on open space areas, service needs<br />
and future policies to meet demand for open space.
land uSe<br />
Land use has an effect on virtually all other elements <strong>of</strong> the General Plan. Land use<br />
determines the character <strong>of</strong> the community, its economic vitality and future demand<br />
for services. Therefore, it is essential to have a firm base from which to identify and<br />
consider land use issues. While providing this information, the General Plan also<br />
articulates the community’s vision for the future through a description <strong>of</strong> goals, policies<br />
and actions. Since the first General Plan was adopted for Sunnyvale in 1957, the <strong>City</strong> has<br />
expressed its goals for the future with emphasis in four broad areas:<br />
n Appropriate housing<br />
n Strong economy<br />
n Transportation efficiency<br />
n Community character<br />
These areas are comprehensive and interwoven concepts. They have a timeless quality<br />
and continue to provide a solid platform for the <strong>City</strong>’s land use and transportation goals.<br />
The Land Use and Transportation Element sections will be updated in 2012. The<br />
goals and policies <strong>of</strong> this element and other policies relating to a strong economy and<br />
community character are being reviewed as part <strong>of</strong> that update. Users <strong>of</strong> this General<br />
Plan should consult the full text <strong>of</strong> the Land Use and Transportation Element for the<br />
data and analysis, as well as action programs and other information. The goals and<br />
policies and a summary <strong>of</strong> the discussion are below.<br />
Goal lt-1<br />
Coordinated reGional planninG<br />
land use and tRanspoRtation — land use Chapter 3<br />
PRoTeCT And SuSTAin A high QuAliTY oF liFe in SunnYvAle bY PARTiCiPATing<br />
in CooRdinATed lAnd uSe And TRAnSPoRTATion PlAnning in The Region.<br />
(Previously LUTE Goal R1 / Adopted in 1997)<br />
policy lt-1.1 AdvoCATe The CiTY’S inTeReSTS To RegionAl AgenCieS<br />
ThAT MAke lAnd uSe And TRAnSPoRTATion SYSTeM deCiSionS ThAT<br />
AFFeCT SunnYvAle. (Previously LUTE Policy R1.1)<br />
the full text <strong>of</strong> the land use<br />
and transportation element<br />
is available at GeneralPlan.<br />
inSunnyvale.com<br />
3–3
<strong>City</strong> <strong>of</strong> Sunnyvale GeneRal plan – July <strong>2011</strong><br />
3–4<br />
policy lt-1.2 SuPPoRT CooRdinATed RegionAl TRAnSPoRTATion<br />
SYSTeM PlAnning And iMPRoveMenTS. (Previously LUTE Policy R1.2)<br />
policy lt-1.3 PRoMoTe inTegRATed And CooRdinATed loCAl lAnd<br />
uSe And TRAnSPoRTATion PlAnning. (Previously LUTE Policy R1.3)<br />
n LT-1.3a Participate in intergovernmental activities related to regional and subregional<br />
land use and transportation planning in order to advance the <strong>City</strong>’s interests.<br />
(Previously LUTE Action Strategy R1.3.1)<br />
n LT-1.3b Promote shorter commute trips and ease congestion by advocating that all<br />
communities provide housing and employment opportunities. (Previously LUTE<br />
Action Strategy R1.3.2)<br />
n LT-1.3c Monitor significant land use and transportation decisions pending in other<br />
communities to ensure that Sunnyvale is not adversely affected. (Previously LUTE<br />
Action Strategy R1.3.3)<br />
policy lt-1.4 AChieve An oPeRATing level oF SeRviCe (loS) “e” oR<br />
beTTeR FoR All RegionAl RoAdwAYS And inTeRSeCTionS, AS deFined<br />
bY The CiTY FunCTionAl ClASSiFiCATion oF The STReeT SYSTeM.<br />
(Previously LUTE Policy R1.4)<br />
policy lt-1.5 MAinTAin A FunCTionAl ClASSiFiCATion oF The STReeT<br />
SYSTeM ThAT idenTiFieS CongeSTion MAnAgeMenT PRogRAM<br />
RoAdwAYS And inTeRSeCTionS, AS well AS loCAl RoAdwAYS And<br />
inTeRSeCTionS oF RegionAl SigniFiCAnCe. (Previously LUTE Policy R1.5)<br />
policy lt-1.6 PReSeRve The oPTion oF exTending MARY Avenue To The<br />
induSTRiAl AReAS noRTh oF u.S. highwAY 101. (Previously LUTE Policy R1.6)
land use and tRanspoRtation — land use Chapter 3<br />
policy lt-1.7 ConTRibuTe To eFFoRTS To MiniMize Region-wide<br />
AveRAge TRiP lengTh And Single-oCCuPAnT vehiCle TRiPS. (Previously<br />
LUTE Policy R1.7)<br />
n LT-1.7a Locate higher intensity land uses and developments so that they have easy<br />
access to transit services. (Previously LUTE Action Strategy R1.7.1)<br />
n LT-1.7b Support regional efforts which promote higher densities near major transit<br />
and travel facilities, without increasing the overall density <strong>of</strong> land usage. (Previously<br />
LUTE Action Strategy R1.7.2)<br />
n LT-1.7c Cooperate in efforts to study demand management initiatives including<br />
congestion-pricing, flexible schedules, gas taxes and market-based programs.<br />
(Previously LUTE Action Strategy R1.7.3)<br />
policy lt-1.8 SuPPoRT STATewide, RegionAl And Sub-RegionAl<br />
eFFoRTS ThAT PRovide FoR An eFFeCTive TRAnSPoRTATion SYSTeM.<br />
(Previously LUTE Policy R1.8)<br />
n LT-1.8a Endorse funding to provide transportation system improvements that<br />
facilitate regional and interregional travel. (Previously LUTE Action Strategy R1.8.1)<br />
n LT-1.8b Advocate the preservation <strong>of</strong> railroad lines for both commuter and freight<br />
transit. (Previously LUTE Action Strategy R1.8.2)<br />
n LT-1.8c Advocate improvements to state and county roadways serving Sunnyvale.<br />
(Previously LUTE Action Strategy R1.8.3)<br />
n LT-1.8d Support efforts to plan and implement effective inter-jurisdictional<br />
transportation facilities. (Previously LUTE Action Strategy R1.8.4)<br />
policy lt-1.9 SuPPoRT Flexible And APPRoPRiATe AlTeRnATive<br />
TRAnSPoRTATion ModeS And TRAnSPoRTATion SYSTeM MAnAgeMenT<br />
MeASuReS ThAT ReduCe ReliAnCe on The AuToMobile And SeRve<br />
ChAnging RegionAl And CiTYwide lAnd uSe And TRAnSPoRTATion<br />
needS. (Previously LUTE Policy R1.9)<br />
3–5
<strong>City</strong> <strong>of</strong> Sunnyvale GeneRal plan – July <strong>2011</strong><br />
See Goal em-11 (improved<br />
air Quality) for further<br />
discussion and policies<br />
relating to proximity <strong>of</strong><br />
housing and jobs.<br />
3–6<br />
n LT-1.9a Support state and regional efforts to provide High Occupant Vehicle (HOV)<br />
lanes, ridesharing, mass transit service, bicycling and Intelligent Transportation<br />
Systems. (Previously LUTE Action Strategy R1.9.1)<br />
n LT-1.9b Promote modes <strong>of</strong> travel and actions that reduce single-occupant vehicle<br />
trips and trip lengths. (Previously LUTE Action Strategy R1.9.2)<br />
policy lt-1.10 SuPPoRT lAnd uSe PlAnning ThAT CoMPleMenTS The<br />
RegionAl TRAnSPoRTATion SYSTeM. (Previously LUTE Policy R1.10)<br />
n LT-1.10a Encourage a variety <strong>of</strong> land use types and intensities on a regional level<br />
while maintaining and improving regional transportation service levels. (Previously<br />
LUTE Action Strategy R1.10.1)<br />
n LT-1.10b Support alternative transportation services, such as light rail, buses and<br />
commuter rail, through appropriate land use planning. (Previously LUTE Action<br />
Strategy R1.10.2)<br />
n LT-1.10c Encourage mixed uses near transit centers. (Previously LUTE Action Strategy<br />
R1.10.3)<br />
policy lt-1.11 PRoTeCT RegionAl enviRonMenTAl ReSouRCeS ThRough<br />
loCAl lAnd uSe PRACTiCeS. (Previously LUTE Policy R1.11)<br />
n LT-1.11a Participate in state and regional activities to protect the natural environment.<br />
(Previously LUTE Action Strategy R1.11.1)<br />
n LT-1.11b Protect and preserve the diked wetland areas in the Baylands, which serve<br />
as either salt evaporation ponds or holding ponds for the wastewater treatment plant.<br />
(Previously LUTE Action Strategy R1.11.2)
policy lt-1.12 PRoTeCT The QuAliTY oF liFe FoR ReSidenTS And<br />
buSineSSeS in SunnYvAle bY ACTivelY PARTiCiPATing in diSCuSSionS<br />
And deCiSionS on PoTenTiAl uSeS oF MoFFeTT FedeRAl AiRField.<br />
(Previously LUTE Policy R1.12)<br />
n LT-1.12a Comprehensively review any proposed aviation services at M<strong>of</strong>fett that<br />
could increase aviation activity or noise exposure. (Previously LUTE Action Strategy<br />
R1.12.1)<br />
n LT-1.12b Encourage appropriate uses that best support business and residents’ desire<br />
in Sunnyvale. (Previously LUTE Action Strategy R1.12.2)<br />
n LT-1.12c Pursue annexation <strong>of</strong> that portion <strong>of</strong> M<strong>of</strong>fett Federal Airfield within<br />
Sunnyvale’s sphere <strong>of</strong> influence. (Previously LUTE Action Strategy R1.12.3)<br />
Goal lt-2<br />
an attraCtive CoMMunity<br />
PReSeRve And enhAnCe An ATTRACTive CoMMuniTY, wiTh A PoSiTive iMAge<br />
And A SenSe oF PlACe ThAT ConSiSTS oF diSTinCTive neighboRhoodS,<br />
PoCkeTS oF inTeReST And huMAn-SCAle develoPMenT. (Previously LUTE Goal<br />
C1 / Adopted in 1997)<br />
figure 3-1: General Plan and Zoning Districts<br />
General Plan Category Zoning Districts<br />
Residential<br />
Rlo — Residential low density<br />
(0-7 dwelling units/acre)<br />
RlM — Residential low Medium density<br />
(7-14 dwelling units/acre)<br />
RMed — Residential Medium density<br />
(14-27 dwelling units/acre)<br />
Rhi — Residential high density<br />
(27-45 dwelling units/acre)<br />
Rvh — Residential very high density<br />
(45-65 dwelling units/acre)<br />
land use and tRanspoRtation — land use Chapter 3<br />
(R-0 and R-1) low density Residential<br />
(R-1.5 and R-2) low-Medium Residential<br />
(R-1.7/Pd) low-Medium density Residential/<br />
Planned development<br />
(R-3) Medium density Residential<br />
(R-4) high density Residential<br />
(R-5) high density Residential/<strong>of</strong>fice<br />
101/lawrence Site Specific Plan<br />
See Goal cc-1 (a<br />
Distinguished city image)<br />
for further discussion and<br />
policies relating to enhancing<br />
neighborhoods and districts.<br />
3–7
<strong>City</strong> <strong>of</strong> Sunnyvale GeneRal plan – July <strong>2011</strong><br />
3–8<br />
General Plan Category Zoning Districts<br />
MhP — Mobile home Park (R-Mh) Residential Mobile home district<br />
Commercial/Office<br />
CnS — Commercial neighborhood Shopping (C-1) neighborhood business<br />
Cgb — Commercial general business (C-2) highway business<br />
(C-4) Service Commercial<br />
CCb — Commercial Central business (C-3) Regional business<br />
o — <strong>of</strong>fice (o) Administrative-Pr<strong>of</strong>essional <strong>of</strong>fice<br />
(R-5) high density Residential/<strong>of</strong>fice<br />
Industrial<br />
i — industrial (M-S) industrial Service<br />
(M-3) general industrial<br />
Public/Quasi-Public facilities<br />
PARk — Parks<br />
SCh — Schools<br />
env — environmental Services<br />
bAY — baylands<br />
CC — Civic Center<br />
(P-F) Public Facility<br />
MoF — M<strong>of</strong>fett Federal Airfield unincorporated Public Facility<br />
Special Areas<br />
iTR — industrial to Residential —<br />
low-Medium through high density<br />
Residential (7-45 dwelling units/acre)<br />
lSP — lakeside Specific Plan —<br />
Residential and Commercial Services<br />
MP — M<strong>of</strong>fett Park Specific Plan — <strong>of</strong>fice,<br />
industrial and Commercial Services<br />
dSP — downtown Specific Plan — <strong>of</strong>fice,<br />
Retail, Mixed use and low through very high<br />
density Residential (7-78 dwelling units/acre)<br />
(iTR) industrial to Residential (iTR/R-1.5,<br />
iTR/R-1.7/Pd, iTR/R-2, iTR/R-3, iTR/R-4)<br />
(lSP) lakeside Specific Plan<br />
(MP-Tod) M<strong>of</strong>fett Park Transit oriented<br />
development<br />
(MP-i) M<strong>of</strong>fett Park industrial<br />
(MP-C) M<strong>of</strong>fett Park Commercial<br />
dSP blocks 1-20. See the downtown Specific<br />
Plan for a breakdown <strong>of</strong> permitted uses in each<br />
dSP block.
MIDDLEFIELD<br />
GRANT<br />
General Plan Land Use<br />
Low Density Res(0-7 du/ac)<br />
Low Medium Density Res (7-14 du/ac)<br />
Medium Density Res (14-27 du/ac)<br />
High Density Res (27-45 du/ac)<br />
Very High Density Res (45-65 du/ac)<br />
Mobile Home Residential<br />
General Business<br />
Central Business<br />
Neighborhood Commercial<br />
Commercial Intensification<br />
Downtown Specific Plan<br />
Office<br />
Office/High Density Residential<br />
Parks<br />
Schools<br />
Civic Center<br />
Environmental Services<br />
Industry<br />
Industrial Intensification<br />
M<strong>of</strong>fett Park<br />
Industrial to Residential (Low Med Density)<br />
Industrial to Residential (Med Density)<br />
Industrial to Residential (Medium to High Density)<br />
Industrial to Residential (High Density)<br />
CENTRAL<br />
CA-85<br />
BERNARDO<br />
CA-237<br />
FREMONT<br />
Community Development Department, <strong>2011</strong><br />
MARY<br />
REM<strong>IN</strong>GTON<br />
HOLLENBECK<br />
STELL<strong>IN</strong>G<br />
CENTRAL EXPRESSWAY<br />
land use and tRanspoRtation — land use Chapter 3<br />
<strong>SUNNYVALE</strong> SARATOGA<br />
<strong>SUNNYVALE</strong><br />
MATHILDA<br />
OLD SAN FRANCISCO<br />
US-280<br />
CALIFORNIA<br />
MAUDE<br />
EL CAM<strong>IN</strong>O REAL<br />
FAIR OAKS<br />
WOLFE<br />
JAVA<br />
FAIR OAKS<br />
EVELYN<br />
CARIBBEAN<br />
TASMAN<br />
REED<br />
HOMESTEAD<br />
LAWRENCE<br />
US-101<br />
ARQUES<br />
KIFER<br />
MONROE<br />
Major Streets<br />
Highway/Expressway<br />
Å Train Station<br />
! Light Rail Station<br />
Light Rail<br />
Railroad<br />
Creek<br />
Channel<br />
0.5<br />
Miles<br />
¸<br />
GREAT AMERICA<br />
BOWERS<br />
US-101<br />
figure 3-2: General Plan<br />
Land Use Map<br />
3–9
<strong>City</strong> <strong>of</strong> Sunnyvale GeneRal plan – July <strong>2011</strong><br />
3–10<br />
policy lt-2.1 ReCognize ThAT The CiTY iS CoMPoSed oF ReSidenTiAl,<br />
induSTRiAl And CoMMeRCiAl neighboRhoodS, eACh wiTh iTS own<br />
individuAl ChARACTeR; And Allow ChAnge ConSiSTenT wiTh<br />
ReinFoRCing PoSiTive neighboRhood vAlueS. (Previously LUTE Policy C1.1)<br />
n LT-2.1a Prepare and update land use and transportation policies, design guidelines,<br />
regulations and engineering specifications to reflect community and neighborhood<br />
values. (Previously LUTE Action Strategy C1.1.1)<br />
n LT-2.1b Promote and achieve compliance with land use and transportation standards.<br />
(Previously LUTE Action Strategy C1.1.2)<br />
n LT-2.1c Require appropriate buffers, edges and transition areas between dissimilar<br />
neighborhoods and land uses. (Previously LUTE Action Strategy C1.1.3)<br />
n LT-2.1d Require that commercial activities be conducted primarily within a building.<br />
(Previously LUTE Action Strategy C1.1.4)<br />
policy lt-2.2 enCouRAge nodeS oF inTeReST And ACTiviTY, SuCh<br />
AS PARkS, PubliC oPen SPACeS, well PlAnned develoPMenT, Mixed<br />
uSe PRoJeCTS And oTheR deSiRAble uSeS, loCATionS And PhYSiCAl<br />
ATTRACTionS. (Previously LUTE Policy C.1.2)<br />
n LT-2.2a Promote downtown as a unique place that is interesting and accessible to the<br />
whole <strong>City</strong> and the region. (Previously LUTE Action Strategy C1.2.1)<br />
n LT-2.2b Encourage development <strong>of</strong> diversified building forms and intensities.<br />
(Previously LUTE Action Strategy C1.2.2)<br />
n LT-2.2c Encourage development <strong>of</strong> multi-modal transportation centers. (Previously<br />
LUTE Action Strategy C1.2.3)<br />
n LT-2.2d Maintain public open space areas and require private open space to be<br />
maintained. (Previously LUTE Action Strategy C1.2.4)
Goal lt-3<br />
appropriate Mix <strong>of</strong> houSinG<br />
land use and tRanspoRtation — land use Chapter 3<br />
enSuRe owneRShiP And RenTAl houSing oPTionS in TeRMS oF STYle, Size<br />
And denSiTY ThAT ARe APPRoPRiATe And ConTRibuTe PoSiTivelY To The<br />
SuRRounding AReA. (Previously LUTE Goal C2 / Adopted in 1997)<br />
policy lt-3.1 PRovide lAnd uSe CATegoRieS FoR And MAinTenAnCe<br />
oF A vARieTY oF ReSidenTiAl denSiTieS To oFFeR exiSTing And<br />
FuTuRe ReSidenTS oF All inCoMe levelS, Age gRouPS And SPeCiAl<br />
needS SuFFiCienT oPPoRTuniTieS And ChoiCeS FoR loCATing in The<br />
CoMMuniTY. (Previously LUTE Policy C2.1)<br />
n LT-3.1a Ensure consistency with the <strong>City</strong>’s Housing and Community Revitalization<br />
Sub-Element. (Previously LUTE Action Strategy C2.1.1)<br />
See chapter 5, Housing<br />
for further discussion and<br />
policies relating to provision<br />
<strong>of</strong> housing.<br />
3–11
<strong>City</strong> <strong>of</strong> Sunnyvale GeneRal plan – July <strong>2011</strong><br />
3–12<br />
n LT-3.1b Permit and maintain a variety <strong>of</strong> residential densities; including (Previously<br />
LUTE Action Strategy C2.1.2):<br />
• Low density (0-7 dwelling units per net acre)<br />
• Low-Medium density (7-14 dwelling units per net acre)<br />
• Mobile home park (up to 12 mobile home dwelling units per net acre)<br />
• Medium density (14-27 dwelling units per net acre)<br />
• High density (27-45 dwelling units per net acre)<br />
• Very high density (45-65 dwelling units per net acre)<br />
n LT-3.1c Promote the maintenance and rehabilitation <strong>of</strong> existing housing. (Previously<br />
LUTE Action Strategy C2.1.3)<br />
n LT-3.1d Support the transition <strong>of</strong> Industrial to Residential (ITR) areas as opportunities<br />
to increase housing variety and stock. (Previously LUTE Action Strategy C2.1.4)<br />
n LT-3.1e Study housing alternatives; including, co-housing, live-work spaces and<br />
transitional housing options to serve a changing population. (Previously LUTE<br />
Action Strategy C2.1.5)<br />
policy lt-3.2 enCouRAge The develoPMenT oF owneRShiP houSing<br />
To MAinTAin A MAJoRiTY oF houSing in The CiTY FoR owneRShiP<br />
ChoiCe. (Previously LUTE Policy C2.2)<br />
policy lt-3.3 MAinTAin loweR denSiTY ReSidenTiAl develoPMenT<br />
AReAS wheRe FeASible. (Previously LUTE Policy C2.3)<br />
n LT-3.3a Study the potential rezoning <strong>of</strong> properties in the R-4 and R-5 zoning districts<br />
to other zoning districts. (Previously LUTE Action Strategy C2.3.1)<br />
n LT-3.3b Promote and preserve single-family detached housing where appropriate<br />
and in existing single-family neighborhoods. (Previously LUTE Action Strategy<br />
C2.3.2)<br />
n LT-3.3c Monitor the progress <strong>of</strong> the remediation efforts for Futures Site 5 (General<br />
Plan Category <strong>of</strong> ITR for Low Medium Density Residential) to determine if and<br />
when conversion to residential use is appropriate. (Previously LUTE Action Strategy<br />
C2.3.3)
policy lt-3.4 deTeRMine APPRoPRiATe denSiTY FoR houSing bASed on<br />
SiTe PlAnning oPPoRTuniTieS And PRoxiMiTY To SeRviCeS. (Previously<br />
LUTE Policy C2.4)<br />
n LT-3.4a Locate higher-density housing with easy access to transportation corridors,<br />
rail transit stations, bus transit corridor stops, commercial services and jobs.<br />
(Previously LUTE Action Strategy C2.4.1)<br />
n LT-3.4b Locate lower-density housing in proximity to existing lower density housing.<br />
(Previously LUTE Action Strategy C2.4.2)<br />
Goal lt-4<br />
Quality neiGhBorhoodS and diStriCtS<br />
land use and tRanspoRtation — land use Chapter 3<br />
PReSeRve And enhAnCe The QuAliTY ChARACTeR oF SunnYvAle’S induSTRiAl,<br />
CoMMeRCiAl And ReSidenTiAl neighboRhoodS bY PRoMoTing lAnd uSe<br />
PATTeRnS And RelATed TRAnSPoRTATion oPPoRTuniTieS ThAT ARe SuPPoRTive<br />
oF The neighboRhood ConCePT. (Previously LUTE Goal N1 / Adopted in 1997)<br />
policy lt-4.1 PRoTeCT The inTegRiTY oF The CiTY’S neighboRhoodS;<br />
wheTheR ReSidenTiAl, induSTRiAl oR CoMMeRCiAl. (Previously LUTE<br />
Policy N1.1)<br />
n LT-4.1a Limit the intrusion <strong>of</strong> incompatible uses and inappropriate development<br />
into city neighborhoods. (Previously LUTE Action Statement N1.1.1)<br />
n LT-4.1b Foster the establishment <strong>of</strong> neighborhood associations throughout Sunnyvale<br />
to facilitate community building. (Previously LUTE Action Statement N1.1.2)<br />
n LT-4.1c Use density to transition between land use and to buffer between sensitive<br />
uses and less compatible uses. (Previously LUTE Action Statement N1.1.3)<br />
n LT-4.1d Anticipate and avoid whenever practical the incompatibility that can arise<br />
between dissimilar uses. (Previously LUTE Action Statement N1.1.4)<br />
n LT-4.1e Establish and monitor standards for community appearance and property<br />
maintenance. (Previously LUTE Action Statement N1.1.5)<br />
3–13
<strong>City</strong> <strong>of</strong> Sunnyvale GeneRal plan – July <strong>2011</strong><br />
3–14<br />
policy lt-4.2 ReQuiRe new develoPMenT To be CoMPATible wiTh<br />
The neighboRhood, AdJACenT lAnd uSeS And The TRAnSPoRTATion<br />
SYSTeM. (Previously LUTE Policy N1.2)<br />
n LT-4.2a Integrate new development and redevelopment into existing neighborhoods.<br />
(Previously LUTE Action Statement N1.2.1)<br />
n LT-4.2b Utilize adopted <strong>City</strong> design guidelines to achieve compatible architecture<br />
and scale for renovation and new development in Sunnyvale’s neighborhoods.<br />
(Previously LUTE Action Statement N1.2.2)<br />
n LT-4.2c Develop specific area plans to guide change in neighborhoods that need<br />
special attention. (Previously LUTE Action Statement N1.2.3)<br />
policy lt-4.3 SuPPoRT A Full SPeCTRuM oF ConvenienTlY loCATed<br />
CoMMeRCiAl, PubliC And QuASi-PubliC uSeS ThAT Add To The PoSiTive<br />
iMAge oF The CiTY. (Previously LUTE Policy N1.3)<br />
n LT-4.3a Review development proposals for compatibility within neighborhoods.<br />
(Previously LUTE Action Statement N1.3.1)<br />
n LT-4.3b Study the adequacy /deficiency <strong>of</strong> bicycle and pedestrian access and<br />
circulation within neighborhoods. (Previously LUTE Action Statement N1.3.2)<br />
n LT-4.3c Design streets, pedestrian paths and bicycle paths to link neighborhoods<br />
with services. (Previously LUTE Action Statement N1.3.3)<br />
policy lt-4.4 PReSeRve And enhAnCe The high QuAliTY ChARACTeR<br />
oF ReSidenTiAl neighboRhoodS. (Previously LUTE Policy N1.4)<br />
n LT-4.4a Require infill development to complement the character <strong>of</strong> the residential<br />
neighborhood. (Previously LUTE Action Statement N1.4.1)<br />
n LT-4.4b Site higher density residential development in areas to provide transitions<br />
between dissimilar neighborhoods and where impacts on adjacent land uses and the<br />
transportation system are minimal. (Previously LUTE Action Statement N1.4.2)<br />
n LT-4.4c Encourage and support home businesses that accommodate changing<br />
technologies and lifestyles, while remaining secondary to the nature <strong>of</strong> the residential<br />
neighborhood. (Previously LUTE Action Statement N1.4.3)
n LT-4.4d Promote small-scale, well-designed, pedestrian-friendly spaces within<br />
neighborhoods to establish safe and attractive gathering areas. (Previously LUTE<br />
Action Statement N1.4.4)<br />
n LT-4.4e Require amenities with new development that serve the needs <strong>of</strong> residents.<br />
(Previously LUTE Action Statement N1.4.5)<br />
policy lt-4.5 SuPPoRT A RoAdwAY SYSTeM ThAT PRoTeCTS inTeRnAl<br />
ReSidenTiAl AReAS FRoM CiTYwide And RegionAl TRAFFiC. (Previously<br />
LUTE Policy N1.5)<br />
n LT-4.5a Have internal residential neighborhood streets adequately serve traffic that is<br />
oriented to that neighborhood. (Previously LUTE Action Statement N1.5.1)<br />
n LT-4.5b Utilize the <strong>City</strong>’s residential neighborhood “Traffic Calming” techniques to<br />
address specific neighborhood traffic concerns. (Previously LUTE Action Statement<br />
N1.5.2)<br />
n LT-4.5c Discourage non-neighborhood traffic from using residential neighborhood<br />
streets by accommodating traffic demand on <strong>City</strong>wide and regional streets<br />
(Previously LUTE Action Statement N1.5.3)<br />
n LT-4.5d Coordinate with adjacent communities to reduce and minimize commute<br />
traffic through Sunnyvale’s residential neighborhoods. (Previously LUTE Action<br />
Statement N1.5.4)<br />
Industrial/Research and Development<br />
land use and tRanspoRtation — land use Chapter 3<br />
policy lt-4.6 SAFeguARd induSTRY’S AbiliTY To oPeRATe eFFeCTivelY,<br />
bY liMiTing The eSTAbliShMenT oF inCoMPATible uSeS in induSTRiAl<br />
AReAS. (Previously LUTE Policy N1.6)<br />
policy lt-4.7 SuPPoRT The loCATion oF ConvenienT ReTAil And<br />
CoMMeRCiAl SeRviCeS (e.g., ReSTAuRAnTS And hoTelS) in induSTRiAl<br />
AReAS To SuPPoRT buSineSSeS, TheiR CuSToMeRS And TheiR<br />
eMPloYeeS. (Previously LUTE Policy N1.7)<br />
3–15
<strong>City</strong> <strong>of</strong> Sunnyvale GeneRal plan – July <strong>2011</strong><br />
3–16<br />
policy lt-4.8 CluSTeR high inTenSiTY induSTRiAl uSeS in AReAS wiTh<br />
eASY ACCeSS To TRAnSPoRTATion CoRRidoRS. (Previously LUTE Policy N1.8)<br />
n LT-4.8a Require high quality site, landscaping and building design for higher-<br />
intensity industrial development. (Previously LUTE Action Statement N1.8.1)<br />
policy lt-4.9 Allow induSTRiAl, ReSidenTiAl, CoMMeRCiAl And<br />
oFFiCe uSeS in The induSTRiAl To ReSidenTiAl (iTR) FuTuReS SiTeS (SiTeS<br />
4A, 4b, 6A, 6b, 7, 8 And 10). (Previously LUTE Policy N1.9)<br />
Commercial/Office<br />
policy lt-4.10 PRovide APPRoPRiATe SiTe ACCeSS To CoMMeRCiAl And<br />
oFFiCe uSeS while PReSeRving AvAilAble RoAd CAPACiTY. (Previously<br />
LUTE Policy N1.10)<br />
n LT-4.10a Locate commercial uses where traffic can be accommodated, especially<br />
during peak periods (e.g. lunch time and commute times). (Previously LUTE Action<br />
Statement N1.10.1)<br />
n LT-4.10b Encourage commercial enterprises and <strong>of</strong>fices to provide support facilities<br />
for bicycles and pedestrians. (Previously LUTE Action Statement N1.10.2)<br />
policy lt-4.11 ReCognize el CAMino ReAl AS A PRiMARY ReTAil<br />
CoRRidoR wiTh A Mix oF uSeS. (Previously LUTE Policy N1.11)<br />
n LT-4.11a Use the Precise Plan for El Camino Real to protect legitimate business<br />
interests, while providing sufficient buffer and protection for adjacent and nearby<br />
residential uses. (Previously LUTE Action Statement N1.11.1)<br />
n LT-4.11b Minimize linear “strip development” in favor <strong>of</strong> commercial development<br />
patterns that reduce single-purpose vehicle trips. (Previously LUTE Action Statement<br />
N1.11.2)
policy lt-4.12 PeRMiT MoRe inTenSe CoMMeRCiAl And oFFiCe<br />
develoPMenT in The downTown, given iTS CenTRAl loCATion And<br />
ACCeSSibiliTY To TRAnSiT. (PReviouSlY LUTE Policy N1.12)<br />
n LT-4.12a Use the Downtown Specific Plan to facilitate the redevelopment <strong>of</strong><br />
downtown. (Previously LUTE Action Statement N1.12.1)<br />
policy lt-4.13 PRoMoTe An ATTRACTive And FunCTionAl CoMMeRCiAl<br />
enviRonMenT. (Previously LUTE Policy N1.13)<br />
n LT-4.13a Discourage commercial uses and designs that result in a boxy appearance.<br />
(Previously LUTE Action Statement N1.13.1)<br />
n LT-4.13b Support convenient neighborhood commercial services that reduce<br />
automobile dependency and contribute positively to neighborhood character.<br />
(Previously LUTE Action Statement N1.13.2)<br />
n LT-4.13c Provide opportunities for, and encourage neighborhood-serving<br />
commercial services in, each residential neighborhood. (Previously LUTE Action<br />
Statement N1.13.3)<br />
n LT-4.13d Encourage the maintenance and revitalization <strong>of</strong> shopping centers.<br />
(Previously LUTE Action Statement N1.13.4)<br />
n LT-4.13e Provide pedestrian and bicycling opportunities to neighborhood and<br />
commercial services. (Previously LUTE Action Statement N1.13.5)<br />
Public and Quasi-Public<br />
land use and tRanspoRtation — land use Chapter 3<br />
policy lt-4.14 SuPPoRT The PRoviSion oF A Full SPeCTRuM oF<br />
PubliC And QuASi-PubliC SeRviCeS (e.g., PARkS, dAY CARe, gRouP<br />
living, ReCReATion CenTeRS, ReligiouS inSTiTuTionS) ThAT ARe<br />
APPRoPRiATelY loCATed in ReSidenTiAl, CoMMeRCiAl And induSTRiAl<br />
neighboRhoodS And enSuRe ThAT TheY hAve beneFiCiAl eFFeCTS on<br />
The SuRRounding AReA. (Previously LUTE Policy N1.14)<br />
n LT-4.14a Encourage carpooling to public and quasi-public services to minimize<br />
adverse traffic and parking impacts on neighborhoods (Previously LUTE Action<br />
Statement N1.14.1) 3–17
<strong>City</strong> <strong>of</strong> Sunnyvale GeneRal plan – July <strong>2011</strong><br />
3–18<br />
n LT-4.14b Ensure the provision <strong>of</strong> bicycle support facilities at all major public use<br />
locations. (Previously LUTE Action Statement N1.14.2)<br />
n LT-4.14c Encourage multiple uses <strong>of</strong> some facilities (e.g. religious institutions,<br />
schools, social organizations, day care) within the capacity <strong>of</strong> the land and roadway<br />
system. (Previously LUTE Action Statement N1.14.3)<br />
n LT-4.14d Encourage employers to provide on-site facilities such as usable open space,<br />
health club facilities, and child care where appropriate. (Previously LUTE Action<br />
Statement N1.14.4)<br />
n LT-4.14e Maintain and promote convenient community centers and services<br />
that enhance neighborhood cohesiveness and provide social and recreational<br />
opportunities. (Previously LUTE Action Statement N1.14.5)<br />
n LT-4.14f Promote co-locating government (federal, state, county, city) activities<br />
to improve access to the community-at-large. (Previously LUTE Action Statement<br />
N1.14.6)<br />
tranSportation<br />
Goal lt-5<br />
effeCtive, Safe, pleaSant and Convenient tranSportation<br />
ATTAin A TRAnSPoRTATion SYSTeM ThAT iS eFFeCTive, SAFe, PleASAnT And<br />
ConvenienT. (Previously LUTE Goal C3 / Adopted in 1997)<br />
policy lt-5.1 AChieve An oPeRATing level-oF-SeRviCe (loS) oF “d” oR<br />
beTTeR on The CiTY-wide RoAdwAYS And inTeRSeCTionS, AS deFined<br />
bY The FunCTionAl ClASSiFiCATion oF The STReeT SYSTeM. (Previously<br />
LUTE Policy C3.1)<br />
n LT-5.1a Maintain and update a functional classification <strong>of</strong> the street system.<br />
(Previously LUTE Action Strategy C3.1.1)<br />
n LT-5.1b Monitor the operation and performance <strong>of</strong> the street system by establishing<br />
a routine data collection program and by conducting special data collection as the<br />
need arises. (Previously LUTE Action Strategy C3.1.2)<br />
n LT-5.1c Require roadway and signal improvements for development projects to<br />
minimize decline <strong>of</strong> existing levels <strong>of</strong> service. (Previously LUTE Action Strategy<br />
C3.1.3)
land use and tRanspoRtation — tRanspoRtation Chapter 3<br />
n LT-5.1d Study and implement physical and operational improvements to optimize<br />
roadway and intersection capacities. (Previously LUTE Action Strategy C3.141)<br />
n LT-5.1e Promote the reduction <strong>of</strong> single occupant vehicle (SOV) trips and encourage<br />
an increase in the share <strong>of</strong> trips taken by all other forms <strong>of</strong> travel. (Previously LUTE<br />
Action Strategy C3.1.5)<br />
n LT-5.1f Study the use <strong>of</strong> density, floor area limits, parking management, peak hour<br />
allocations and other techniques to maintain or achieve acceptable levels <strong>of</strong> service<br />
on existing roadways. (Previously LUTE Action Strategy C3.1.6)<br />
n LT-5.1g Minimize the total number <strong>of</strong> vehicle miles traveled by Sunnyvale residents<br />
and commuters. (Previously LUTE Action Strategy C3.1.7)<br />
policy lt-5.2 inTegRATe The uSe oF lAnd And The TRAnSPoRTATion<br />
SYSTeM. (Previously LUTE Policy C3.2)<br />
n LT-5.2a Allow land uses that can be supported by the planned transportation system.<br />
(Previously LUTE Action Strategy C3.2.1)<br />
n LT-5.2b Minimize driveway curb cuts and require coordinated access when<br />
appropriate. (Previously LUTE Action Strategy C3.2.2)<br />
n LT-5.2c Encourage mixed use developments that provide pedestrian scale and transit<br />
oriented services and amenities. (Previously LUTE Action Strategy C3.2.3)<br />
n LT-5.2d Continue to evaluate transportation impacts from land use proposals at a<br />
neighborhood and citywide level. (Previously LUTE Action Strategy C3.2.4)<br />
n LT-5.2e Study potential transit station mixed use development. (Previously LUTE<br />
Action Strategy C3.2.5)<br />
policy lt-5.3 oPTiMize CiTY TRAFFiC SignAl SYSTeM PeRFoRMAnCe.<br />
(Previously LUTE Policy C3.3)<br />
n LT-5.3a Maintain the signal system and respond quickly to signal breakdowns.<br />
(Previously LUTE Action Strategy C3.3.1)<br />
n LT-5.3b Monitor traffic signal control performance. (Previously LUTE Action Strategy<br />
C3.3.2)<br />
n LT-5.3c Interconnect groups <strong>of</strong> traffic signals where practicable. (Previously LUTE<br />
Action Strategy C3.3.3)<br />
3–19
<strong>City</strong> <strong>of</strong> Sunnyvale GeneRal plan – July <strong>2011</strong><br />
3–20<br />
n LT-5.3d Make appropriate hardware and s<strong>of</strong>tware improvements to traffic signals.<br />
(Previously LUTE Action Strategy C3.3.4)<br />
n LT-5.3e Make the traffic signal system responsive to all users, including bicyclists<br />
and pedestrians. (Previously LUTE Action Strategy C3.3.5)<br />
n LT-5.3f Install and remove signals when warranted and establish an implementation<br />
schedule. (Previously LUTE Action Strategy C3.3.6)<br />
policy lt-5.4 MAinTAin RoAdwAYS And TRAFFiC ConTRol deviCeS in<br />
good oPeRATing CondiTion. (Previously LUTE Policy C3.4)<br />
n LT-5.4a Inventory and monitor roadway conditions and implement a regular<br />
program <strong>of</strong> pavement maintenance. (Previously LUTE Action Strategy C3.4.1)<br />
n LT-5.4b Install permanent and painted pavement markings. (Previously LUTE Action<br />
Strategy C3.4.2)<br />
n LT-5.4c Implement programs for repair <strong>of</strong> roadbeds, barriers and lighting. (Previously<br />
LUTE Action Strategy C3.4.3)<br />
n LT-5.4d Respond quickly to sign damages and losses. (Previously LUTE Action<br />
Strategy C3.4.4)<br />
n LT-5.4e Develop and implement a program for long term transportation<br />
infrastructure replacement. (Previously LUTE Action Strategy C3.4.5)<br />
n LT-5.4f Manage on-street parking to assure safe, efficient traffic flow. (Previously<br />
LUTE Action Strategy C3.4.6)<br />
n LT-5.4g Conduct periodic analyses <strong>of</strong> roadway facilities and collision data in order<br />
to assure traffic safety. (Previously LUTE Action Strategy C3.4.7)<br />
policy lt-5.5 SuPPoRT A vARieTY oF TRAnSPoRTATion ModeS.<br />
(Previously LUTE Policy C3.5)<br />
n LT-5.5a Promote alternate modes <strong>of</strong> travel to the automobile. (Previously LUTE<br />
Action Strategy C3.5.1)<br />
n LT-5.5b Require sidewalk installation in subdivisions <strong>of</strong> land and in new,<br />
reconstructed or expanded development. (Previously LUTE Action Strategy C3.5.2)<br />
n LT-5.5c Support land uses that increase the likelihood <strong>of</strong> travel mode split. (Previously<br />
LUTE Action Strategy C3.5.3)<br />
n LT-5.5d Maximize the provision <strong>of</strong> bicycle and pedestrian facilities. (Previously<br />
LUTE Action Strategy C3.5.4)
land use and tRanspoRtation — tRanspoRtation Chapter 3<br />
n LT-5.5e Implement the <strong>City</strong> <strong>of</strong> Sunnyvale Bicycle Plan. (Previously LUTE Action<br />
Strategy C3.5.5)<br />
n LT-5.5f Support an efficient and effective paratransit service and transportation<br />
facilities for people with special transportation needs. (Previously LUTE Action<br />
Strategy C3.5.6)<br />
n LT-5.5g Ensure safe and efficient pedestrian and bicycle connections to neighborhood<br />
transit stops. (Previously LUTE Action Strategy C3.5.7)<br />
n LT-5.5h Work to improve bus service within the <strong>City</strong>, including linkages to rail.<br />
(Previously LUTE Action Strategy C3.5.8)<br />
policy lt-5.6 MiniMize exPAnSion oF The CuRRenT RoAdwAY SYSTeM,<br />
whiCh MAxiMizing oPPoRTuniTieS FoR AlTeRnATive TRAnSPoRTATion<br />
SYSTeMS And RelATed PRogRAMS. (Previously LUTE Policy C3.6)<br />
n LT-5.6a Develop clear, safe and convenient linkages between all modes <strong>of</strong> travel;<br />
including, access to transit stations and stops and connections between work, home<br />
and commercial sites. (Previously LUTE Action Strategy C3.6.1)<br />
n LT-5.6b Promote public and private transportation demand management. (Previously<br />
LUTE Action Strategy C3.6.2)<br />
policy lt-5.7 PuRSue loCAl, STATe And FedeRAl TRAnSPoRTATion<br />
Funding SouRCeS To FinAnCe CiTY TRAnSPoRTATion CAPiTAl<br />
iMPRoveMenT PRoJeCTS ConSiSTenT wiTh CiTY PRioRiTieS. (Previously<br />
LUTE Policy C3.7)<br />
n LT-5.7a Develop alternatives and recommendations for funding mechanisms to<br />
finance the planned transportation system. (Previously LUTE Action Strategy C3.7.1)<br />
n LT-5.7b Develop a funding mechanism where new and existing land uses equitably<br />
participate in transportation system improvements. (Previously LUTE Action Strategy<br />
C3.7.2)<br />
policy lt-5.8 PRovide A SAFe And CoMFoRTAble SYSTeM oF PedeSTRiAn<br />
And biCYCle PAThwAYS. (Previously Community Design Policy B.2)<br />
3–21
<strong>City</strong> <strong>of</strong> Sunnyvale GeneRal plan – July <strong>2011</strong><br />
3–22<br />
Modal Balance<br />
policy lt-5.9 APPRoPRiATe ACCoMModATionS FoR MoToR vehiCleS,<br />
biCYCleS, And PedeSTRiAnS ShAll be deTeRMined FoR CiTY STReeTS To<br />
inCReASe The uSe oF biCYCleS FoR TRAnSPoRTATion And To enhAnCe<br />
The SAFeTY And eFFiCienCY oF The oveRAll STReeT neTwoRk FoR<br />
biCYCliSTS, PedeSTRiAnS, And MoToR vehiCleS.<br />
policy lt-5.10 All ModeS oF TRAnSPoRTATion ShAll hAve SAFe<br />
ACCeSS To CiTY STReeTS.<br />
policy lt-5.11 The CiTY Should ConSideR enhAnCing STAndARdS FoR<br />
PedeSTRiAn FACiliTieS.
land use and tRanspoRtation — tRanspoRt vs. non-tRanspoRt uses Chapter 3<br />
Transport Vs. Non-Transport Uses<br />
policy lt-5.12 CiTY STReeTS ARe PubliC SPACe dediCATed To The<br />
MoveMenT oF vehiCleS, biCYCleS And PedeSTRiAnS. PRoviding<br />
SAFe ACCoMModATion FoR All TRAnSPoRTATion ModeS TAkeS<br />
PRioRiTY oveR non-TRAnSPoRT uSeS. FACiliTieS ThAT MeeT MiniMuM<br />
APPRoPRiATe SAFeTY STAndARdS FoR TRAnSPoRT uSeS ShAll be<br />
ConSideRed beFoRe non-TRAnSPoRT uSeS ARe ConSideRed.<br />
policy lt-5.13 PARking iS The SToRAge oF TRAnSPoRTATion vehiCleS<br />
And ShAll noT be ConSideRed A TRAnSPoRT uSe.<br />
policy lt-5.14 hiSToRiCAl PReCedenCe FoR STReeT SPACe dediCATed<br />
FoR PARking ShAll be A leSSeR ConSideRATion ThAn PRoviding<br />
STReeT SPACe FoR TRAnSPoRTATion uSeS when deTeRMining The<br />
APPRoPRiATe FuTuRe uSe oF STReeT SPACe.<br />
policy lt-5.15 PARking ReQuiReMenTS FoR PRivATe develoPMenT<br />
ShAll APPlY To oFF-STReeT PARking onlY.<br />
n LT-5.15a Incentives to <strong>of</strong>fset impacts <strong>of</strong> roadway changes to non-transportation<br />
users shall be considered when retr<strong>of</strong>itting roadways.<br />
3–23
<strong>City</strong> <strong>of</strong> Sunnyvale GeneRal plan – July <strong>2011</strong><br />
3–24<br />
Use Of Engineering/Planning Criteria<br />
policy lt-5.16 when deCiSionS on The ConFiguRATion oF RoAdwAY<br />
SPACe ARe MAde, STAFF ShAll PReSenT oPTionS, inCluding AT A<br />
MiniMuM An oPTion ThAT MeeTS MiniMuM SAFeTY-RelATed deSign<br />
STAndARdS FoR MoToR vehiCleS, biCYCleS And PedeSTRiAnS.<br />
policy lt-5.17 bike ReTRoFiT PRoJeCTS ShAll be evAluATed bASed on<br />
The MeRiTS oF eACh PRoJeCT in The ConTexT oF engineeRing And<br />
PlAnning CRiTeRiA.<br />
n LT-5.17a The <strong>City</strong> shall maintain engineering and planning criteria with respect to<br />
roadway geometry, collisions, travel speed, motor vehicle traffic volume, and parking<br />
supply and demand (on and <strong>of</strong>f street) to guide decisions on the provision <strong>of</strong> bike<br />
lanes.<br />
policy lt-5.18 The CiTY CounCil ShAll MAke The FinAl deCiSionS on<br />
RoAdwAY SPACe ReConFiguRATion when RoAdwAY ReConFiguRATion<br />
will ReSulT in ChAngeS To exiSTing ACCoMModATionS.<br />
policy lt-5.19 PubliC inPuT on RoAdwAY SPACe ReConFiguRATion<br />
ShAll be enCouRAged And PReSenTed indePendenTlY oF TeChniCAl<br />
engineeRing And PlAnning AnAlYSeS.
land use and tRanspoRtation — desiGn standaRds/safety Chapter 3<br />
Design Standards/Safety<br />
policy lt-5.20 iF STReeT ConFiguRATionS do noT MeeT MiniMuM<br />
deSign And SAFeTY STAndARdS FoR All uSeRS, ThAn STAndARdizATion<br />
FoR All uSeRS ShAll be PRioRiTY.<br />
policy lt-5.21 SAFeTY ConSideRATionS oF All ModeS ShAll TAke<br />
PRioRiTY oveR CAPACiTY ConSideRATionS oF AnY one Mode.<br />
n LT-5.21a For each roadway space retr<strong>of</strong>it project, a bike and pedestrian safety study<br />
shall be included in the staff report to evaluate the route in question.<br />
3–25
<strong>City</strong> <strong>of</strong> Sunnyvale GeneRal plan – July <strong>2011</strong><br />
See the land Use and<br />
transportation section <strong>of</strong> this<br />
chapter for further discussion<br />
and policies on integration <strong>of</strong><br />
land use and transportation<br />
improvements.<br />
3–26<br />
eConoMy<br />
Goal lt-6<br />
Supportive eConoMiC developMent environMent<br />
An eConoMiC develoPMenT enviRonMenT ThAT iS SuPPoRTive oF A wide<br />
vARieTY oF buSineSSeS And PRoMoTeS A STRong eConoMY wiThin exiSTing<br />
enviRonMenTAl, SoCiAl, FiSCAl And lAnd uSe ConSTRAinTS. (Previously Socioeconomic<br />
Goal 5.1B/Adopted in 1989)<br />
Goal lt-7<br />
BalanCed eConoMiC BaSe<br />
A bAlAnCed eConoMiC bASe ThAT CAn ReSiST downTuRnS oF AnY one induSTRY<br />
And PRovideS Revenue FoR CiTY SeRviCeS. (Previously Socio-economic Goal 5.1C /<br />
Adopted in 1989)<br />
Sunnyvale is home to a variety <strong>of</strong> corporate headquarters.
land use and tRanspoRtation — economy Chapter 3<br />
The economic health <strong>of</strong> Sunnyvale depends, in part, on the success <strong>of</strong> its businesses<br />
and the <strong>City</strong>’s ability to create a business-friendly environment. The <strong>City</strong> <strong>of</strong> Sunnyvale<br />
and its business owners share a common goal <strong>of</strong> increasing the <strong>City</strong>’s economic vitality<br />
by creating jobs, services and increased tax revenue for the community. To foster a<br />
supportive economic environment, the <strong>City</strong> seeks to attract new businesses, retain<br />
existing ones and provide means for businesses to expand and change as the economy<br />
changes. These programs can be achieved through a variety <strong>of</strong> land use policies and<br />
economic development activities.<br />
One <strong>of</strong> the key aspects <strong>of</strong> the <strong>City</strong>’s Economic Development program is to provide<br />
a variety <strong>of</strong> land uses and buildings to support a diverse mix <strong>of</strong> businesses, from<br />
small industrial start-ups to large corporation headquarters, from new restaurants to<br />
established retail centers and from medical <strong>of</strong>fice centers to individual pr<strong>of</strong>essional<br />
<strong>of</strong>fices. These areas are established and protected for businesses through General Plan<br />
designations, zoning districts and policies that support commercial areas, preserve<br />
affordable business spaces and protect large parcels for appropriate commercial or<br />
industrial development. In the past 10 years the <strong>City</strong> has implemented a variety <strong>of</strong><br />
zoning districts and specific plans to preserve and enhance commercial and industrial<br />
areas, including the Downtown Specific Plan (2003), the M<strong>of</strong>fett Park Specific Plan<br />
(2004), the Places <strong>of</strong> Assembly Combining District (2006) and the Precise Plan for El<br />
Camino Real (2007). All <strong>of</strong> these plans have supported businesses through preserving<br />
space for commercial and industrial areas, enhancing the design and amenities needed<br />
to support these areas and encouraging non-jobs producing uses (such as places <strong>of</strong><br />
assembly) in appropriate and non-disruptive locations.<br />
Other land use issues such as adequate housing and transportation can affect the vitality <strong>of</strong><br />
the business community. In order to support a variety <strong>of</strong> industrial land uses and jobs, the<br />
business community has supported a range <strong>of</strong> housing options and prices. The availability<br />
<strong>of</strong> housing enhances economic growth, supports businesses, reduces commuting distances<br />
and gives employees some opportunities to both work and live in a community. Increased<br />
traffic congestion and commute time can affect businesses as well. The <strong>City</strong> continues to<br />
pursue a variety <strong>of</strong> land use strategies that achieve a greater integration <strong>of</strong> land uses that<br />
shorten or reduce trips, or make alternative transportation modes more convenient. The<br />
<strong>City</strong> is also supportive <strong>of</strong> TOD programs developed by businesses.<br />
The <strong>City</strong> also seeks to support businesses by providing a supportive regulatory<br />
environment. The <strong>City</strong> has been a leader in permitting services with the One-Stop<br />
Permit Center and the online E-Permit system. The <strong>City</strong>’s Economic Development<br />
program works closely with businesses and encourages communication when new plans<br />
or policies may affect them, to ensure that their needs are recognized and included in<br />
any regulation updates.<br />
As <strong>of</strong> <strong>2011</strong>, the major economic development issues facing the <strong>City</strong> are the need to<br />
support and expand the retail services available in the <strong>City</strong>, preserve a variety <strong>of</strong> spaces<br />
for start-up businesses and balance the need to introduce mixed-use areas with the<br />
need to provide adequate commercial and industrial space for businesses. The <strong>City</strong> will<br />
continue to use a variety <strong>of</strong> strategies to sustain a dynamic local economy that attracts<br />
investment, increases the tax base, generates public revenue and creates employment<br />
opportunities.<br />
3–27
<strong>City</strong> <strong>of</strong> Sunnyvale GeneRal plan – July <strong>2011</strong><br />
3–28<br />
Policies supporting Goal LT-6<br />
(Supportive Economic Development Environment)<br />
policy lt-6.1 PRovide exiSTing buSineSSeS wiTh oPPoRTuniTieS To gRow<br />
And AdoPT new induSTRieS. (Previously Socio-economic Policy 5.1B.1)<br />
n LT-6.1a Monitor the effect <strong>of</strong> <strong>City</strong> policies on business development and consider the<br />
effects on the overall health <strong>of</strong> business within the <strong>City</strong>. (Previously Socio-economic<br />
Policy 5.1B.3)<br />
n LT-6.1b Support transportation demand management programs and other ride sharing<br />
programs countywide.(Previously Socio-economic Action Statement 5.1B.4c)<br />
n LT-6.1c Participate in partnerships with local industry/businesses in order to<br />
facilitate communication and address mutual concerns.(Previously Socio-economic<br />
Policy 5.1B.4)<br />
policy lt-6.2 PRoMoTe buSineSS oPPoRTuniTieS And buSineSS ReTenTion<br />
in SunnYvAle. (Previously Socio-economic Policy 5.1C.4)<br />
policy lt-6.3 PARTiCiPATe in RegionAl eFFoRTS To ReSPond To<br />
TRAnSPoRTATion And houSing PRobleMS CAuSed bY eConoMiC gRowTh in<br />
oRdeR To iMPRove The QuAliTY oF liFe And CReATe A beTTeR enviRonMenT<br />
FoR buSineSS To FlouRiSh. (Previously Socio-economic Policy 5.1B.4)<br />
n LT-6.3a Support land use policies to achieve a healthy relationship between the<br />
creation <strong>of</strong> new jobs and housing. (Previously Socio-economic Action Statement<br />
5.1B.4a)
policy lt-6.4 enCouRAge SuSTAinAble induSTRieS ThAT eMPhASize<br />
ReSouRCe eFFiCienCY, enviRonMenTAl ReSPonSibiliTY, And The<br />
PRevenTion oF PolluTion And wASTe. (Previously Land Use and<br />
Transportation Policy C4.4)<br />
policy lt-6.5 enCouRAge CReATion oR inSTAllATion oF PiloT<br />
PRogRAMS (SuCh AS blooM boxeS oR voiCe oveR inTeRneT PRoToCol)<br />
FoR eMeRging induSTRieS in boTh PRivATe And PubliC FACiliTieS. (NEW)<br />
policy lt-6.6 SuPPoRT A SeAMleSS develoPMenT Review PRoCeSS<br />
(dPiC) And exPAnd The one-SToP PeRMiT CenTeR. (NEW)<br />
Policies supporting Goal LT-7 (Balanced Economic Base)<br />
land use and tRanspoRtation — economy Chapter 3<br />
policy lt-7.1 MAinTAin A diveRSiTY oF CoMMeRCiAl enTeRPRiSeS<br />
And induSTRiAl uSeS To SuSTAin And bolSTeR The loCAl eConoMY.<br />
(Previously Land Use and Transportation Action Statement C4.1)<br />
n LT-7.1a Promote a variety <strong>of</strong> commercial, retail and industrial uses, including<br />
Neighborhood Shopping, General Business, Office, Clean Technology, and Industrial/<br />
Research and Development. (Previously Land Use and Transportation Action Statement<br />
C4.1.1)<br />
n LT-7.1b Ensure that rezoning industrial and commercial areas or specific sites will<br />
not significantly hurt the <strong>City</strong>’s economic base. (NEW)<br />
policy lt-7.2 enCouRAge lAnd uSeS ThAT geneRATe Revenue, while<br />
PReSeRving A bAlAnCe wiTh oTheR CiTY needS, SuCh AS houSing. (Previously<br />
Socio-economic policy 5.1C.3)<br />
3–29
<strong>City</strong> <strong>of</strong> Sunnyvale GeneRal plan – July <strong>2011</strong><br />
3–30<br />
n LT-7.2a Monitor revenues generated by different economic sectors on an on-going<br />
basis. (Socio-Economic Policy C.2)<br />
policy lt-7.3 PRoMoTe CoMMeRCiAl uSeS ThAT ReSPond To The CuRRenT<br />
And FuTuRe ReTAil SeRviCe needS oF The CoMMuniTY. (Previously Land Use<br />
and Transportation Action Statement C4.1.3)<br />
policy lt-7.4 CReATe A STRong, idenTiFiAble CenTRAl buSineSS diSTRiCT<br />
ThAT PRovideS RegionAl And CiTYwide ShoPPing oPPoRTuniTieS. (Previously<br />
Land Use and Transportation Action Statement C4.1.4)<br />
policy lt-7.5 enCouRAge The ATTRACTion And ReTenTion oF buSineSSeS<br />
ThAT PRovide A RAnge oF Job oPPoRTuniTieS. (Previously Land Use and<br />
Transportation Action Statement C4.1.5)
open SpaCe<br />
Goal lt-8<br />
adeQuate and BalanCed open SpaCe<br />
PRovide And MAinTAin AdeQuATe And bAlAnCed oPen SPACe And ReCReATion<br />
FACiliTieS FoR The beneFiT oF MAinTAining A heAlThY CoMMuniTY bASed<br />
on CoMMuniTY needS And The AbiliTY oF The CiTY To FinAnCe, ConSTRuCT,<br />
MAinTAin And oPeRATe TheSe FACiliTieS now And in The FuTuRe. (Previously<br />
Open Space and Recreation Goal A / Adopted in 2006)<br />
Goal lt-9<br />
reGional approaCh to open SpaCe<br />
land use and tRanspoRtation — open space Chapter 3<br />
A RegionAl APPRoACh To PRoviding And PReSeRving oPen SPACe And<br />
PRoviding oPen SPACe And ReCReATionAl SeRviCeS, FACiliTieS And AMeniTieS<br />
FoR The bRoAdeR CoMMuniTY. (Previously Open Space and Recreation Goal C /<br />
Adopted in 2006)<br />
The <strong>City</strong> strives to create community through its people, parks and programs. It provides<br />
a wide range <strong>of</strong> accessible, high quality open space and recreational programs and facilities<br />
to meet the desires <strong>of</strong> a diverse and changing Sunnyvale community, all which have a role<br />
in creating a healthy community and contribute to a high quality <strong>of</strong> life.<br />
As <strong>of</strong> 2006 Sunnyvale has 20 parks comprising 223 acres, including 25 acres <strong>of</strong> athletic<br />
fields and 72 acres <strong>of</strong> developed parkland at Baylands Park; nine special use facilities<br />
comprising 355 acres including the Sunnyvale Golf Course, Sunken Gardens Nine-<br />
Hole Course, Baylands Park Wetlands and the closed landfill property; and has formal<br />
agreements for use and maintenance <strong>of</strong> 118 acres <strong>of</strong> school open space, primarily the<br />
school athletic fields. Also included in the total open space acreage are 49 acres <strong>of</strong> public<br />
grounds, which include sites such as the orchards as well as the open space surrounding<br />
the Community Center and Civic Center campuses. The total open space acreage is<br />
depicted below. Overall, in 2006 Sunnyvale maintained and provided almost 5.7 acres<br />
<strong>of</strong> park and open space for every 1,000 residents in the <strong>City</strong> (See Figure 3-3, Level <strong>of</strong><br />
Service for Park Types).<br />
special Use facility — a park<br />
or recreation facility oriented<br />
toward single-purpose use<br />
(e.g. las palmas tennis Center<br />
or Baylands park).<br />
school open space —<br />
public school-owned<br />
open space lands, not<br />
including school buildings<br />
or playgrounds — that are<br />
under agreement with the<br />
<strong>City</strong> for public use and which<br />
by agreement the <strong>City</strong> is<br />
responsible for maintain.<br />
these sites consist largely <strong>of</strong><br />
school athletic fields.<br />
3–31
<strong>City</strong> <strong>of</strong> Sunnyvale GeneRal plan – July <strong>2011</strong><br />
figure 3-3:<br />
Neighborhood Planning<br />
Areas<br />
MIDDLEFIELD<br />
3–32<br />
GRANT<br />
Neighborhood Planning Areas<br />
CA-85<br />
Data Collected 2005<br />
Neighborhood Planning Area<br />
Public Park<br />
Special Use Facility<br />
Regional Trail<br />
School Field (<strong>City</strong> Managed)<br />
Public Schools<br />
Public Grounds<br />
San Antonio<br />
Park<br />
BERNARDO<br />
CA-237<br />
EL CAM<strong>IN</strong>O REAL<br />
Greenwood Manor<br />
Park<br />
De Anza<br />
Park<br />
FREMONT<br />
MARY<br />
Encinal<br />
Park<br />
REM<strong>IN</strong>GTON<br />
HOLLENBECK<br />
Serra<br />
Park<br />
STELL<strong>IN</strong>G<br />
CENTRAL EXPRESSWAY<br />
Cannery<br />
Park<br />
WASH<strong>IN</strong>GTON<br />
SERRA<br />
DE ANZA<br />
Washington<br />
Park<br />
Las Palmas<br />
Park<br />
CALIFORNIA<br />
<strong>SUNNYVALE</strong> SARATOGA<br />
<strong>SUNNYVALE</strong><br />
MATHILDA<br />
Murphy<br />
Park<br />
OLD SAN FRANCISCO<br />
Ortega Park<br />
US-280<br />
Orchard<br />
Gardens<br />
Park<br />
WEST MURPHY<br />
FAIR OAKS<br />
MAUDE<br />
Braly<br />
Park<br />
EVELYN<br />
ORTEGA<br />
Panama<br />
Park<br />
WOLFE<br />
JAVA<br />
LAKEWOOD<br />
FAIR OAKS<br />
Fair Oaks<br />
Park<br />
Victory Village Park<br />
CARIBBEAN<br />
PONDEROSA<br />
Raynor<br />
Park<br />
HOMESTEAD<br />
Ponderosa<br />
Park<br />
RAYNOR<br />
TASMAN<br />
REED<br />
Lakewood<br />
Park<br />
Baylands Park<br />
Improved Park<br />
EAST MURPHY<br />
LAWRENCE<br />
Fairwood<br />
Park<br />
ARQUES<br />
KIFER<br />
MONROE<br />
Major Streets<br />
US-101<br />
Highway/Expressway<br />
ÅTrain Station<br />
! Light Rail Station<br />
Light Rail<br />
Railroad<br />
Creek<br />
Channel<br />
0.5<br />
Miles<br />
¸<br />
GREAT AMERICA<br />
BOWERS<br />
US-101
figure 3-4: Level <strong>of</strong> Service for Park Types<br />
Park Type<br />
land use and tRanspoRtation — open space Chapter 3<br />
# <strong>of</strong> Sites<br />
# <strong>of</strong> Acres<br />
% <strong>of</strong> Total<br />
Inventory<br />
Existing LOS<br />
(acres/ 1,000<br />
population*)<br />
Parks 20 223 30 1.69<br />
School open Space 19 118 15.8 0.90<br />
Special use Areas 9 355 47.7 2.70<br />
Public grounds 5 49 6.5 0.37<br />
TOTALS 53 745 100% 5.66<br />
*Based on 2005 U.S. Census data showing the <strong>City</strong> <strong>of</strong> Sunnyvale Population is 131,700<br />
From 1992 to 2006, <strong>City</strong>-owned open space acreage increased by 2.6 acres with Plaza<br />
del Sol and Victory Village Park. Through agreements, the <strong>City</strong> has made an additional<br />
eight acres available to the public at Braly and Ponderosa schools; opened 3.45 miles <strong>of</strong><br />
the Bay Trail to public use; finished improving the John W. Christian Greenbelt; and<br />
built a 50-meter swimming pool in partnership with the Fremont Union High School<br />
District. Major physical improvements since the early 1990s also include a new 23,000<br />
square foot Senior Center, three new tennis courts and a snack bar at the Tennis Center;<br />
a skate park at Fair Oaks Park; a boardwalk at Baylands Park; and the relocation <strong>of</strong> a<br />
1918 redwood barn (Bianchi Barn) from San Jose to Orchard Heritage Park.<br />
It is generally accepted that parks best serve those living immediately adjacent to them,<br />
although today’s population is highly mobile and will readily use parks throughout<br />
the <strong>City</strong> as well as in neighboring cities and not be limited to parks within walking<br />
distance. The <strong>City</strong> has identified neighborhood planning areas to describe this concept.<br />
Neighborhood planning areas are generally bounded by traffic arterials, are served with<br />
an elementary school or park within walking distance, and have neighborhood shopping<br />
facilities within a half-mile radius. Within the <strong>City</strong> there are nine neighborhood planning<br />
areas that are used by the <strong>City</strong> as a means to describe and evaluate the <strong>City</strong>’s physical<br />
organization and distribution <strong>of</strong> parks (see Figure 3-5 for neighborhood planning area<br />
boundaries.)<br />
For the purposes <strong>of</strong> identifying areas which are relatively underserved by open space, a<br />
neighborhood approach was taken, looking at which households were within specified<br />
distances from <strong>City</strong> open space sites. Parks <strong>of</strong> three acres or less in size were considered<br />
to primarily serve those living with a quarter mile radius <strong>of</strong> the park. For larger parks, a<br />
half mile radius was used, because the larger parks generally include more amenities and<br />
can serve more people. For school open space, which represents athletic fields without<br />
amenities such as restrooms or playgrounds, a quarter mile radius was used.<br />
Once the half-mile and quarter-mile buffers are drawn around each open space site, it is<br />
possible to see which pockets <strong>of</strong> the <strong>City</strong> are not within these designated service areas. Figure<br />
3-4 depicts all park sites with their accompanying buffers, or service areas. An Open Space<br />
Initiative was suggested to evaluate areas as being currently underserved by open space and<br />
determine measures to be taken to mitigate the impact <strong>of</strong> these service gaps.<br />
3–33
<strong>City</strong> <strong>of</strong> Sunnyvale GeneRal plan – July <strong>2011</strong><br />
figure 3-5: Park and<br />
School field Service and<br />
Open Space Gap Areas<br />
3–34<br />
MIDDLEFIELD<br />
GRANT<br />
Open Space Service and Gap Areas<br />
Public Park<br />
Special Use Facility<br />
Regional Trail<br />
School Field (<strong>City</strong> Managed)<br />
Public Schools<br />
Public Grounds<br />
Open Space Service Area<br />
Underserved Residential "Gap" Area<br />
Residential Area Served by Public Park<br />
Residential Area Served by School Field<br />
Non-Residential Areas<br />
CA-85<br />
West Valley<br />
Elementary Cupertino<br />
Middle<br />
BERNARDO<br />
CA-237<br />
ACALANES/IOWA<br />
KNICKERBOCKER<br />
Cherry Chase<br />
Elementary<br />
San Antonio<br />
Park<br />
EL CAM<strong>IN</strong>O REAL<br />
FREMONT<br />
MARY<br />
Vargas<br />
Elementary<br />
Greenwood Manor<br />
Park<br />
Sunnyvale<br />
Swim Pool Middle<br />
De Anza<br />
Park<br />
Department <strong>of</strong> Parks and Recreation, 2005<br />
Homestead<br />
High<br />
Encinal<br />
Park<br />
Cumberland<br />
Elementary<br />
REM<strong>IN</strong>GTON<br />
Hollenbeck<br />
School Field<br />
HOLLENBECK<br />
Serra<br />
Park<br />
STELL<strong>IN</strong>G<br />
M<strong>of</strong>fett Field<br />
Golf Course<br />
Sunnyvale<br />
Golf Course<br />
CENTRAL EXPRESSWAY<br />
Cannery<br />
Park<br />
Washington<br />
Park<br />
Swim Pool<br />
Civic Center<br />
CALIFORNIA<br />
Tennis<br />
Center<br />
Orchard<br />
Las Palmas<br />
Park<br />
Swim Pool<br />
Fremont<br />
High<br />
Nimitz<br />
Elementary<br />
<strong>SUNNYVALE</strong> SARATOGA<br />
<strong>SUNNYVALE</strong><br />
MATHILDA<br />
Plaza Del Sol<br />
OLD SAN FRANCISCO<br />
Senior<br />
Center<br />
Community<br />
Center<br />
Stocklmeir<br />
Elementary<br />
US-280<br />
Orchard<br />
Gardens<br />
Park<br />
COLUMBIA<br />
WEST<br />
Bishop<br />
Elementary<br />
Murphy<br />
Lawn Bowling Sq<br />
Park<br />
MIDTOWN<br />
Ellis<br />
Elementary<br />
Ortega Park<br />
West Hill<br />
Swim Pool<br />
Columbia<br />
Middle<br />
MAUDE<br />
FAIR OAKS<br />
Victory Village<br />
Park<br />
EVELYN<br />
Braly Braly<br />
Park Elementary<br />
Sunnyvale<br />
Heritage<br />
Center<br />
Panama<br />
Park<br />
Recycle<br />
Hill<br />
South Hill<br />
WOLFE<br />
JAVA<br />
MORSE/TASMAN<br />
(ITR 7 & 8)<br />
Fair Oaks<br />
Park<br />
Skate Park<br />
San Francisco Bay Trail<br />
FAIR OAKS<br />
San Miguel<br />
Elementary<br />
Three Points Corners<br />
CARIBBEAN<br />
Ponderosa<br />
Ponderosa<br />
Elementary<br />
Park<br />
Sunken Gardens<br />
Golf Course<br />
Peterson<br />
Middle<br />
Raynor<br />
Multi-Purpose<br />
Center<br />
Raynor<br />
Park<br />
HOMESTEAD<br />
TASMAN<br />
John W. Christian GreenbeltJohn W. Christian Greenbelt<br />
BIRDLAND<br />
EAST EVELYN<br />
(ITR 4)<br />
Swim<br />
Lakewood<br />
Pool Lakewood<br />
Elementary Park<br />
SAN MIGUEL<br />
EAST<br />
REED<br />
Laurelwood<br />
Elementary<br />
Baylands Park<br />
Improved Park<br />
LAWRENCE<br />
SOUTHEAST<br />
CORNER<br />
Wetlands<br />
Fairwood Elementary<br />
Fairwood<br />
Park<br />
LAKEWOOD<br />
SOUTH<br />
LAKESIDE<br />
SPECIFIC <strong>PLAN</strong><br />
ARQUES<br />
KIFER<br />
MONROE<br />
Wilcox<br />
High<br />
Major Streets<br />
US-101<br />
Highway/Expressway<br />
Å Train Station<br />
! Light Rail Station<br />
Light Rail<br />
Railroad<br />
Creek<br />
Channel<br />
0.5<br />
Miles<br />
¸<br />
GREAT AMERICA<br />
BOWERS<br />
US-101
land use and tRanspoRtation — open space Chapter 3<br />
In 1990, the National Recreation and Park Association (NRPA) developed standards or<br />
guidelines which recommended 4-6 acres <strong>of</strong> open space per 1000 population. Although it<br />
would be helpful to have a standard for the amount and kind <strong>of</strong> open space appropriate<br />
for the Sunnyvale community, the NRPA has since acknowledged the difficulty in setting<br />
standards that would be applicable to all communities, given each community’s unique<br />
characteristics. The 1990 NRPA standard is, however, still widely used as a starting point<br />
<strong>of</strong> discussion. At 5.7 acres per 1000, Sunnyvale falls well within that guideline.<br />
The public has expressed interest in increasing most park services, programs, resources<br />
and facilities, with the most emphasis on additional open space or enhancement <strong>of</strong><br />
existing facilities. Much <strong>of</strong> the stated demand is for sports/athletic fields; however,<br />
there is a general sense that additional open space is increasingly important as the <strong>City</strong>’s<br />
population increases.<br />
Sunnyvale is experiencing a number <strong>of</strong> trends related to open space:<br />
n Requiring residential developments to include buildings for community gatherings/<br />
meetings.<br />
n Businesses are increasingly using open space during the work day for the benefit <strong>of</strong><br />
their employees, resulting in a large increase in the use <strong>of</strong> picnic sites and athletic<br />
fields near large businesses. The daytime population for Sunnyvale was estimated at<br />
149,923 in 2000 by the US Census Bureau, almost 20,000 more than the nighttime<br />
population. Staff has noted the phenomenon particularly in the northern part <strong>of</strong> the<br />
<strong>City</strong>. Encinal Park, Lakewood Park, Sunnyvale Baylands Parks and Fair Oaks Park<br />
each get heavy use during the day from nearby day-time only residents.<br />
n New residential development is planned in several locations throughout <strong>City</strong>. Figures<br />
3-4 and 3-5 show areas where increased residential growth can be expected. Seven<br />
areas are noted in the table below, along with estimates <strong>of</strong> the magnitude for which<br />
growth is being planned. Evelyn/Wolfe, Lakeside Specific Plan, and Tasman/Morse<br />
areas are also identified as being underserved by open space (see Figure 3-6, Projected<br />
Residential Growth). The underserved nature <strong>of</strong> these areas can be exacerbated by<br />
the planned residential growth.<br />
3–35
<strong>City</strong> <strong>of</strong> Sunnyvale GeneRal plan – July <strong>2011</strong><br />
figure 3-6: future<br />
Residential Growth<br />
Areas<br />
3–36<br />
MIDDLEFIELD<br />
GRANT<br />
Residential Growth Areas<br />
Low to Medium Density Residential Growth<br />
High to Very High Density Residential Growth<br />
Neighborhood Planning Area<br />
Public Park<br />
Special Use Facility<br />
Regional Trail<br />
School Field (<strong>City</strong> Managed)<br />
Public Grounds<br />
CA-85<br />
BERNARDO<br />
CA-237<br />
EL CAM<strong>IN</strong>O REAL<br />
De Anza<br />
Park<br />
FREMONT<br />
San Antonio<br />
Park<br />
WASH<strong>IN</strong>GTON<br />
Greenwood Manor<br />
Park<br />
SERRA<br />
MARY<br />
Department <strong>of</strong> Parks and Recreation, 2005<br />
DE ANZA<br />
Encinal<br />
Park<br />
REM<strong>IN</strong>GTON<br />
HOLLENBECK<br />
STELL<strong>IN</strong>G<br />
CENTRAL EXPRESSWAY<br />
Cannery<br />
Park<br />
Washington<br />
Park<br />
Serra<br />
Park<br />
Civic Center<br />
CALIFORNIA<br />
Orchard<br />
Las Palmas<br />
Park<br />
<strong>SUNNYVALE</strong> SARATOGA<br />
<strong>SUNNYVALE</strong><br />
MATHILDA<br />
WEST MURPHY<br />
DOWNTOWN<br />
OLD SAN FRANCISCO<br />
Senior<br />
Center<br />
Community<br />
Center<br />
US-280<br />
Orchard<br />
Gardens<br />
Park<br />
FAIR OAKS<br />
Ortega Park<br />
MAUDE<br />
Murphy<br />
Park<br />
NORTHRUP<br />
GRUMMAN<br />
(ITR 5)<br />
ORTEGA<br />
Braly<br />
Park<br />
EVELYN<br />
Sunnyvale<br />
Heritage<br />
Center<br />
Panama<br />
Park<br />
WOLFE<br />
JAVA<br />
LAKEWOOD<br />
FAIR OAKS<br />
Fair Oaks<br />
Park<br />
Victory Village Park<br />
PONDEROSA<br />
RAYNOR<br />
CARIBBEAN<br />
MORSE/TASMAN<br />
(ITR 7 & 8)<br />
ARQUES/<br />
FAIR OAKS<br />
(ITR 6a)<br />
(ITR 4a)<br />
Ponderosa<br />
Park<br />
Raynor<br />
Park<br />
HOMESTEAD<br />
TASMAN<br />
EAST MURPHY<br />
REED<br />
Baylands Park<br />
Improved Park<br />
Lakewood<br />
Park<br />
EVELYN/WOLFE (ITR 4b)<br />
LAWRENCE<br />
TIMBERP<strong>IN</strong>E/<br />
LILY<br />
Fairwood<br />
Park<br />
LAKESIDE<br />
SPECIFIC <strong>PLAN</strong><br />
ARQUES<br />
KIFER<br />
MONROE<br />
Major Streets<br />
US-101<br />
Highway/Expressway<br />
ÅTrain Station<br />
! Light Rail Station<br />
Light Rail<br />
Railroad<br />
Creek<br />
Channel<br />
0.5<br />
Miles<br />
GREAT AMERICA<br />
BOWERS<br />
¸<br />
US-101
figure 3-7: Projected Residential Growth<br />
Area <strong>of</strong> Residential Growth Neighborhood<br />
Planning Area<br />
Within ½ Mile <strong>of</strong><br />
Park?<br />
Projected Build<br />
Out/Increase in<br />
Population<br />
Timberpine/lily Ponderosa Ponderosa Park 320<br />
evelyn/wolfe<br />
(includes iTR 4a and 4b)<br />
Ponderosa no 5,680<br />
Arques/Fair oaks (iTR 6a) east Murphy Fair oaks Park 950<br />
lakeside Specific Plan east Murphy no 1,416<br />
downtown washington Split:<br />
½ washington Park<br />
1 /3 Murphy Park<br />
1 /6 las Palmas Park<br />
Tasman/Morse<br />
(includes iTR 7 and 8)<br />
3,900<br />
lakewood no 7,435<br />
northrup grumman (iTR 5) west Murphy Split:<br />
½ Murphy Park<br />
¼ Fair oaks Park<br />
¼ victory village Park<br />
3,000<br />
In 2006, the <strong>City</strong> developed Key Initiatives to respond to demands for increased open<br />
space and the areas identified as having “service gaps” and being underserved by current<br />
open space <strong>of</strong>ferings. These Key Initiatives were further evaluated in the Parks <strong>of</strong> the<br />
Future Study, which was completed in 2009. The 2006 Key Initiatives and the 2009<br />
Parks <strong>of</strong> the Future study recommendations are described as follows:<br />
n Key Initiative #1 — Evaluate how well the following <strong>City</strong>-owned sites meet the<br />
open space and recreation priorities and determine which should be pursued for<br />
development as public open space;<br />
• Murphy Parksite Housing on Jackson Avenue<br />
• Orchard Gardens Parksite Housing on Garner Avenue<br />
• Fair Oaks Industrial Complex<br />
land use and tRanspoRtation — open space Chapter 3<br />
In 2009, the <strong>City</strong> Council directed staff to sell the Orchard Gardens and Murphy Park<br />
park-site housing at a future time when the market improves and use the proceeds<br />
from the sale <strong>of</strong> the properties to fund other park and open space priorities. The Fair<br />
Oaks Industrial Complex, also known as the Morse Avenue park site, was identified<br />
as high priority for development as a Neighborhood Park. (In 2010 the planning and<br />
design for Morse Avenue Park was started, with an expect completion date in 2013.)<br />
3–37
<strong>City</strong> <strong>of</strong> Sunnyvale GeneRal plan – July <strong>2011</strong><br />
3–38<br />
n Key Initiative #2 — Evaluate areas identified as being currently underserved by open<br />
space and determine measures to be taken to mitigate the impact <strong>of</strong> these service gaps.<br />
In 2009, the <strong>City</strong> Council adopted as priorities for acquisition and development <strong>of</strong><br />
new open space the following areas:<br />
• Morse/Tasman (includes ITR 7 & 8)<br />
• East Evelyn (includes ITR 4)<br />
• Acalanes/Iowa (Between western border <strong>of</strong> Sunnyvale and Mary Avenue,<br />
between El Camino and Evelyn)<br />
• Downtown<br />
• Community Center area<br />
• East Sunnyvale ITR<br />
The Council also directed staff to:<br />
• Actively identify land for acquisition and development, with particular<br />
emphasis on areas identified as priorities for new open space<br />
• Revisit the <strong>City</strong>/School Use Agreements and look for opportunities to<br />
expand and/or redefine the existing partnerships to best meet the <strong>City</strong>’s<br />
needs.[This effort was underway in 2010 and will be on-going.]<br />
• Work together to develop a long-term plan for the recreational use <strong>of</strong> the<br />
West Hill, Recycle Hill and South Hill portions <strong>of</strong> the Sunnyvale Landfill.<br />
• Explore the potential for new <strong>of</strong>f-street trails and coordination <strong>of</strong> on-street<br />
bike connections.<br />
n Key Initiative #3 — Determine whether or not to continue agreement with Santa<br />
Clara County for operation <strong>of</strong> Sunnyvale Baylands Park past <strong>2011</strong> (agreement was to<br />
expire in <strong>2011</strong> and the notice <strong>of</strong> intent was required by December 2008).<br />
In December 2009 this agreement was renewed for an additional 25 years. It now<br />
expires in 2036.<br />
n Key Initiative #4 — Evaluate how the Raynor Activity Center meets open space and<br />
recreation priorities and determine what should be done with the site (e.g. keep for<br />
use as recreation facility; tear down and use for civic, non-recreation use; sell).<br />
In June 2010, <strong>City</strong> Council declared that the Raynor Activity Center was no longer<br />
needed for public purposes and available for long-term lease. The <strong>City</strong> anticipates<br />
making a determination on the future use <strong>of</strong> the Raynor Activity Center in <strong>2011</strong>.<br />
n Key Initiative #5 - Consider revisions to Sunnyvale Municipal Code (e.g. evaluate<br />
whether to include commercial development in park dedication or mitigation;<br />
consider changes to the open space acreage dedication amount.)
land use and tRanspoRtation — open space Chapter 3<br />
In 2009, the <strong>City</strong> Council adopted as a target to maintain an open space level <strong>of</strong><br />
service <strong>of</strong> 5.34 acres per 1,000 residents. Council also directed staff to prepare an<br />
amendment to Sunnyvale Municipal Code Chapter 18.10 and Chapter 19.74 relating<br />
to park dedication and in-lieu fees to change the facility standard to 3.0 acres per<br />
1,000 population from its current standard <strong>of</strong> 1.25 acres per 1,000 population, in<br />
accordance with Fee Mitigation Act Requirements. This was completed on November<br />
24, 2009 when Council raised the park facility standard from 1.25 acres per 1,000<br />
residents to 3.0 acres per 1,000 residents over a three year period. In addition, the<br />
Council directed staff to further explore the feasibility <strong>of</strong> establishing expanded or<br />
modified Development Impact Fees under the Mitigation Fee Act.<br />
Policies supporting Goal LT-8 (Adequate and Balanced Open Space)<br />
policy lt-8.1 Follow MAnAgeMenT And PRevenTive MAinTenAnCe<br />
STRATegieS To exTend The uSAble liFe oF oPen SPACeS And<br />
ReCReATion FACiliTieS, SuCh AS PlAnning FoR And iMPleMenTing<br />
“non-uSe TiMeS” FoR oPen SPACe And FACiliTieS in oRdeR To ASSuRe<br />
AdeQuATe MAinTenAnCe And RegeneRATion TiMe. (Previously Open<br />
Space and Recreation Policy 2.2.A.1)<br />
policy lt-8.2 AdoPT MAnAgeMenT, MAinTenAnCe And develoPMenT<br />
PRACTiCeS ThAT MiniMize negATive iMPACTS To The nATuRAl<br />
enviRonMenT, SuCh AS SuPPoRTing And enFoRCing The inTegRATed<br />
PeST MAnAgeMenT SYSTeM; And lAndSCAPing in wAYS whiCh MiniMize<br />
The need FoR wATeR. (Previously Open Space and Recreation Policy 2.2.A.2)<br />
policy lt-8.3 PuRSue The ACQuiSiTion oF APPRoPRiATe FedeRAl lAndS<br />
CuRRenTlY loCATed AT The FoRMeR MoFFeTT nAvAl AiR STATion.<br />
(Previously Open Space and Recreation Policy 2.2.A.3)<br />
3–39
<strong>City</strong> <strong>of</strong> Sunnyvale GeneRal plan – July <strong>2011</strong><br />
3–40<br />
policy lt-8.4 MAinTAin exiSTing PARk And oPen SPACe TRee<br />
invenToRY ThRough The RePlACeMenT oF TReeS wiTh An eQuAl oR<br />
gReATeR nuMbeR oF TReeS when TReeS ARe ReMoved due To diSeASe,<br />
PARk develoPMenT oR oTheR ReASonS. (Previously Open Space and<br />
Recreation Policy 2.2.A.4)<br />
policy lt-8.5 MAinTAin PARk And oPen SPACe TRee invenToRY on<br />
A SYSTeM wide bASiS RATheR ThAn A SiTe-bY-SiTe bASiS wiTh An<br />
undeRSTAnding ThAT TheRe iS no Single oPTiMuM nuMbeR oF TReeS<br />
FoR A PARTiCulAR SiTe. (Previously Open Space and Recreation Policy 2.2.A.5)<br />
policy lt-8.6 MAinTAin A woRking FRuiT oRChARd ThRoughouT<br />
The lARgeST PoRTion oF oRChARd heRiTAge PARk FoR AS long AS<br />
PRACTiCAl. (Previously Open Space and Recreation Policy 2.2.A.6)<br />
policy lt-8.7 ConduCT A CoST/beneFiT AnAlYSiS To deTeRMine<br />
wheTheR The geneRAl CoMMuniTY would be well-SeRved duRing<br />
non-SChool houRS bY CAPiTAl iMPRoveMenTS To SChool-owned<br />
oPen SPACe And/oR ReCReATionAl FACiliTieS. The CoST/beneFiT<br />
AnAlYSiS Should TAke inTo ACCounT ongoing MAinTenAnCe CoSTS<br />
And ReSPonSibiliTieS. when iT iS deTeRMined ThAT The CoMMuniTY<br />
would be well SeRved bY The CAPiTAl iMPRoveMenT, The CiTY will<br />
ConSideR Funding A ShARe oF The CoSTS oF ThoSe iMPRoveMenTS<br />
PRoPoRTionATe To The CiTY’S uSe. (See AlSo FiSCAl MAnAgeMenT<br />
Sub-eleMenT FoR FiSCAl PoliCieS.) (Previously Open Space and Recreation<br />
Policy 2.2.A.7)
land use and tRanspoRtation — open space Chapter 3<br />
policy lt-8.8 SuPPoRT The ACQuiSiTion oR JoinT uSe ThRough<br />
AgReeMenTS wiTh PARTneRS oF SuiTAble SiTeS To enhAnCe<br />
SunnYvAle’S oPen SPACeS And ReCReATion FACiliTieS bASed on<br />
CoMMuniTY need And ThRough SuCh STRATegieS AS develoPMenT<br />
oF eASeMenTS And RighT-oF-wAYS FoR oPen SPACe uSe, ConveRSion<br />
oF SiTeS To oPen SPACe FRoM develoPed uSe oF lAnd And<br />
lAndbAnking. (Previously Open Space and Recreation Policy 2.2.A.8)<br />
policy lt-8.9 ReFRAin FRoM engAging in The develoPMenT oF oPen<br />
SPACe And/oR ReCReATionAl FACiliTieS wiThouT PRioR ASSuRAnCe<br />
ThAT ongoing MAinTenAnCe needS will be AddReSSed. (Previously<br />
Open Space and Recreation Policy 2.2.A.9)<br />
policy lt-8.10 FACiliTATe And enCouRAge PedeSTRiAn TRAFFiC in<br />
PubliC ReCReATionAl oPen SPACeS And uTilize The SAnTA ClARA<br />
vAlleY TRAnSPoRTATion AuThoRiTY’S PedeSTRiAn TeChniCAl deSign<br />
guidelineS wheneveR APPRoPRiATe And FeASible. (Previously Open<br />
Space and Recreation Policy 2.2.A.10)<br />
policy lt-8.11 SuPPoRT The ACQuiSiTion oF exiSTing oPen SPACe<br />
wiThin The CiTY liMiTS AS long AS FinAnCiAllY FeASible. (Previously<br />
Open Space and Recreation Policy 2.2.A.11)<br />
policy lt-8.12 uTilize deSign And develoPMenT guidelineS FoR All<br />
PARk TYPeS wiThin The CiTY’S oPen SPACe SYSTeM.<br />
3–41
<strong>City</strong> <strong>of</strong> Sunnyvale GeneRal plan – July <strong>2011</strong><br />
3–42<br />
policy lt-8.13 MiTigATe AS FeASible The oPen SPACe need in AReAS<br />
idenTiFied AS undeRSeRved ThRough The ACQuiSiTion oF new<br />
PARklAnd And/oR The AddiTion oF AMeniTieS in oRdeR To bRing<br />
SiTeS in line wiTh deSign And develoPMenT guidelineS.<br />
policy lt-8.14 in APPlYing The PARk dediCATion ReQuiReMenTS FoR<br />
new develoPMenT, PlACe A PRioRiTY on ACQuiRing lAnd oveR in-lieu<br />
PAYMenT, PARTiCulARlY when The develoPMenT iS in AReAS idenTiFied<br />
AS undeRSeRved And/oR when The lAnd iS oF SuFFiCienT Size oR CAn<br />
be CoMbined wiTh oTheR lAnd dediCATion To FoRM lARgeR Mini<br />
PARkS oR neighboRhood PARkS.<br />
policy lt-8.15 PlACe A PRioRiTY on enSuRing ThAT eACh SiTe hAS The<br />
MiniMuM ReSouRCeS idenTiFied in The deSign guidelineS FoR iTS PARk<br />
ClASSiFiCATion beFoRe Adding new AMeniTieS oveR And Above The<br />
MiniMuM ReQuiRed ReSouRCeS FoR The PARk ClASSiFiCATion.<br />
policy lt-8.16 iF AMeniTieS ARe no longeR needed (e.g., due To FiSCAl<br />
ConSTRAinTS, enviRonMenTAl ReASonS, ChAnge in CoMMuniTY<br />
needS) give STRong ConSideRATion To RedeSigning The AMeniTY To<br />
SeRve CoMMuniTY needS.
land use and tRanspoRtation — open space Chapter 3<br />
Policies supporting Goal LT-9 (Regional Approach to Open Space)<br />
policy lt-9.1 SuPPoRT ACTiviTieS And legiSlATion ThAT will PRovide<br />
AddiTionAl loCAl, CounTY And RegionAl PARk ACQuiSiTion,<br />
develoPMenT And MAinTenAnCe And ReCReATionAl oPPoRTuniTieS.<br />
(Previously Open Space and Recreation Policy 2.2.C.1)<br />
policy lt-9.2 SuPPoRT PubliC And PRivATe eFFoRTS in And ARound<br />
SunnYvAle To ACQuiRe, develoP And MAinTAin oPen SPACe And<br />
ReCReATion FACiliTieS And SeRviCeS FoR PubliC uSe. (Previously Open<br />
Space and Recreation Policy 2.2.C.2)<br />
policy lt-9.3 enCouRAge SChool diSTRiCTS To MAke AvAilAble SChool<br />
SiTeS in And ARound SunnYvAle FoR CoMMuniTY oPen SPACe And<br />
ReCReATion PRogRAMS. (Previously Open Space and Recreation Policy 2.2.C.3)<br />
policy lt-9.4 SuPPoRT A RegionAl TRAil SYSTeM bY CooRdinATing<br />
wiTh AdJACenT JuRiSdiCTionS To FACiliTATe TRAil ConneCTionS<br />
wheReveR PoSSible. (See AlSo CiTY oF SunnYvAle biCYCle PlAn.)<br />
(Previously Open Space and Recreation Policy 2.2.C.4)<br />
3–43
chapteR 4<br />
community<br />
chaRacteR<br />
The Community Character Chapter contains information on the<br />
following topics:<br />
n Design — building and street design, including policies on gateways,<br />
public art, special districts and public facilities.<br />
n Heritage Preservation — protection <strong>of</strong> heritage structures and<br />
natural features, including programs to increase knowledge <strong>of</strong><br />
Sunnyvale’s heritage.<br />
n Library — existing conditions and future issues with expansion <strong>of</strong><br />
the library and continuous improvement <strong>of</strong> the library collection.<br />
n Arts — facilities for the encouragement <strong>of</strong> arts programming<br />
and activities.<br />
n Recreation — issues and trends related to quality recreation<br />
programming.
deSiGn<br />
Goal CC-1<br />
diStinGuiShed <strong>City</strong> iMaGe<br />
PRoMoTe SunnYvAle’S iMAge bY MAinTAining, enhAnCing And CReATing<br />
PhYSiCAl FeATuReS, inCluding FunCTionAl And deCoRATive ART, whiCh<br />
diSTinguiSh SunnYvAle FRoM SuRRounding CoMMuniTieS And bY PReSeRving<br />
hiSToRiC buildingS, SPeCiAl diSTRiCTS And ReSidenTiAl neighboRhoodS<br />
whiCh MAke The CiTY uniQue. (Previously Community Design Goal A / Adopted<br />
in 1990 and Arts Goal E / Adopted in 1995)<br />
Good design can bring qualities to the built environment, such as identity, comfort,<br />
beauty and fun. Good design makes the difference between a strong, positive image<br />
for Sunnyvale and a vague one; between tree-lined neighborhood streets and bare<br />
asphalt; between architecture that inspires and non-descript buildings; between the<br />
playful sculpture in front <strong>of</strong> the Library and an empty bench. Sunnyvale is fortunate to<br />
have a strong economy which has created an attractive community along with future<br />
opportunities to improve. Improving the built environment may not require many<br />
grand gestures, but a collection <strong>of</strong> smaller actions.<br />
A city’s visual image is a complex relationship between private and public development<br />
patterns and the natural features <strong>of</strong> the land. Ideally, this visual image should match<br />
the values and ambitions <strong>of</strong> a community. A city should create a place that residents<br />
can identify with and visitors can understand. A strong, clear visual image is like a firm<br />
handshake. It is a satisfying encounter.<br />
There are many different factors that contribute to the <strong>City</strong>’s image. These factors<br />
include defined boundaries and gateways, distinctive landmarks and districts and<br />
publicly visible art. Enhancing these features will help articulate an image <strong>of</strong> Sunnyvale<br />
as a complete <strong>City</strong> and a special place to live and work.<br />
Boundaries and Gateways<br />
community chaRacteR — desiGn Chapter 4<br />
A defined boundary and gateway helps orient travelers and also creates a stronger identity<br />
for the <strong>City</strong>. Gateways create a precedent for design standards that follow along the major<br />
<strong>City</strong> thoroughfares. It is important to make these locations distinctive and attractive.<br />
Sunnyvale is a modern metropolitan area where the boundaries <strong>of</strong> one city blend into<br />
the next. There are few visual clues to distinguish Sunnyvale from adjoining cities. This<br />
sprawl creates confusion and lack <strong>of</strong> orientation in the physical environment. Currently,<br />
there are few <strong>City</strong> monument signs or other distinctive features at these gateways to<br />
mark the municipal boundary and welcome people to Sunnyvale.<br />
see Goal lt-2 (an attractive<br />
community) for further<br />
discussion and policies<br />
relating to enhancing<br />
neighborhoods and districts.<br />
Gateways — specific places<br />
along a boundary where<br />
people enter and leave an<br />
area.<br />
4–3
<strong>City</strong> <strong>of</strong> Sunnyvale GeneRal plan – July <strong>2011</strong><br />
see Goal cc-2 (attractive<br />
Street environment) for<br />
discussion and policies<br />
regarding roadway features.<br />
See policy CC-1.8 regarding<br />
art in private development<br />
information and policies.<br />
4–4<br />
Roadways and natural features <strong>of</strong>fer the best opportunities to define and clarify the<br />
<strong>City</strong>’s edges. Distinctive landscaping, signage and medians can be used to highlight<br />
boundaries and gateways. Unique development or prominent artwork can be also<br />
encouraged at gateway and boundary locations. The <strong>City</strong> <strong>of</strong> Sunnyvale requires artworks<br />
in conjunction with new development at gateways, as described in the Sunnyvale<br />
Municipal Code.<br />
The <strong>City</strong>’s boundaries and gateway locations are shown on Figure 4-1, <strong>City</strong> Form Map.<br />
The following general locations are some <strong>of</strong> the best opportunities for possible gateway<br />
improvements:<br />
n S.R. 237 and U.S. 101<br />
n Mathilda Avenue at U.S. 101<br />
n Sunnyvale-Saratoga Road at Homestead Road<br />
n Lawrence Expressway at U.S. 101<br />
n Lawrence Expressway at S.R. 237<br />
n East and west ends <strong>of</strong> El Camino Real<br />
In addition, the <strong>City</strong>’s Baylands Park at S.R. 237 and Caribbean Drive celebrates<br />
the unique natural environment <strong>of</strong> San Francisco Bay. This park protects, enhances<br />
and interprets the natural wetlands <strong>of</strong> the Bay, while providing outdoor recreational<br />
opportunities and facilities. This park contributes to an appealing scenic edge on the<br />
northern <strong>City</strong> limits.<br />
policy cc-1.1 idenTiFY The boundARieS oF The CiTY wiTh ATTRACTive<br />
And diSTinCTive FeATuReS. (Previously Community Design Policy A.1)<br />
n CC-1.1a Encourage unique and uniform roadway landscaping and, where possible,<br />
median improvements to distinguish city boundaries. (Previously Community Design<br />
Action Statement A.1.a.)<br />
n CC-1.1b Consider studying ways to minimize the barrier impact <strong>of</strong> highways and<br />
expressways by developing design approaches which relate these roadways to the rest<br />
<strong>of</strong> the community. (Previously Community Design Action Statement A.1.c.)<br />
n CC-1.1c Continue to develop a comprehensive gateway improvement program to<br />
select major gateways for improvements such as special landscaping, signage, visitor<br />
information centers patterned pavement, monuments or artwork and unique private<br />
development standards. (Previously Community Design Action Statement A.1.d)
n CC-1.1d Consider installing new <strong>City</strong> <strong>of</strong> Sunnyvale monument signs at major<br />
gateways into Sunnyvale and developing a comprehensive sign program to identify<br />
major attractions within the <strong>City</strong>. (Previously Community Design Action Statement<br />
A.1.e)<br />
n CC-1.1e Locate <strong>City</strong> <strong>of</strong> Sunnyvale signs in attractive surroundings and, whenever<br />
possible, in medians with distinctive landscaping. (Previously Community Design<br />
Action Statement A.1.f.)<br />
n CC-1.1f Maintain a compatible scale with the roadway when designing gateway<br />
improvements. (Previously Community Design Action Statement A.1.h)<br />
policy cc-1.2 ConTinue To enhAnCe The viSibiliTY, ACCeSSibiliTY And<br />
uSe oF The SAn FRAnCiSCo bAY on The CiTY’S noRTheRn boundARY.<br />
(Previously Community Design Action Statement A.1.b)<br />
Special Districts and Residential Neighborhoods<br />
community chaRacteR — desiGn Chapter 4<br />
Districts are special areas within a city which have a unique and unified character.<br />
Residential neighborhoods are vitally important to the everyday quality <strong>of</strong> life for<br />
Sunnyvale residents. Residential neighborhoods are also a major part <strong>of</strong> how the <strong>City</strong><br />
looks, since more than one-third <strong>of</strong> the <strong>City</strong> is covered by single family and multifamily<br />
neighborhoods. Defined neighborhoods and districts can be as beneficial to a<br />
neighborhood as it is to the <strong>City</strong>. Being able to identify where you live by neighborhood<br />
or district is not only convenient, it promotes a sense <strong>of</strong> place and shared responsibility.<br />
Memorable districts and neighborhoods create memorable cities.<br />
Sunnyvale has three basic types <strong>of</strong> districts: residential, commercial and industrial.<br />
See the sidebar for a list <strong>of</strong> some <strong>of</strong> the districts in Sunnyvale. Most districts share<br />
a predominantly homogenous form <strong>of</strong> horizontal structures and relatively similar<br />
building styles. Some districts and neighborhoods are more disrupted by change than<br />
others. Incompatible development has a damaging impact on the cohesiveness <strong>of</strong> the<br />
area and erodes its special quality.<br />
Special area and design guidelines are useful tools to enhance or create unique districts<br />
and preserve neighborhoods. A Specific Plan has development standards like a zoning<br />
district, but also includes design features which strengthen the district identity. Special<br />
area plans can identify appropriate uses, set regulations for building height, setbacks or<br />
floor area ratios and establish landscaping standards, architectural design standards,<br />
unique street lighting, public plazas and special signage. Design guidelines are more<br />
limited and would generally not affect land use or building regulations. Sunnyvale<br />
currently has a variety <strong>of</strong> special area plans with design guidelines or stand-alone design<br />
guidelines to assist in maintaining district character.<br />
list <strong>of</strong> Districts<br />
n downtown<br />
n taaffe-frances heritage<br />
district<br />
n el Camino real<br />
n M<strong>of</strong>fett park<br />
n tasman Crossings<br />
see Goal cc-3 (Well-designed<br />
Sites and Buildings) for<br />
a discussion <strong>of</strong> private<br />
development and associated<br />
design guidelines.<br />
4–5
<strong>City</strong> <strong>of</strong> Sunnyvale GeneRal plan – July <strong>2011</strong><br />
figure 4-1:<br />
<strong>City</strong> form Map<br />
4–6<br />
MIDDLEFIELD<br />
GRANT<br />
CENTRAL<br />
<strong>City</strong> Form<br />
¢ Visual Landmark<br />
CA-85<br />
<strong>City</strong> Gateway<br />
Circulation Node<br />
Edge<br />
Barriers<br />
BERNARDO<br />
CA-237<br />
FREMONT<br />
MARY<br />
Community Development Department, 1990<br />
M<strong>of</strong>fett Field<br />
REM<strong>IN</strong>GTON<br />
CENTRAL EXPRESSWAY<br />
Libby Can Tower<br />
HOLLENBECK<br />
STELL<strong>IN</strong>G<br />
<strong>City</strong> Hall<br />
<strong>SUNNYVALE</strong> SARATOGA<br />
Lockheed<br />
MATHILDA<br />
Murphy Ave.<br />
Fremont High School<br />
<strong>SUNNYVALE</strong><br />
OLD SAN FRANCISCO<br />
US-280<br />
CALIFORNIA<br />
MAUDE<br />
EL CAM<strong>IN</strong>O REAL<br />
FAIR OAKS<br />
WOLFE<br />
JAVA<br />
FAIR OAKS<br />
Water Tower<br />
EVELYN<br />
CARIBBEAN<br />
TASMAN<br />
REED<br />
HOMESTEAD<br />
LAWRENCE<br />
US-101<br />
ARQUES<br />
KIFER<br />
MONROE<br />
Major Streets<br />
GREAT AMERICA<br />
BOWERS<br />
Highway/Expressway<br />
Å Train Station<br />
! Light Rail Station<br />
Light Rail<br />
Railroad<br />
Creek<br />
Channel<br />
0.5<br />
Miles<br />
¸<br />
US-101
policy cc-1.3 enSuRe ThAT new develoPMenT iS CoMPATible wiTh The<br />
ChARACTeR oF SPeCiAl diSTRiCTS And ReSidenTiAl neighboRhoodS.<br />
(Previously Community Design Policy A.2)<br />
policy cc-1.4 SuPPoRT MeASuReS whiCh enhAnCe The idenTiTY oF SPeCiAl<br />
diSTRiCTS And ReSidenTiAl neighboRhoodS To CReATe MoRe vARieTY in<br />
The PhYSiCAl enviRonMenT. (Previously Community Design Policy A.3)<br />
n CC-1.4a Encourage diversity and develop programs to emphasize the unique features<br />
<strong>of</strong> special districts and neighborhoods. (Previously Community Design Action<br />
Statement A.3.a)<br />
policy cc-1.5 enCouRAge ReSidenTS To MAinTAin CleAn<br />
neighboRhoodS bY PRevenTing unSighTlY ACCuMulATionS oF<br />
diSCARded MATeRiAlS And illegAl duMPing oF MuniCiPAl Solid<br />
wASTe. (Previously Solid Waste Goal 3.2c)<br />
policy cc-1.6 MAinTAin CiTY neighboRhoodS AS SAFe, heAlThY<br />
PlACeS To live. (Previously Socio-Economic Policy A.5)<br />
community chaRacteR — desiGn Chapter 4<br />
policy cc-1.7 enCouRAge neighboRhood PATTeRnS ThAT enCouRAge<br />
SoCiAl inTeRACTion And Avoid iSolATion. (Previously Socio-Economic<br />
Policy A.6)<br />
see Goal sn-3 (safe and<br />
secure environment) for a<br />
discussion and policies related<br />
to safety and police services.<br />
4–7
<strong>City</strong> <strong>of</strong> Sunnyvale GeneRal plan – July <strong>2011</strong><br />
4–8<br />
Publicly Visible Art<br />
The cultural identity <strong>of</strong> a community is enhanced by the inclusion <strong>of</strong> public art in physical<br />
boundaries, gateways, landmarks, open spaces and buildings. Public art distinguishes<br />
communities from one another and adds human dimension to both outdoor and indoor<br />
environments by adding color and movement while defining “a sense <strong>of</strong> place.” There<br />
are three techniques to use to incorporate art into the community: a Master Plan for<br />
Public Art, art in private development and integration <strong>of</strong> art into capital projects.<br />
In 1983, a 10-Year Master Plan for Public Art was developed to purchase commissioned<br />
artwork for permanent display on public properties. The plan identified public locations<br />
(both indoors and outdoors) for the permanent display <strong>of</strong> art and set aside funding to<br />
acquire a balanced and varied collection <strong>of</strong> public art. To date the <strong>City</strong>’s Public Art<br />
Collection includes something for everyone.<br />
In 1990, an Art in Private Development ordinance was adopted to further enhance the<br />
<strong>City</strong>’s commitment to providing art in the community and in response to a policy in the<br />
1983 Cultural Arts sub-element. Code requirements <strong>of</strong> the ordinance require large and<br />
centrally located private sector developments to include art for public display.<br />
The <strong>City</strong> also incorporates art components in appropriate capital projects. This approach<br />
has been used with recent park development and redevelopment projects. Baylands Park<br />
incorporates many elements <strong>of</strong> art and has the potential to include more. Art was also<br />
included in the renovation <strong>of</strong> the <strong>City</strong>’s oldest park, Washington Park. These successful<br />
models <strong>of</strong> incorporating art into park projects will be used for future parks projects.<br />
Meadow Flowers — nemophila menziesii variations” was provided by Target along Taafe Street as a new<br />
public art piece for the community to enjoy.
The challenge for the future will be to find new and reinvent old, ways <strong>of</strong> providing and<br />
encouraging the provision <strong>of</strong> publicly visible art. A new Master Plan for Public Art needs<br />
to be developed to set goals and priorities for the future which may be pursued as funds<br />
become available. Key elements <strong>of</strong> the 1983 Master Plan for Public Art included the<br />
capital project funding that enabled the commission and purchase <strong>of</strong> quality artworks<br />
and the <strong>City</strong>’s commitment to funding the development <strong>of</strong> a permanent collection<br />
through capital improvement funds. Since the original Master Plan for Public Art is<br />
now outdated, new funding sources and strategies need to be identified if a revised<br />
master plan is to be developed.<br />
An exciting area for consideration <strong>of</strong> new art is in the area <strong>of</strong> community murals. The<br />
Lakewood Community Mural set a good model for community involvement and support<br />
in assisting a pr<strong>of</strong>essional artist create a high quality mural in the Lakewood area. Staff will<br />
explore other options with neighborhood and community organizations for community<br />
murals to provide high quality public art and help promote neighborhood identity. Park<br />
sites, public buildings and other public spaces may provide appropriate venues.<br />
policy cc-1.8 PRovide And enCouRAge The inCoRPoRATion oF<br />
ART — boTh FunCTionAl And deCoRATive - in PubliC And PRivATe<br />
develoPMenT. (Previously Arts Policy E.2)<br />
community chaRacteR — desiGn Chapter 4<br />
n CC-1.8a As non-general fund resources allow — develop a new Master Plan for<br />
Public art. (Previously Arts Action Statement E.2.a)<br />
n CC-1.8b Look for opportunities to participate in County and/or regional projects to<br />
incorporate art. (Previously Arts Action Statement E.2.b)<br />
n CC-1.8c Work with Department <strong>of</strong> Public Works to include public art components as<br />
part <strong>of</strong> Interpretive Signage Project at SMaRT Station / WPCP Complex. (Previously<br />
Arts Action Statement E.2.c)<br />
n CC-1.8d Identify and consider opportunities for art components to park development<br />
and/or redevelopment projects, such as at Baylands Park. (Previously Arts Action<br />
Statement E.2.d)<br />
n CC-1.8e Continue to acquire public artworks which contribute to the public identity<br />
<strong>of</strong> outdoor places and provide pleasure and enrichment for Sunnyvale residents.<br />
(Previously Community Design Action Statement D.2.e)<br />
n CC-1.8f Encourage selections <strong>of</strong> public artwork which have a broad appeal and<br />
capture the aspirations or social and cultural heritage <strong>of</strong> the community. (Previously<br />
Community Design Action Statement D.2.g)<br />
4–9
<strong>City</strong> <strong>of</strong> Sunnyvale GeneRal plan – July <strong>2011</strong><br />
see Goal lt-5 (efficient<br />
transportation) for discussion<br />
and policies <strong>of</strong> pedestrian<br />
pathways, bicycle lanes, car<br />
travel and mass transit.<br />
4–10<br />
Goal CC-2<br />
attraCtive Street environMent<br />
CReATe An ATTRACTive STReeT enviRonMenT whiCh will CoMPliMenT PRivATe And<br />
PubliC PRoPeRTieS And be CoMFoRTAble FoR ReSidenTS And viSiToRS (Previously<br />
Community Design Goal B/ Adopted in 1990)<br />
The view from the road is one <strong>of</strong> the most significant factors shaping Sunnyvale’s visual<br />
image. For non-residents, the view from the road is <strong>of</strong>ten their only impression <strong>of</strong><br />
Sunnyvale. For Sunnyvale residents, the quality <strong>of</strong> the street environment has a more<br />
direct impact on their daily lives. <strong>City</strong> roads are used for shopping errands, by children<br />
walking to school and by residents driving to work. Roadways provide the continuity<br />
that links neighbor to neighbor, district to district and the <strong>City</strong> to the larger regional<br />
transportation systems. Roadways are an important part <strong>of</strong> the visual landscape and<br />
affect property values throughout the <strong>City</strong>.<br />
Sunnyvale is distinguished from surrounding cities by the amount <strong>of</strong> landscaped<br />
medians, street trees, private commercial landscaping, undergrounded utilities and<br />
sign controls. These features create an attractive roadway environment which differs<br />
from surrounding cities that do not have similar programs and regulations. Sunnyvale<br />
also looks different because <strong>of</strong> the extensive use <strong>of</strong> monolithic sidewalks, instead <strong>of</strong> the<br />
curbside landscaping found in several adjoining cities.<br />
Public Landscaping Programs<br />
Public landscaping can help unify and identify an area. Sunnyvale’s landscaped medians<br />
help distinguish the major thoroughfares in the <strong>City</strong> and make streets more attractive,<br />
motorists more comfortable and increase safety by separating oncoming cars. Trees also<br />
represent a substantial value to the <strong>City</strong>, by adding to the real estate values <strong>of</strong> the private<br />
properties adjacent to where they are located. Trees provide a habitat for wildlife, shade<br />
for pedestrians and motorists, contribute to fresher air and reduce reflected heat from<br />
buildings and pavement.<br />
The <strong>City</strong> has installed approximately 60 acres <strong>of</strong> public landscaping on Sunnyvale’s<br />
roadways. The <strong>City</strong> also maintains approximately 37,000 street trees. In <strong>2011</strong>, the <strong>City</strong> is<br />
drafting an Urban Forestry Plan to further detail the <strong>City</strong>’s plan for trees. Maintenance<br />
costs can be expected to increase as trees grow taller, requiring additional and more<br />
difficult pruning. The <strong>City</strong> is implementing a comprehensive citywide pruning cycle to<br />
systematically maintain the beauty and safety <strong>of</strong> Sunnyvale’s trees. The <strong>City</strong> can also<br />
undertake ongoing research on new tree varieties which are attractive, but require less<br />
maintenance and cause little or no damage to sidewalks.
policy cc-2.1 MAinTAin And PRovide ATTRACTive lAndSCAPing in The<br />
PubliC RighT-oF-wAY To idenTiFY The diFFeRenT TYPeS oF RoAdwAYS<br />
And diSTRiCTS, MAke MoToRiSTS MoRe CoMFoRTAble And iMPRove The<br />
enJoYMenT oF ReSidenTiAl neighboRhoodS. (Previously Community Design<br />
Policy B.1)<br />
Streetscape Improvements<br />
Utility wires, walls and fences along the public right <strong>of</strong> way have a direct impact on the<br />
view from the road. The design <strong>of</strong> these elements can add or detract from the visual<br />
appeal <strong>of</strong> the streetscape.<br />
Undergrounding Overhead Utilities<br />
Most property owners are required to place existing or new utilities underground<br />
when their land develops or redevelops. The <strong>City</strong> helps facilitate the undergrounding <strong>of</strong><br />
utilities by paying for a portion <strong>of</strong> the undergrounding which extends beyond private<br />
property lines and street centerlines. The <strong>City</strong>’s program to fund utility undergrounding<br />
along major thoroughfares has resulted in even more significant improvements to the<br />
roadway environment and the <strong>City</strong>’s image.<br />
fencing and Sound Walls<br />
Many <strong>of</strong> Sunnyvale’s major thoroughfares are bordered by a continuous wall <strong>of</strong> rear<br />
yard fencing. In residential areas fencing provides privacy, blocks the view <strong>of</strong> traffic and<br />
can provide some noise buffer.<br />
Sound walls are constructed to reduce the noise impacts <strong>of</strong> high traffic volumes on<br />
adjoining residences. Sound walls are constructed by private property owners along<br />
major roadways when those sites develop and with Measure A funds on freeways and<br />
expressways. Measure A funds are administered by the Santa Clara Valley Transportation<br />
Authority (VTA). The <strong>City</strong> has required sound walls as part <strong>of</strong> new development when<br />
needed for noise mitigation. State and County agencies are responsible for installing<br />
sound walls along freeways and expressways when there are substantial modifications,<br />
such as widening.<br />
Signs<br />
community chaRacteR — desiGn Chapter 4<br />
Commercial signs are a highly visible part <strong>of</strong> the roadside environment. They affect the<br />
visual quality <strong>of</strong> the roadways and the character <strong>of</strong> the <strong>City</strong>. Signs are generally oriented<br />
to the street and are a useful convenience to locate businesses. The differences in the<br />
types <strong>of</strong> signage <strong>of</strong>ten help to identify districts. Residential districts have few signs,<br />
while commercial districts have many signs in all different colors and sizes.<br />
see Goal sn-8 (compatible<br />
noise environment) for<br />
discussion and policies<br />
relating to noise compatibility<br />
and mitigation.<br />
4–11
<strong>City</strong> <strong>of</strong> Sunnyvale GeneRal plan – July <strong>2011</strong><br />
see title 19 <strong>of</strong> the Sunnyvale<br />
Municipal Code for the<br />
complete sign ordinance at<br />
municipalcode.inSunnyvale.<br />
com<br />
4–12<br />
Sunnyvale has adopted sign regulations to ensure that signage is attractive, compatible<br />
with the district where it is located and not distracting to motorists. The premise <strong>of</strong> the<br />
Sign Code is that signs should identify businesses, not advertise them. This principle is<br />
one reason why billboards are not allowed in Sunnyvale. Uniform regulations provide<br />
each business with an equal opportunity to identify its location. These regulations<br />
are necessary to avoid signs which compete for attention with overwhelming size or<br />
garish colors. This type <strong>of</strong> competition creates visual chaos and is detrimental to other<br />
businesses. Sign regulations improve the safety <strong>of</strong> motorists by eliminating distracting<br />
signage, such as blinking lights and requiring a safe location for ground signs, The Sign<br />
Code also ensures that signage is compatible with building style and site design.<br />
policy cc-2.2 MiniMize eleMenTS whiCh CluTTeR The RoAdwAY And<br />
look unATTRACTive. (Previously Community Design Policy B.3)<br />
n CC-2.2a Continue to work with county and state agencies to choose appropriate<br />
colors, textures and landscaping for sound walls on freeways and expressways.<br />
(Previously Community Design Action Statement B.3.c.)<br />
n CC-2.2b Encourage sound wall location and design which emphasizes important<br />
gateways into Sunnyvale. (Previously Community Design Action Statement B.3.d.)<br />
Goal CC-3<br />
Well-deSiGned SiteS and BuildinGS<br />
enSuRe ThAT buildingS And RelATed SiTe iMPRoveMenTS FoR PRivATe<br />
develoPMenT ARe well deSigned And CoMPATible wiTh SuRRounding<br />
PRoPeRTieS And diSTRiCTS. (Previously Community Design Goal C/ Adopted in 1990)<br />
Private development is as important as public improvements in creating a vital, enjoyable<br />
and comfortable environment for residents and visitors. As a result, most communities<br />
have development standards and <strong>of</strong>ten require public review and approval <strong>of</strong> project design.<br />
In Sunnyvale, the design <strong>of</strong> new projects is reviewed as part <strong>of</strong> the permitting process.<br />
Without design policies and standards, private development may or may not produce the<br />
type <strong>of</strong> visual environment preferred by Sunnyvale. It is even less likely that the <strong>City</strong> will<br />
get outstanding development without a commitment to quality design review.<br />
Sunnyvale has zoning regulations, standard development conditions and design<br />
guidelines which address site and building design. These regulations, conditions<br />
and policies are intended to create an environment which is engaging and attractive.<br />
They cover four major topics: site design, compatibility with the built environment,<br />
integration with the roadway and building design.
community chaRacteR — desiGn Chapter 4<br />
Along commercial roadways in Sunnyvale, buildings have routinely been set back from<br />
the street to accommodate parking. Often, a sense <strong>of</strong> enclosure is lost. The building also<br />
loses its relationship to the street and appears isolated at the back <strong>of</strong> a long expanse <strong>of</strong><br />
asphalt. The <strong>City</strong> has studied El Camino Real and Downtown and addressed the building<br />
and street relationship through the use <strong>of</strong> both minimum and maximum setbacks.<br />
policy cc-3.1 PlACe A PRioRiTY on QuAliTY ARChiTeCTuRe And SiTe<br />
deSign whiCh will enhAnCe The iMAge oF SunnYvAle And CReATe A<br />
viTAl And ATTRACTive enviRonMenT FoR buSineSSeS, ReSidenTS And<br />
viSiToRS, And be ReASonAblY bAlAnCed wiTh The need FoR eConoMiC<br />
develoPMenT To ASSuRe SunnYvAle’S eConoMiC PRoSPeRiTY. (Previously<br />
Community Design Policy C.1)<br />
n CC-3.1a Continue to improve the design review process by using design pr<strong>of</strong>essionals<br />
on staff and developing design guidelines to direct developers and assist the <strong>City</strong> in<br />
architectural and site review. (Previously Community Design Action Statement C.1.a)<br />
n CC-3.1b Continue to study areas where the street and building setback relationship<br />
could be improved. (Previously Community Design Action Statement C.2.g)<br />
n CC-3.1c Encourage reciprocal ingress-egress easements between commercial<br />
properties whenever feasible to minimize curb cuts, increase landscaping and<br />
improve vehicular safety. (Previously Community Design Action Statement C.3.l)<br />
n CC-3.1d Consider developing Zoning Code standards for minimum depths <strong>of</strong> below<br />
grade parking and avoid at grade parking under buildings. (Previously Community<br />
Design Action Statement C.4.h)<br />
policy cc-3.2 enSuRe SiTe deSign iS CoMPATible wiTh The nATuRAl And<br />
SuRRounding builT enviRonMenT. (Previously Community Design Policy C.2)<br />
list <strong>of</strong> Design Guidelines:<br />
n <strong>City</strong>-Wide design<br />
Guidelines<br />
n Single-family home design<br />
techniques<br />
n downtown Specific plan<br />
n Murphy avenue design<br />
Guidelines<br />
n taaffe-frances design<br />
Guidelines<br />
n eichler design Guidelines<br />
n industrial design<br />
Guidelines<br />
n precise plan for el Camino<br />
real<br />
n lakeside Specific plan<br />
n arques Specific plan<br />
n lockheed Martin Master<br />
use permit<br />
4–13
<strong>City</strong> <strong>of</strong> Sunnyvale GeneRal plan – July <strong>2011</strong><br />
4–14<br />
Goal CC-4<br />
aCCeSSiBle and attraCtive puBliC faCilitieS<br />
PRovide PubliC FACiliTieS whiCh ARe ACCeSSible, ATTRACTive And Add To The<br />
enJoYMenT oF The PhYSiCAl enviRonMenT. (Previously Community Design Goal D/<br />
Adopted in 1990)<br />
Public buildings and facilities are the <strong>of</strong>ficial face <strong>of</strong> a <strong>City</strong>. Sunnyvale’s public buildings<br />
are centers <strong>of</strong> government, law, culture, education, recreation and other <strong>City</strong> services.<br />
The <strong>City</strong> services provided in these buildings are essential to the health, safety and<br />
welfare <strong>of</strong> the community.<br />
There are many public buildings and complexes which serve Sunnyvale:<br />
n <strong>City</strong> Hall<br />
n Library<br />
n Community Center, including the Senior Center and Creative Arts Center<br />
n Parks and Recreation Centers (18)<br />
n Municipal Golf Courses<br />
n Public Safety Building<br />
n Fire Stations (6)<br />
n Corporation Yard<br />
n Water Pollution Control Plant and SMaRT Station<br />
See Figure 4-2, Public Facilities Map for the location <strong>of</strong> these buildings and complexes.<br />
Sunnyvale’s public buildings have unique characteristics which are different from other<br />
buildings in the <strong>City</strong>. Sunnyvale’s buildings are open to everyone and heavily used by the<br />
community. These public buildings are not commercial enterprises, but are solely meant<br />
to provide the best possible services to Sunnyvale residents, businesses and visitors. Public<br />
buildings represent the <strong>City</strong> and strengthen the identity <strong>of</strong> Sunnyvale. These buildings<br />
are publicly funded and owned. In addition to all <strong>of</strong> the design principles discussed for<br />
private development, the public nature <strong>of</strong> these buildings also requires them to be readily<br />
accessible, easily identified, attractive and representative <strong>of</strong> the communities’ values and<br />
aspirations. See Figure 4-2 for a map displaying the <strong>City</strong>’s public facilities.<br />
While Sunnyvale’s public buildings have good accessibility, improvements could be<br />
made to a comprehensive and visible sign program to help locate <strong>City</strong> facilities and<br />
other major attractions, such as the downtown. Some <strong>of</strong> Sunnyvale’s public buildings<br />
would be more easily identified if the signs were in prominent locations, <strong>of</strong> larger size,<br />
or made <strong>of</strong> more distinctive materials.
FIELD<br />
GRANT<br />
CENTRAL<br />
Public Facilities<br />
F F<br />
$F<br />
®<br />
"<br />
CA-85<br />
Schools<br />
Parks<br />
Fire Stations<br />
¿P Post Offices<br />
®<br />
®<br />
Ð Ð ® Ò<br />
Ð Ò<br />
® ® Ð<br />
® Ð Ò<br />
Library<br />
Ò Civic Center<br />
- <strong>City</strong> Hall<br />
- Public Safety<br />
- Municipal Court<br />
BERNARDO<br />
CA-237<br />
FREMONT<br />
MARY<br />
Community Development Department, 1990<br />
Library and<br />
Civic Center<br />
REM<strong>IN</strong>GTON<br />
HOLLENBECK<br />
STELL<strong>IN</strong>G<br />
CENTRAL EXPRESSWAY<br />
<strong>SUNNYVALE</strong> SARATOGA<br />
<strong>SUNNYVALE</strong><br />
MATHILDA<br />
Sunnyvale Caltrain<br />
Station<br />
Downtown<br />
OLD SAN FRANCISCO<br />
US-280<br />
Smart Station<br />
CALIFORNIA<br />
Community Center<br />
MAUDE<br />
EL CAM<strong>IN</strong>O REAL<br />
community chaRacteR — desiGn Chapter 4<br />
FAIR OAKS<br />
WOLFE<br />
JAVA<br />
Water Pollution<br />
Control Plant<br />
FAIR OAKS<br />
EVELYN<br />
CARIBBEAN<br />
Corporation<br />
Yard<br />
TASMAN<br />
REED<br />
HOMESTEAD<br />
LAWRENCE<br />
Lawrence Caltrain<br />
Station<br />
US-101<br />
ARQUES<br />
KIFER<br />
MONROE<br />
Major Streets<br />
GREAT AMERICA<br />
BOWERS<br />
Highway/Expressway<br />
Å Train Station<br />
! Light Rail Station<br />
Light Rail<br />
Railroad<br />
Creek<br />
Channel<br />
0.5<br />
Miles<br />
¸<br />
US-101<br />
figure 4-2:<br />
Public facilities Map<br />
WALSH<br />
US HWY 280<br />
4–15<br />
SCOTT
<strong>City</strong> <strong>of</strong> Sunnyvale GeneRal plan – July <strong>2011</strong><br />
4–16<br />
policy cc-4.1 enSuRe ThAT SunnYvAle’S PubliC FACiliTieS ARe eASilY<br />
idenTiFied, ACCeSSible, ATTRACTive And RePReSenTATive oF The<br />
CoMMuniTY’S vAlueS And ASPiRATionS. (Previously Community Design<br />
Policy D.1)<br />
n CC-4.1a Consider implementing a comprehensive sign program for public facilities<br />
and <strong>City</strong> <strong>of</strong> Sunnyvale entry signs which may include maps to show the location <strong>of</strong><br />
<strong>City</strong> facilities. (Previously Action Statement D.1a)<br />
n CC-4.1b Consider implementing ways to increase the visibility <strong>of</strong> the Civic Center<br />
on Mathilda Avenue and El Camino Real and consider better identification for<br />
the Community Center along Remington. (Previously Community Design Action<br />
Statement D.1d)<br />
policy cc-4.2 MAinTAin beAuTiFul And CoMFoRTAble ouTdooR<br />
PubliC PlACeS whiCh PRovide A ShARed SenSe oF owneRShiP And<br />
belonging FoR SunnYvAle ReSidenTS, buSineSS owneRS And<br />
viSiToRS. (Previously Community Design Policy D.2)<br />
n CC-4.2a Encourage some commercial activities in public plazas downtown<br />
(Previously Community Design Action Statement D.2.j)<br />
n CC-4.2b Continue to encourage pedestrian and commercial activity on the sidewalks<br />
<strong>of</strong> the historic 100 block <strong>of</strong> Murphy Avenue. (Previously Community Design Action<br />
Statement D.2.k)<br />
policy cc-4.3 woRk wiTh ouTSide goveRnMenT AgenCieS To<br />
AChieve ATTRACTive PubliC And QuASi–PubliC FACiliTieS ConSiSTenT<br />
wiTh The QuAliTY oF develoPMenT in SunnYvAle. (Previously<br />
Community Design Policy D.3)
heritaGe preServation<br />
Goal CC-5<br />
proteCtion <strong>of</strong> Sunnyvale’S heritaGe<br />
To enhAnCe, PReSeRve And PRoTeCT SunnYvAle’S heRiTAge inCluding<br />
nATuRAl FeATuReS, The builT enviRonMenT And SigniFiCAnT ARTiFACTS.<br />
(Previously Heritage Preservation Goal 6.3B / Adopted in 1995)<br />
Sunnyvale has a rich and diverse heritage that is composed not only <strong>of</strong> buildings, trees<br />
and artifacts <strong>of</strong> historic significance, but also <strong>of</strong> the cultural traditions and community<br />
memories that these physical resources represent. It is not the objects, but the<br />
associations that these objects bring to mind, that make them important contributors to<br />
the experience <strong>of</strong> place and the sense <strong>of</strong> community. Acknowledging and maintaining<br />
these physical reminders <strong>of</strong> who we are and where we have come from is especially<br />
important in times <strong>of</strong> change — and, for Sunnyvale, change has always been part <strong>of</strong> the<br />
community experience.<br />
In 1980, the <strong>City</strong> <strong>of</strong> Sunnyvale recognized the need to preserve those objects that<br />
represent the community’s physical and cultural development and adopted the first<br />
Heritage Preservation Sub-Element as part <strong>of</strong> the Sunnyvale General Plan. The <strong>City</strong> also<br />
established the <strong>of</strong>ficial Heritage Resources Inventory in 1980 containing landmarks,<br />
trees, residential and commercial districts and individual structures.<br />
There are two main types <strong>of</strong> protected structures in Sunnyvale – heritage resources<br />
and local landmarks. A local landmark is the highest level <strong>of</strong> protection given by the<br />
<strong>City</strong>. Changes to local landmarks must be reviewed and approved by the Heritage<br />
Commission and specific, stringent reviews must be conducted if a local landmark is<br />
to be changed in a way that would significantly alter its historic character. Heritage<br />
resources have a somewhat lower level <strong>of</strong> protection.<br />
Approximately 50 individual structures are listed as Heritage Resources and nine<br />
properties have individual landmarks. In addition, the <strong>City</strong> contains two districts: the<br />
Taaffe-Frances Heritage Neighborhood (a residential district) and the Murphy Station<br />
Heritage Landmark District (a commercial district).<br />
Taaffe-frances heritage Neighborhood<br />
community chaRacteR — heRitaGe pReseRvation Chapter 4<br />
The majority <strong>of</strong> the homes in the Taaffe-Frances Heritage Neighborhood (the 500<br />
blocks <strong>of</strong> S. Frances Street and S. Taaffe Street and one home on the corner <strong>of</strong> S. Murphy<br />
Avenue and Olive Avenue) are in good to excellent condition. Although some individual<br />
buildings show the need for improvement, the overall appearance <strong>of</strong> this neighborhood<br />
is that owners care about their properties and make an effort to maintain them.<br />
Renovations and new additions made after 1988, when the Heritage Housing Combining<br />
District was added to the neighborhood, have been consistent with the regulations<br />
the current heritage<br />
resources inventory and<br />
Section 19.96 (heritage<br />
preservation) <strong>of</strong> the Sunnyvale<br />
Municipal code is available<br />
online at www.sunnyvale.<br />
ca.gov or at the one-Stop<br />
Counter at <strong>City</strong> hall. the<br />
<strong>City</strong> also has achieved a<br />
designation as a Certified<br />
local Government (ClG)<br />
from the State historic<br />
preservation <strong>of</strong>fice (Shpo).<br />
among other benefits this<br />
designation entitles the<br />
<strong>City</strong> to apply for grants for<br />
certain heritage projects.<br />
Heritage resource –a natural<br />
or human-made objects<br />
<strong>of</strong> scientific, aesthetic,<br />
educational, political, social,<br />
cultural, architectural or<br />
historical significance to<br />
the citizens <strong>of</strong> the city, the<br />
Santa Clara valley region,<br />
the state, or the nation,<br />
which are designated and<br />
determined to be appropriate<br />
for preservation by the city<br />
council. See SMC title 19<br />
at http://municipalcode.<br />
inSunnyvale.com for a<br />
complete definition.<br />
4–17
<strong>City</strong> <strong>of</strong> Sunnyvale GeneRal plan – July <strong>2011</strong><br />
Heritage Housing District —<br />
a zoning overlay which can<br />
be added to a residential<br />
zoning district to inform the<br />
community <strong>of</strong> the presence <strong>of</strong><br />
a heritage housing district.<br />
See the taaffe-frances<br />
heritage neighborhood<br />
design Guidelines for more<br />
information about the<br />
neighborhood and design<br />
policies for any modifications.<br />
local landmark — a heritage<br />
resource which is significant<br />
in that the resource materially<br />
benefits the historical<br />
character <strong>of</strong> a neighborhood<br />
or area, or the resource in<br />
its location represents an<br />
established and familiar visual<br />
feature <strong>of</strong> the community or<br />
<strong>City</strong>, and has been designated<br />
and determined to be<br />
appropriate for preservation<br />
by the <strong>City</strong> Council. See SMC<br />
title 19 at MunicipalCode.<br />
inSunnyvale.com for a<br />
complete definition.<br />
4–18<br />
governing the district. Most <strong>of</strong> the renovations have been simple improvements that<br />
have not changed the essential character <strong>of</strong> the homes and/or the neighborhood.<br />
Murphy Station heritage Landmark District<br />
The <strong>City</strong>’s only heritage commercial streetscape, the Murphy Station Heritage Landmark<br />
District, exemplifies the link between preservation and economic development. Activities<br />
which were designed to promote preservation <strong>of</strong> the buildings and streetscape resulted in<br />
the creation <strong>of</strong> an environment that is so attractive that it has drawn significant business<br />
investment, re-establishing Murphy Avenue as a commercially viable neighborhood. In<br />
fact, Murphy Avenue has become a destination point for the region.<br />
This is the result <strong>of</strong> extensive investment that the <strong>City</strong> has made in the District. After<br />
the designation <strong>of</strong> the district in 1981 and the adoption <strong>of</strong> Murphy Avenue Design<br />
Guidelines, the <strong>City</strong> made a series <strong>of</strong> improvements which include repaving and<br />
landscaping the parking lots, making street and sidewalk improvements and providing<br />
street trees, street furniture and planters. In addition to these improvements, the <strong>City</strong><br />
made low interest loans available to owners to assist with building improvements. By<br />
the mid-1990s, Murphy Avenue became the restaurant and entertainment center <strong>of</strong><br />
Sunnyvale. The single most prevalent use on Murphy Avenue is restaurants that serve<br />
alcoholic beverages. Other restaurants, bars and nightclubs are also present, along with<br />
personal service uses, specialty retail uses, pr<strong>of</strong>essional <strong>of</strong>fices and two apartments.<br />
Since the long term preservation <strong>of</strong> structures on the street is dependent upon the street’s<br />
continuing commercial viability, consideration should be given to whether the number<br />
<strong>of</strong> businesses that serve alcoholic beverages should be limited, in order to achieve a<br />
more diverse mix <strong>of</strong> uses on Murphy Avenue. Entertainment-related uses are especially<br />
vulnerable to fads, as new places and styles <strong>of</strong> entertainment attract those seeking new<br />
entertainment experiences. A strategic approach to keeping the economic base <strong>of</strong> a<br />
commercial neighborhood strong is to diversify the uses in order to attract a wider range<br />
<strong>of</strong> customers and to balance daytime/nighttime uses. A diversity <strong>of</strong> uses also functions<br />
to encourage multi-use in the area, as a customer shops for retail products, gets a<br />
haircut and stops for lunch or a snack at a restaurant. In order to keep Murphy Avenue<br />
commercially viable, the Heritage Preservation Commission, the Planning Commission<br />
and staff should work closely together to encourage a strategic mix <strong>of</strong> uses. Sometimes,<br />
however, these two values – heritage preservation and economic development, may<br />
appear to be in conflict with each other. Creative resolutions <strong>of</strong> such conflict can be<br />
found through good communication and coordination between the various decision<br />
makers who are involved.
community chaRacteR — heRitaGe pReseRvation Chapter 4<br />
Maintaining and Updating the heritage Resources Inventory<br />
The Heritage Resource Inventory does not include all <strong>of</strong> the buildings, trees and sites<br />
in the <strong>City</strong> that may be worthy <strong>of</strong> inclusion. The Heritage Resources inventory should<br />
be updated periodically to include new resources that have been added to the inventory<br />
since the last publication, delete those that have been lost and indicate any that may<br />
have been upgraded from a heritage resource to a landmark status. At that time, existing<br />
resources should be re-evaluated and a new survey <strong>of</strong> the community conducted to<br />
determine if other buildings, sites, trees, streetscapes or districts should be considered<br />
for inclusion in the Inventory.<br />
policy cc-5.1 PReSeRve exiSTing lAndMARkS And CulTuRAl<br />
ReSouRCeS And TheiR enviRonMenTAl SeTTingS. (Previously Heritage<br />
Preservation Policy 6.3B.1)<br />
n CC-5.1a Consider instituting a Neighborhood Enhancement program for older<br />
neighborhoods containing a number <strong>of</strong> cultural resource structures where there is<br />
evidence that the structures in the neighborhood may be deteriorating due to poor<br />
maintenance and lack <strong>of</strong> repairs. (Previously Heritage Preservation Action Statement<br />
6.3B.1e)<br />
policy cc-5.2 enhAnCe The viSuAl ChARACTeR oF The CiTY bY<br />
PReSeRving diveRSe AS well AS hARMoniouS ARChiTeCTuRAl STYleS,<br />
ReFleCTing vARiouS PhASeS oF The CiTY’S hiSToRiCAl develoPMenT And<br />
The CulTuRAl TRAdiTionS oF PAST And PReSenT ReSidenTS. (Previously<br />
Heritage Preservation Policy 6.3B.3)<br />
policy cc-5.3 idenTiFY And woRk To ReSolve ConFliCTS beTween The<br />
PReSeRvATion oF hiSToRiC ReSouRCeS And AlTeRnATive lAnd uSeS.<br />
(Previously Heritage Preservation Policy 6.3B4)<br />
n CC-5.3a Consider providing more flexibility in the zoning code to provide for<br />
adaptive reuse <strong>of</strong> heritage structures when existing uses are not economically<br />
feasible and alternative uses would not be allowed under existing zoning regulations.<br />
(Previously Heritage Preservation Action Statement 6.3B.4b)<br />
4–19
<strong>City</strong> <strong>of</strong> Sunnyvale GeneRal plan – July <strong>2011</strong><br />
other Heritage preservation<br />
agencies<br />
n Sunnyvale historical<br />
Society<br />
n California historical Society<br />
n Santa Clara County<br />
heritage Council<br />
n California preservation<br />
foundation<br />
n Sunnyvale heritage<br />
Museum, http://www.<br />
heritageparkmuseum.org/<br />
4–20<br />
policy cc-5.4 Seek ouT, CATAlog And evAluATe heRiTAge ReSouRCeS<br />
whiCh MAY be SigniFiCAnT. (Previously Heritage Preservation Policy 6.3B.5)<br />
policy cc-5.5 ARCheologiCAl ReSouRCeS Should be PReSeRved<br />
wheneveR PoSSible. (Previously Heritage Preservation Policy 6.3B.10)<br />
policy cc-5.5 enCouRAge A CoMMeRCiAllY STRATegiC Mix oF uSeS on<br />
MuRPhY Avenue. (Previously Heritage Preservation Policy 6.3B.7)<br />
Goal CC-6<br />
knoWledGe <strong>of</strong> Sunnyvale’S heritaGe<br />
PRoMoTe knowledge oF, And APPReCiATion FoR, SunnYvAle’S heRiTAge And<br />
enCouRAge bRoAd CoMMuniTY PARTiCiPATion in heRiTAge PRogRAMS And<br />
PRoJeCTS. (Previously Heritage Preservation Goal 6.3A/ Adopted in 1995)<br />
Much <strong>of</strong> the basic work <strong>of</strong> identifying and designating resources and providing regulations<br />
to operate the <strong>City</strong>’s heritage preservation program has been done. Although these<br />
achievements have been very important, community support is a key factor in improving<br />
the <strong>City</strong>’s heritage preservation program and protecting its heritage resources. Therefore,<br />
programs which involve communication and other forms <strong>of</strong> outreach should be given<br />
priority in the coming years. These types <strong>of</strong> programs include partnerships with other<br />
groups and agencies, collection <strong>of</strong> oral histories and integration <strong>of</strong> diverse traditions.
Partnerships with Other Groups and Agencies<br />
It will become increasingly important to maintain and expand relationships with private<br />
organizations as the <strong>City</strong> seeks to broaden its constituency for heritage preservation<br />
support and maximize the effectiveness <strong>of</strong> the <strong>City</strong>’s Heritage Preservation program.<br />
These other agencies can provide information and support for the <strong>City</strong>’s heritage<br />
preservation activities.<br />
Some <strong>of</strong> these program activities include providing written histories <strong>of</strong> the <strong>City</strong>.<br />
The Heritage Preservation Commission published a book Images, which provides<br />
photographs and information on Sunnyvale’s heritage resources which has been used<br />
extensively by members <strong>of</strong> the Sunnyvale Historical Society as well as the public. Since<br />
this book is now out <strong>of</strong> print, re-publication should be considered. In addition to Images,<br />
the <strong>City</strong> assisted with publishing a book on the history <strong>of</strong> Sunnyvale, Sunnyvale from<br />
the <strong>City</strong> <strong>of</strong> Destiny to the Heart <strong>of</strong> Silicon Valley, by Mary Jo Ign<strong>of</strong>fo. This book was<br />
published by the California History Center Foundation and provides another example<br />
<strong>of</strong> how various public and private agencies can work together to acknowledge and<br />
preserve the <strong>City</strong>’s heritage preservation program.<br />
Oral histories<br />
In addition to written resources, the <strong>City</strong> also has a resource that has not been fully<br />
utilized – the memories <strong>of</strong> long-time residents. Older residents have stories to tell about<br />
Sunnyvale’s past which can help us to understand how things came to be as they are and<br />
how personalities <strong>of</strong> these individuals have affected the <strong>City</strong>’s historical development.<br />
For example the story <strong>of</strong> W.E. Crossman’s efforts to create the <strong>City</strong> <strong>of</strong> Destiny is largely<br />
an oral tradition that was later recorded and documented. These heritage resources,<br />
although in some ways intangible, make an important contribution to Sunnyvale’s<br />
Heritage and should be acknowledged.<br />
Integration <strong>of</strong> Diverse Traditions<br />
community chaRacteR — heRitaGe pReseRvation Chapter 4<br />
The cultural traditions which now are reflected in Sunnyvale’s built environment are<br />
largely the traditions <strong>of</strong> Americans <strong>of</strong> European descent. It is these traditions which<br />
have defined what is beautiful and worth <strong>of</strong> preservation. As the number <strong>of</strong> immigrants<br />
from other countries increases, the ethnic make-up <strong>of</strong> the population will change. The<br />
new residents will bring with them their own concepts about what is beautiful, what is<br />
acceptable and what is worthy <strong>of</strong> preservation.<br />
Sunnyvale has not yet experienced the “layering” effect <strong>of</strong> having buildings used over<br />
time by different cultural groups. Therefore, the question <strong>of</strong> “whose heritage is it?” that<br />
should be preserved has not arisen. However, if the predicted demographic changes occur,<br />
this could be a relevant question in the future. Some new residents may at first tend to<br />
move into the older, less expensive neighborhoods which contain a significant number<br />
<strong>of</strong> cultural resource homes and propose to make changes to these homes to express their<br />
cultural traditions. Should this pattern occur, it will provide an opportunity to develop<br />
a creative dialogue between the new residents and the heritage “establishment.” In order<br />
to benefit from the enrichment possible through integration <strong>of</strong> diverse traditions, an<br />
energetic program <strong>of</strong> outreach and involvement should be developed.<br />
records, photographs,<br />
books and other materials<br />
documenting Sunnyvale’s<br />
history can be found in the<br />
archival collection <strong>of</strong> the<br />
<strong>City</strong>’s public library and at the<br />
Sunnyvale historical Museum.<br />
4–21
<strong>City</strong> <strong>of</strong> Sunnyvale GeneRal plan – July <strong>2011</strong><br />
4–22<br />
policy cc-6.1 develoP And exPAnd CooPeRATive woRking<br />
RelATionShiPS wiTh SChoolS, CiviC gRouPS, neighboRhood<br />
oRgAnizATionS, buSineSS oRgAnizATionS And oTheR eSTAbliShed<br />
oRgAnizATionS To ShARe in The PRoMoTion oF heRiTAge PRogRAMS<br />
And PRoJeCTS. (Previously Heritage Preservation Policy 6.3A.2)<br />
policy cc-6.2 PRoMoTe The undeRSTAnding ThAT heRiTAge<br />
PReSeRvATion enhAnCeS PRoPeRTY vAlueS And PRovideS FinAnCiAl<br />
And eConoMiC beneFiTS To PRoPeRTY owneRS, neighboRS And The<br />
CiTY. (Previously Heritage Preservation Policy 6.3A.3)<br />
n CC-6.2a Consider development <strong>of</strong> a comprehensive outreach program to encourage<br />
involvement <strong>of</strong> a broad spectrum <strong>of</strong> the community in heritage preservation issues<br />
and projects. (Previously Heritage Preservation Policy 6.3A.4)<br />
liBrary<br />
Goal CC-7<br />
appropriate liBrary faCilitieS<br />
MAinTAin libRARY FACiliTY And PuRChASe MATeRiAlS ThAT ARe eASilY obTAinAble<br />
And APPRoPRiATe bASed on ChAnging CoMMuniTY needS (Previously Library Goal<br />
6.2D / Adopted in 2003)<br />
Goal CC-8<br />
Broad and diverSe liBrary ColleCtion<br />
PRovide A bRoAd And diveRSe ColleCTion oF bookS And oTheR libRARY<br />
MATeRiAlS To MeeT The vARied inTeReSTS And needS oF The CoMMuniTY.<br />
(Previously Library Goal 6.2A / Adopted In 2003)<br />
The Sunnyvale Library is a vibrant community space where the public has access to a<br />
vast diversity <strong>of</strong> ideas, information, knowledge and entertainment. Service, programs<br />
and collections are designed to inform and delight residents <strong>of</strong> all ages, backgrounds<br />
and educational levels.
community chaRacteR — libRaRy Chapter 4<br />
Library use in Sunnyvale has been high for more than a decade. Frequent users <strong>of</strong> library<br />
services are children, adults from 35-54 and seniors. The Library is consistently among<br />
the top five California public libraries in communities <strong>of</strong> similar size in terms <strong>of</strong> number<br />
<strong>of</strong> items circulated per capita. Library use ebbs and flows with the economy, community<br />
education levels and in relation to library conditions in neighboring communities. As<br />
<strong>of</strong> 2003, the Sunnyvale Library is experiencing a sustained period growth in use <strong>of</strong><br />
materials, an increase <strong>of</strong> 20 percent in the last year alone.<br />
The library collection is the backbone <strong>of</strong> the Library, supporting the Library’s activities<br />
and services. The library collection continues to evolve as technology provides new<br />
formats and information delivery systems. Books, books on CDs (compact discs), music<br />
CDs, down-loadable electronic books for computer use and portable devices, DVDs,<br />
magazines and newspapers, in print and online, and other digital resources comprise<br />
the current array <strong>of</strong> materials <strong>of</strong>fered to satisfy the information needs <strong>of</strong> our community.<br />
Modernization and additional space are required for to support future areas <strong>of</strong> emphasis<br />
in library services. Special areas <strong>of</strong> emphasis include additional space for children’s<br />
materials, media collection computer-related materials and materials in a variety <strong>of</strong><br />
languages. Additional space for functions such as meeting space, study areas, and areas<br />
to obtain, meet in small groups and gather in large groups for programs.<br />
In response to the increasing complexity <strong>of</strong> Library space issues, facility studies were<br />
conducted in depth in 2006 and 2007. Space, aging building systems and access issues<br />
were addressed at that time. The study also determined how much additional space was<br />
needed and what kind <strong>of</strong> space it should be. The options for study included consideration<br />
<strong>of</strong> a new main library facility and additional branches in the community. Building a new,<br />
larger main library facility was recommended and presented to Sunnyvale residents for<br />
approval in 2007 as a Library Bond Measure. The measure failed to achieve the twothirds<br />
majority needed to pass, so the possibility <strong>of</strong> a branch library was explored in<br />
2008. The <strong>City</strong> Council did not to pursue the branch library alternative at that time.<br />
Future considerations should also explore the feasibility <strong>of</strong> retail and/or food beverage<br />
services for Library customers due to many requests from customers over a long period<br />
<strong>of</strong> time. Additional options and decisions need to be made to provide full library service<br />
in updated, accessible, technology-upgraded facilities in Sunnyvale.<br />
The Sunnyvale Library looks towards future trends to continue to provide the public<br />
with current content and materials. The Library must address the most effective ways<br />
to continue to support reading and learning using print as well as the new formats and<br />
methods that technology continues to <strong>of</strong>fer. There is a vast array <strong>of</strong> formats that the<br />
public increasingly expects the Library to <strong>of</strong>fer, which is a challenge to the Library’s<br />
static budget. The Library also needs to <strong>of</strong>fer easy access to Library resources via social<br />
networks and on personal handheld devices. It is not enough to simply introduce new<br />
technologies and formats to the public. The Library must be supportive <strong>of</strong> each user’s<br />
specific needs in terms <strong>of</strong> the management and evaluation <strong>of</strong> such technologies and<br />
formats.<br />
4–23
<strong>City</strong> <strong>of</strong> Sunnyvale GeneRal plan – July <strong>2011</strong><br />
4–24<br />
Policies supporting Goal CC-7 (Appropriate Library Facilities)<br />
policy cc-7.1 PRovide ACCeSS To The libRARY And MATeRiAlS.<br />
(Previously Library Policy 6.2D.1)<br />
n CC-7.1a Review the need to provide library signs in languages other than English.<br />
(Previously Library Action Statement 6.2D.1c)<br />
policy cc-7.2 MAinTAin A Full SeRviCe libRARY AdeQuATe To MeeT<br />
CoMMuniTY needS. (Previously Library Policy 6.2D.2)<br />
n CC-7.2a Study the space needs <strong>of</strong> the Library as the population grows and diversifies<br />
and recommend the most appropriate configuration for services and facilities.<br />
(Previously Library Action Statement 6.2D.2a)<br />
n CC-7.2b Explore the feasibility <strong>of</strong> retail and/or food/beverage service and space for<br />
Library customers. (Previously Library Action Statement 6.2E.2c)<br />
Policies supporting Goal CC-8 (Broad and Diverse Library Collection)<br />
policy cc-8.1 PRovide A ColleCTion oF MATeRiAlS in PRinT, AudioviSuAl<br />
And eleCTRoniC FoRMATS in SuPPoRT oF All libRARY SeRviCeS.<br />
(Previously Library Policy 6.2A.1)<br />
policy cc-8.2 give high PRioRiTY To The Following:<br />
n Collections <strong>of</strong> materials for children and their parents, teachers and care<br />
givers. (Previously library policy 6.2A.2)<br />
n Collections that support reference services (previously library policy 6.2A.3)<br />
n Providing educational support for library users <strong>of</strong> all ages. (Previously library<br />
policy 6.2A.4)<br />
n developing the library’s collection <strong>of</strong> popular materials. (Previously library<br />
policy 6.2A.5)
artS<br />
Goal CC-9<br />
appropriate artS faCilitieS<br />
PRovide And MAinTAin ARTS FACiliTieS bASed on CoMMuniTY need And The<br />
CiTY’S AbiliTY To FinAnCe, ConSTRuCT, MAinTAin And oPeRATe TheM. (Previously<br />
Arts Goal F/ Adopted in 1995)<br />
As an essential and integral part <strong>of</strong> the <strong>City</strong> <strong>of</strong> Sunnyvale’s services, the <strong>City</strong> currently<br />
operates two community buildings dedicated to the arts: Sunnyvale Theatre and the<br />
Creative Arts Center. The fully-equipped 200-seat Sunnyvale Theatre is the most<br />
heavily programmed theatre venue in the South Bay, serving an annual audience <strong>of</strong><br />
more than 65,000 with a schedule that includes more than 400 performances <strong>of</strong> all types<br />
<strong>of</strong> venues. The Theatre building also includes one <strong>of</strong> the area’s most attractive public<br />
dance studios. The adjacent Creative Arts Center includes one <strong>of</strong> the largest pottery<br />
studios in the Bay Area, two fine art studios and two music and drama classrooms.<br />
Together, these two facilities house most <strong>of</strong> the <strong>City</strong>’s performing and visual arts classes<br />
in a central location, providing recreational experiences for more than 21,000 youth and<br />
adult students enrolled annually.<br />
These well-equipped, well-maintained and conveniently-located arts facilities showcase<br />
Sunnyvale as a center <strong>of</strong> creativity and productivity. Community members <strong>of</strong> all<br />
ages can practice and enjoy both performing and visual arts. These buildings invite<br />
shared cultural experiences, serve as gathering places and allow nonpr<strong>of</strong>it art groups<br />
opportunities to flourish.<br />
There is an acknowledged shortage <strong>of</strong> suitable and affordable commercial space available<br />
to individual pr<strong>of</strong>essional artists in the region. In addition to the Sunnyvale Theatre and<br />
Creative Arts Center, Sunnyvale also maintains and leases four Artist Studios at Raynor<br />
Activity Center at below-market rates. By making available affordable workspaces for<br />
local pr<strong>of</strong>essional artists, the <strong>City</strong> further affirms its commitment to providing an<br />
encouraging and welcoming environment for the arts.<br />
Community Center Theatre<br />
community chaRacteR — aRts Chapter 4<br />
The Community Center Renovation Project, completed in 1991, included major<br />
improvements to the Community Center Theatre because <strong>of</strong> heavy use and need for<br />
quality arts facilities. The theatre lobby was enlarged and a ticket box <strong>of</strong>fice was added<br />
to the front <strong>of</strong> the theatre. Handicapped accessible rest rooms, a rehearsal room and<br />
<strong>of</strong>fice space were also added. The ambiance <strong>of</strong> the facility was enhanced by updating<br />
and coordinating interior finishes and furniture and the theatre seating was replaced.<br />
Infrastructure improvements included replacing the ro<strong>of</strong>, heating, ventilation and air<br />
conditioning systems, stage lighting, audio system and fire protection system.<br />
4–25
<strong>City</strong> <strong>of</strong> Sunnyvale GeneRal plan – July <strong>2011</strong><br />
4–26<br />
Use <strong>of</strong> the Community Center Theatre has expanded since 1983, and the theatre is annually<br />
booked for 49 weeks with three weeks generally set aside for preventive maintenance and<br />
repair. Over 450 performances are <strong>of</strong>fered each year which include performances by the<br />
California Theatre Center, Sunnyvale Community Players, Sunnyvale Singers, Sunnyvale<br />
Music Association, the <strong>City</strong>’s Evenings <strong>of</strong> Cultural Arts and various community rentals.<br />
Performances include drama, dance, storytelling and music.<br />
Creative Arts Center<br />
To address changing programming needs, the Creative Arts Center was remodeled in<br />
1985 to replace the lapidary studio with a general purpose arts and crafts studio, and<br />
add storage for the gallery along with <strong>of</strong>fice space. As part <strong>of</strong> the Community Center<br />
Renovation Project, a fire protection system was added, the ro<strong>of</strong> replaced, and interior<br />
finishes were updated. New kilns were installed in 1995, and potter’s wheels and other<br />
pottery-related equipment are replaced on an as needed basis. In compliance with the<br />
Americans with Disabilities Act <strong>of</strong> 1990, a fully accessible potter’s wheel has been added<br />
to the equipment inventory.<br />
Dance Studio<br />
Since 1983, there has been increased community interest in dance; therefore, a major<br />
component <strong>of</strong> the Community Center Renovation Project identified the addition <strong>of</strong> a<br />
dance studio to the theatre building. The “state <strong>of</strong> the art” dance studio includes a sprung<br />
wooden floor, full length mirrors, exercise bars and a sound system. The studio can be<br />
accessed from the outside or through the main building — a feature which lends itself well<br />
to the conducting <strong>of</strong> classes as well as rehearsal space for theatre and dance productions.<br />
Approximately 250 annual dance classes are held in the Dance Studio for children,<br />
youth and adults. Dance opportunities include ballet, tap, jazz, street dance, flamenco,<br />
belly dance and creative movement. Classes serve approximately 3,000 participants<br />
a year and represent major growth in program participation since 1983. The dance<br />
program includes traditional <strong>of</strong>ferings <strong>of</strong> Ballet, Tap and Jazz, while expanding to meet<br />
the changing needs <strong>of</strong> the community. Classes such as Hip Hop are popular with the<br />
younger members <strong>of</strong> the community and classes such as Chinese Ethnic Folk Dance and<br />
Israeli Folk Dance experience high enrollment on an on-going basis.<br />
Raynor Artists’ Studios<br />
To further demonstrate the <strong>City</strong>’s commitment to encourage and support local artists,<br />
a portion <strong>of</strong> the Raynor Activity Center has been converted to four artist studios. The<br />
studios are <strong>of</strong>fered to local artists on a short-term lease basis at below market rental<br />
rates. These studios <strong>of</strong>fer a creative space for artists who cannot rent space at commercial<br />
rates. Artists are selected by a jury based on their eligibility in meeting the following<br />
criteria: quality <strong>of</strong> work; residence (Sunnyvale resident or non-resident); and diversity<br />
in the types <strong>of</strong> media being represented at the site.
future facilities<br />
The present trend is towards maintaining existing facilities rather than constructing<br />
new ones, given the high costs both <strong>of</strong> facility construction and <strong>of</strong> operation. The recent<br />
and extensive renovation <strong>of</strong> the Community Center Complex has ensured that the arts<br />
facilities located therein are functional and attractive. Efforts will continue to focus<br />
on maintaining the Americans with Disabilities Act accessibility, along with facility<br />
quality, safety and cleanliness to ensure participants’ safety and user satisfaction.<br />
Located within the greater Sunnyvale area are many arts facilities <strong>of</strong> a regional nature<br />
which may <strong>of</strong>fer the potential for partnerships while also serving as arts resources to<br />
residents <strong>of</strong> the region. For facilities owned by the <strong>City</strong> <strong>of</strong> Sunnyvale, where possible and<br />
appropriate, efforts will be made to recover the costs <strong>of</strong> operation from users, such as<br />
in rental situations.<br />
policy cc-9.1 PRovide, MAinTAin, And oPeRATe ARTS FACiliTieS wiThin<br />
FinAnCiAl ConSTRAinTS SuCh AS The CoMMuniTY CenTeR TheATRe,<br />
CReATive ARTS CenTeR, ARTiSTS’ STudio, gAlleRY And PubliC ART<br />
ColleCTion in A SAFe, CleAn And uSAble CondiTion wiTh ATTenTion<br />
To CuSToMeR SATiSFACTion. (Previously Arts Policy F.1)<br />
n CC-9.1a Plan and implement appropriate non-use times for arts facilities which will<br />
ensure adequate maintenance time.<br />
n CC-9.1b Conduct ongoing surveys <strong>of</strong> special populations related to facilities in order<br />
to provide maximum accessibility.<br />
n CC-9.1c Evaluate opportunities to utilize regional arts facilities and resources.<br />
community chaRacteR — aRts Chapter 4<br />
4–27
<strong>City</strong> <strong>of</strong> Sunnyvale GeneRal plan – July <strong>2011</strong><br />
4–28<br />
reCreation<br />
Goal CC-10<br />
hiGh-Quality reCreation proGraMMinG<br />
The CiTY STRiveS To develoP And iMPleMenT PASSive And ACTive ReCReATion And<br />
enRiChMenT PRogRAMS ThAT:<br />
• Provide constructive oPPortunities for fitness, well-being, healthy<br />
CoPing And STReSS MAnAgeMenT<br />
• highlight cultural Practices and traditions reflective <strong>of</strong> a diverse<br />
CoMMuniTY<br />
• Promote activities that foster interaction among diverse Parts <strong>of</strong> the<br />
CoMMuniTY<br />
• encourage creative exPression, education, skill develoPment and<br />
PeRSonAl enRiChMenT<br />
• contribute to the creation <strong>of</strong> a healthy community; and Promote<br />
CoMMuniTY PARTiCiPATion in ReCReATion FoR All AgeS.<br />
(Previously Open Space and Recreation Goal 2.2.B / Adopted in 2006)<br />
Goal CC-11<br />
Wide ranGe <strong>of</strong> reCreation proGraMMinG<br />
The CiTY STRiveS To enSuRe eQuAl oPPoRTuniTieS FoR PARTiCiPATion And To<br />
PRovide FoR A RAnge oF STRuCTuRed And unSTRuCTuRed uSeS, And A vARieTY<br />
oF geneRAl And SPeCiAl inTeReST uSeS in PARkS And FACiliTieS. The CiTY<br />
AlSo PRovideS A wide RAnge oF PRogRAM ChoiCeS, oPen SPACe, AMeniTieS<br />
And FACiliTY oFFeRingS To MeeT The ReCReATionAl needS oF A diveRSe<br />
And ChAnging PoPulATion, inCluding idenTiFied SubgRouPS And SPeCiAl<br />
PoPulATionS. PoliCieS RelATed To ACQuiRing And/oR develoPing oPen SPACe<br />
FACiliTieS And AMeniTieS ARe AlSo inCluded heRe. CoMPeTing inTeReSTS And<br />
FiniTe ReSouRCeS, howeveR, ReQuiRe The CiTY To SeT SoMe PRioRiTieS. (Previously<br />
Open Space and Recreation Goal 2.2.D / Adopted in 2006)<br />
Goal CC-12<br />
MaxiMuM aCCeSS to reCreation ServiCeS, faCilitieS<br />
and aMenitieS<br />
The CiTY STRiveS To MAxiMize ACCeSS To All oF iTS SeRviCeS, FACiliTieS And<br />
AMeniTieS. (Previously Open Space And Recreation Goal 2.2.E / Adopted in 2006)
The <strong>City</strong> strives to create community through its people, parks and programs. A wide<br />
range <strong>of</strong> accessible, high quality arts and recreation services, facilities and programs are<br />
provided to enhance the well-being <strong>of</strong> the diverse and changing Sunnyvale community.<br />
Increasing ethnic diversity in the <strong>City</strong> affects the promotion and communication <strong>of</strong><br />
recreation services. Areas <strong>of</strong> the <strong>City</strong> differ in ethnicity, <strong>of</strong> English language pr<strong>of</strong>iciency<br />
and economic need.<br />
The <strong>City</strong> <strong>of</strong>fers a full-range <strong>of</strong> arts and recreation program opportunities and services,<br />
comparable to what is <strong>of</strong>fered by neighboring communities. Programs include sports,<br />
aquatics, visual arts, performing arts, camps, golf, facility and picnic reservations,<br />
therapeutic recreation and partnerships with community groups, such as sports leagues.<br />
Recreation programs are continually monitored, evaluated and modified as appropriate.<br />
Increasing ethnic diversity in the <strong>City</strong> affects the promotion and communication <strong>of</strong><br />
recreation services. The <strong>City</strong> is committed to maximize access to facilities and art<br />
and recreation programs to ensure that people can utilize the services, facilities and<br />
amenities the <strong>City</strong> provides, regardless <strong>of</strong> income, age, disability, location <strong>of</strong> residence,<br />
or other category <strong>of</strong> need. Most <strong>of</strong>ferings are fee-based but with some no-cost or lowcost<br />
opportunities. Highlights <strong>of</strong> this programming include youth services, senior<br />
services and co-sponsored groups.<br />
Youth Services<br />
A youth services needs assessment led the way for a restructuring <strong>of</strong> after school<br />
programs to focus on those neighborhoods with the greatest need for after school<br />
activities. The creation <strong>of</strong> a mobile recreation program, Fun on the Run, provides local<br />
youth with an array <strong>of</strong> supervised, safe and structured recreational activities in their<br />
own neighborhoods.<br />
High school teen programs are located in the Fair Oaks Park building, providing a safe<br />
gathering place and performance venue for local teen talent. Programs feature live bands<br />
on a monthly basis for high school students living or attending school in Sunnyvale.<br />
Senior Center<br />
community chaRacteR — RecReation Chapter 4<br />
With the opening <strong>of</strong> the new Senior Center in 2003, there was an opportunity to adjust<br />
programming to take advantage <strong>of</strong> the new facility. Services now include a fitness room,<br />
a dedicated ballroom and comfortable and attractive common areas.<br />
The Senior Center is a special facility with activities targeted and limited for individuals<br />
50 and older. Membership is not required for participation in Senior Center activities,<br />
although a membership option is provided.<br />
4–29
<strong>City</strong> <strong>of</strong> Sunnyvale GeneRal plan – July <strong>2011</strong><br />
4–30<br />
Co-Sponsored Groups<br />
The <strong>City</strong>’s Co-sponsorship Policy underwent revision in 2003 and was replaced by a<br />
broader policy dealing with partnerships with outside groups and retitled “Relationships<br />
with Outside Groups.” Many <strong>of</strong> the <strong>City</strong>’s long-standing co-sponsored groups, such as<br />
youth sports leagues, have transitioned under this new policy to formal agreements<br />
with the <strong>City</strong> that define the special arrangements the <strong>City</strong> has with the various groups.<br />
Trends and Issues<br />
With finite resources—physical, personnel and financial—there seems to be an ever<br />
increasing demand for programming priorities and resource allocation. For every<br />
interest group served, another may go underserved. The following trends and issues<br />
affect the <strong>City</strong>’s recreation programs:<br />
n Prioritization <strong>of</strong> recreational services — Competition for resources between those<br />
with economic need or geographic need or “at risk.” After-school use: market-based<br />
demand in competition with community need.<br />
n Additional recreational services — Growth is being seen in new technologies and<br />
spread <strong>of</strong> new technologies, creating demand for new services or new methods <strong>of</strong><br />
delivering services. Time constraints on families are prevalent, with both parents<br />
working. Families are looking for activities they can do together. Communities are<br />
increasingly demanding web access to services/information.<br />
n Range <strong>of</strong> needs for senior recreation services — Multiple generations within the<br />
one rubric <strong>of</strong> “seniors,” challenging the “one size fits all” mentality. Frail seniors<br />
versus active seniors, with differing needs.<br />
n Contracting <strong>of</strong> services — Subcontracting to vendors using <strong>City</strong> facilities is<br />
increasing—agreements exist for swimming, gymnastics, dance, camps and food<br />
services, among others.<br />
n Changes in services and spaces for sports — Year–round play is increasingly<br />
common for individual sports as compared to set seasons. Sports for youth are<br />
shifting from recreational to more competitive programs. Longer seasons and nontraditional<br />
seasons for youth soccer and baseball have created greater demand for<br />
sports/athletic fields. Competing demands for fields also come from football, s<strong>of</strong>tball<br />
and cricket. Adult leagues are looking for athletic fields where they can play. Leagues<br />
would like the <strong>City</strong> to have enough <strong>of</strong> the right kinds <strong>of</strong> athletic fields to facilitate<br />
hosting <strong>of</strong> regional tournament play.<br />
n Businesses and their relationship to recreation — Local businesses have expressed<br />
a strong desire to have more community events that would attract people to the<br />
community and to their businesses. Demand by “day time only” business residents<br />
for recreational space.<br />
n Additional recreational areas — Skateboarders want places throughout the open<br />
space system for skating. BMX bike riders want places where they can refine their<br />
skills. Gardeners desire locations for providing community gardens.
community chaRacteR — RecReation Chapter 4<br />
Policies to achieve the Goal CC-10 (High-Quality Recreation Programming) are:<br />
policy cc-10.1 deSign PRogRAMS To MeeT The needS oF ReSidenTS,<br />
Allowing FoR non-ReSidenT PARTiCiPATion AS long AS iT doeS<br />
noT TAke AwAY FRoM oPPoRTuniTieS oR ReSouRCeS FoR ReSidenTS<br />
(exCePTionS ARe SeRviCeS ThAT ARe inTended To SeRve AS PRoFiT<br />
CenTeRS, SuCh AS golF And TenniS, whiCh ARe AddReSSed in<br />
The FiSCAl MAnAgeMenT Sub-eleMenT). (Previously Open Space and<br />
Recreation Policy 2.2.B.1)<br />
policy cc-10.2 PRovide SChool-Aged YouTh-oRienTed ReCReATion<br />
And enRiChMenT PRogRAMS And SeRviCeS duRing non-SChool<br />
houRS. (Previously Open Space and Recreation Policy 2.2.B.2)<br />
policy cc-10.3 PRovide ReCReATion And enRiChMenT PRogRAMS And<br />
SeRviCeS FoR SChool-Aged YouTh duRing SChool houRS, SuCh AS<br />
duRing ReCeSS oR lunCh PeRiodS, onlY bY SPeCiAl AgReeMenT APPRoved<br />
bY CiTY CounCil. (Previously Open Space and Recreation Policy 2.2.B.3.)<br />
policy cc-10.4 uSe enTRePReneuRiAl STRATegieS To idenTiFY<br />
And ReACh new MARkeTS FoR PRogRAMS, SeRviCeS And Revenue<br />
geneRATion, And To STRengThen RelATionShiPS wiThin exiSTing<br />
MARkeTS. (Previously Open Space and Recreation Policy 2.2.B.4.)<br />
policy cc-10.5 develoP And iMPleMenT PRogRAMS in oRdeR To MeeT The<br />
develoPMenTAl And SoCiAl needS oF SPeCiFiC TARgeTed PoPulATionS<br />
(e.g., YouTh, TeenS, SenioRS, diSAbled). (Previously Policy 2.2.B.5.)<br />
4–31
<strong>City</strong> <strong>of</strong> Sunnyvale GeneRal plan – July <strong>2011</strong><br />
4–32<br />
policy cc-10.6 leveRAge AvAilAble ReSouRCeS bY PuRSuing Co-<br />
Funded And/oR CooPeRATive AgReeMenTS FoR PRoviSion And<br />
MAinTenAnCe oF PRogRAMS, FACiliTieS, And SeRviCeS, in oRdeR<br />
To MAxiMize beneFiTS To The CoMMuniTY. PARTneRS MAY inClude,<br />
buT ARe noT liMiTed To, SChool diSTRiCTS, non-PRoFiT gRouPS,<br />
goveRnMenTAl AgenCieS And buSineSSeS. (Previously Open Space and<br />
Recreation Policy 2.2.B.6.)<br />
policy cc-10.7 enCouRAge The uSe oF ReCReATionAl And oPen SPACe<br />
FACiliTieS And SeRviCeS FoR eduCATionAl ACTiviTieS oF SChoolS ThAT<br />
SeRve SunnYvAle STudenTS FiRST, And SeCondARilY The SChoolS<br />
ThAT SeRve STudenTS oF SuRRounding CoMMuniTieS. (Previously Open<br />
Space and Recreation Policy 2.2.B.7.)<br />
Policies to achieve the Goal CC-11(Wide Range <strong>of</strong> Recreation Programming) are:<br />
policy cc-11.1 give PRioRiTY To The Following SeRviCeS, FACiliTieS<br />
And AMeniTieS ThAT (Previously Policy 2.2.D.1. through D.5, D.7)<br />
n are not readily available through other providers within or near Sunnyvale.<br />
n benefiting under-served populations as identified in the U.S. Census and through<br />
community input.<br />
n fulfill a basic need or teach basic skills (e.g., non-competitive, developmental<br />
sports instruction such as learn to swim given priority over competitive sports<br />
programming).<br />
n in which the community demonstrates interest.<br />
n benefit a greater number <strong>of</strong> residents.<br />
n can be used by multiple users or serve multiple purposes.
policy cc-11.2 give PRioRiTY To goveRnMenTAl enTiTieS, SChoolS<br />
And non-PRoFiTS. (Previously Policy 2.2.D.6.)<br />
policy cc-11.3 give PRioRiTY To ACQuiRing/develoPing oPen SPACe<br />
And ReCReATionAl AMeniTieS And PRogRAMS in AReAS: (Previously<br />
Policy 2.2.D.8 through D.13)<br />
n Which are heavily impacted by daytime or business use<br />
n Where similar amenities and programs do not already exist<br />
n Where the current number <strong>of</strong> households within specified distances relying on the<br />
open space or recreational amenity is greater.<br />
n Where the projected number <strong>of</strong> households within specified distances which will be<br />
relying on the open space or recreational amenity is greater<br />
n Where the needs are greatest and/or which will meet the greatest needs.<br />
community chaRacteR — RecReation Chapter 4<br />
n At school sites that, if sold by the District for purposes other than open space, would<br />
represent a serious loss to the <strong>City</strong>’s ability to meet its open space and recreation goals.<br />
policy cc-11.4 give PRioRiTY To SAFeTY FiRST when PeRFoRMing<br />
MAinTenAnCe on FACiliTieS And wiThin The oPen SPACe SYSTeM,<br />
Followed bY uSAbiliTY And Then bY ATTRACTiveneSS, ReCognizing<br />
ThAT ATTRACTiveneSS iS oFTen A FACToR in uSAbiliTY. (Previously Policy<br />
2.2.D.14)<br />
4–33
<strong>City</strong> <strong>of</strong> Sunnyvale GeneRal plan – July <strong>2011</strong><br />
4–34<br />
Policies to achieve the Goal CC-12 (Maximum Access To Recreation Services, Facilities<br />
And Amenities) are:<br />
policy cc-12.1 loCATe SeRviCeS AT SChoolS, PARkS And ReCReATionAl<br />
FACiliTieS ThRoughouT The CiTY And uTilize STRATegieS, SuCh AS The<br />
Mobile ReCReATion ConCePT, To MAke PRogRAMS geogRAPhiCAllY<br />
ACCeSSible. (Previously Policy 2.2.E.1.)<br />
policy cc-12.2 CoMPlY wiTh The AMeRiCAnS wiTh diSAbiliTieS ACT,<br />
And CReATe An enviRonMenT oF inCluSion in All ReCReATion<br />
PRogRAMS wheRe ReASonAble. (Previously Policy 2.2.E.2)<br />
policy cc-12.3 PRovide ReCReATion And enRiChMenT PRogRAMS,<br />
SeRviCeS, FACiliTieS And AMeniTieS To undeRSeRved AReAS And/oR<br />
PoPulATionS oF The CiTY. undeRSeRved AReAS And/oR PoPulATionS<br />
Could be due To FACToRS SuCh AS: geogRAPhY, gendeR, eConoMiCS<br />
oR eThniCiTY. (Previously Policy 2.2.E.3)<br />
policy cc-12.4 Allow oPPoRTuniTieS FoR non-ReSeRved,<br />
unSTRuCTuRed uSe oF oPen SPACe. (Previously Policy 2.2.E.8)
community chaRacteR — RecReation Chapter 4<br />
policy cc-12.5 Allow in-line SkATing, biCYCleS And SkATeboARding<br />
on hARd-SuRFACe SidewAlkS And PAThwAYS ThRoughouT The<br />
PARk SYSTeM, AS long AS The SkATeboARdeRS, CYCliSTS And in-line<br />
SkATeRS do noT PoSe A hAzARd To TheMSelveS oR oTheR FoRMS oF<br />
TRAFFiC SuCh AS PedeSTRiAnS oR JoggeRS. (Previously Policy 2.2.E.9)<br />
policy cc-12.6 PRovide PubliC ACCeSS To oRChARd heRiTAge PARk<br />
To The gReATeST exTenT PoSSible while MeeTing The goAl oF<br />
MAinTAining A woRking FRuiT oRChARd AT The PARk. (Previously Policy<br />
2.2.E.10)<br />
4–35
chapteR 5<br />
housinG<br />
The following chapter is a summary <strong>of</strong> the Housing and Community<br />
Revitalization Sub-element. For the full text <strong>of</strong> the element, please see<br />
Appendix E.
Below Market Rate Units are integrated into new housing developments such as this one on Evelyn Avenue.
houSinG<br />
Under the requirements <strong>of</strong> California Housing Element law (Government Code Section<br />
65302), local governments are required to adequately plan for the existing and projected<br />
housing needs <strong>of</strong> all economic segments <strong>of</strong> the community. The law recognizes that<br />
in order for the private market to adequately address housing needs and demand,<br />
local governments must adopt land use plans and regulatory systems that provide<br />
opportunities for, and do not unduly constrain, housing development. As a result, state<br />
housing policy rests largely upon the effective implementation <strong>of</strong> local General Plans<br />
and in particular, local Housing Elements. Housing element statues also require the<br />
Department <strong>of</strong> Housing and Community Development (HCD) to review local housing<br />
elements for compliance with state law and to report its findings to the local government.<br />
Housing Element statutes require that each city and county develop local housing<br />
programs to meet a “fair share” <strong>of</strong> existing and future housing needs for all income groups.<br />
The Association <strong>of</strong> Bay Area Governments (ABAG) is responsible for developing and<br />
assigning these regional housing needs assessments, or “RHNA”, to Bay Area jurisdictions.<br />
Pursuant to the current RHNA planning period, the Sunnyvale Housing and Community<br />
Revitalization Sub-element is a five-year plan extending from 2009-2014.<br />
The policy basis for Sunnyvale’s current and future housing actions is the Housing<br />
and Community Revitalization Sub-element <strong>of</strong> the General Plan. The Sunnyvale <strong>City</strong><br />
Council adopted the current Housing and Community Revitalization Sub-element<br />
<strong>of</strong> the General Plan on June 15, 2009. The adopted Element is a separate document<br />
that is not contained within the main body <strong>of</strong> the consolidated version <strong>of</strong> the General<br />
Plan; however, it is available separately as Appendix E. Users <strong>of</strong> this General Plan<br />
should consult the full text <strong>of</strong> the Housing Element for the data and analysis, as well as<br />
action programs and other information. The goals and policies, and a summary <strong>of</strong> the<br />
discussion are below.<br />
Goal he-1<br />
adeQuate houSinG<br />
ASSiST in The PRoviSion oF AdeQuATe houSing To MeeT The diveRSe needS<br />
oF SunnYvAle’S houSeholdS oF All inCoMe levelS. (Housing and Community<br />
Revitalization Goal A / Adopted In 2009)<br />
Sunnyvale has long been a regional leader in addressing housing issues, enacting its<br />
Below Market Rate (BMR) ordinance in 1980, followed by its Housing Mitigation<br />
Program in 1983. Housing is one <strong>of</strong> the most difficult challenges facing cities in Silicon<br />
Valley. The need for more affordable housing is critical: its symptoms surface in<br />
the shape <strong>of</strong> congested highways, the needs <strong>of</strong> homeless people, an exodus <strong>of</strong> young<br />
people from the area, and the constraints faced by local businesses in attracting new<br />
employees. Sunnyvale has also been active in addressing issues <strong>of</strong> neighborhood quality.<br />
The continued vitality <strong>of</strong> the community depends, in part, on the need to preserve and<br />
enhance residential areas.<br />
housinG Chapter 5<br />
Go to GeneralPlan.<br />
InSunnyvale.com for the<br />
full text <strong>of</strong> the housing and<br />
Community revitalization<br />
Sub-element.<br />
5–3
<strong>City</strong> <strong>of</strong> Sunnyvale GeneRal plan – July <strong>2011</strong><br />
See Goal lt-4 (appropriate<br />
Housing) for further<br />
information and policies on<br />
residential land uses. See<br />
Goal He-4 (adequate Housing<br />
sites) for further information<br />
and policies on potential<br />
housing sites.<br />
5–4<br />
Provisions for a Variety <strong>of</strong> housing<br />
Housing element law specifies that jurisdictions must identify adequate sites to be made<br />
available through appropriate zoning and development standards to encourage the<br />
development <strong>of</strong> various types <strong>of</strong> housing for all economic segments <strong>of</strong> the populations.<br />
This includes single-family homes, multi-family housing, factory-built housing, mobile<br />
homes, single-room occupancy housing, emergency shelters and transitional housing<br />
among others. The <strong>City</strong>’s Zoning Code provides for a variety <strong>of</strong> housing types and<br />
zoning districts.<br />
Available Affordable housing funds<br />
Using local Housing Mitigation Fund and HOME entitlement grant funds, the <strong>City</strong><br />
can finance the construction <strong>of</strong> new affordable housing in Sunnyvale. This financing<br />
also includes assistance to nonpr<strong>of</strong>it developers for various typical development costs,<br />
such as: site assembly, clearance, acquisition, predevelopment/design, construction,<br />
and/or related project costs. The <strong>City</strong> prioritizes development assistance to support<br />
the provision <strong>of</strong> housing for extremely low (ELI), very low (VLI) and low income (LI)<br />
households.<br />
Community Development Block Grant (CDBG)<br />
The CDBG program provides funding for housing and housing-related activities<br />
including acquisition <strong>of</strong> property and land, rehabilitation, removal <strong>of</strong> barriers, fair<br />
housing services, and public services benefiting lower income households. Because<br />
CDBG cannot be used for new construction, Sunnyvale directs most <strong>of</strong> its CDBG funds<br />
available to support housing towards land acquisition, single-family and multi-family<br />
housing rehabilitation, and housing improvement programs. Sunnyvale receives a<br />
CDBG grant as an entitlement city, but the amount varies depending on how much is<br />
allocated to the program in the federal budget.<br />
Below Market Rate (BMR) Program<br />
Sunnyvale began implementation <strong>of</strong> the Below Market Rate (BMR) Program, one <strong>of</strong> the<br />
oldest inclusionary housing programs in the country, in the early 1980s. The last major<br />
revision was in 2003, with the current ordinance requiring residential developments to<br />
provide a certain percentage <strong>of</strong> affordable units.<br />
housing Mitigation fee<br />
Since 1983, the <strong>City</strong> has collected a Housing Mitigation fee from specified industrial<br />
and commercial developments as a means <strong>of</strong> mitigating the impact <strong>of</strong> job-producing<br />
development on the demand for affordable housing. Funds are available for acquisition,<br />
rehabilitation, new construction, preservation <strong>of</strong> at-risk housing, and predevelopment<br />
costs for affordable housing. Mitigation funds have also been used to fund the Santa<br />
Clara County Housing Trust Fund, <strong>City</strong> first time homebuyer programs, and essential<br />
workers homeownership programs.
Sunnyvale supports the provision <strong>of</strong> low-income housing, including this development in the southern part<br />
<strong>of</strong> the <strong>City</strong>.<br />
first Time homebuyer Loan Program<br />
The <strong>City</strong> has provided a First Time Homebuyer Program (FTHB) since 2005 to help lowincome<br />
first-time homebuyers purchase market-rate or Below Market Rate properties.<br />
Low-interest, deferred second mortgage loans (“silent seconds”) are currently provided<br />
through the FTHB program. Staff also continues to coordinate with the County<br />
Housing Authority to secure Mortgage Credit Certificates (MCCs) for income-eligible<br />
homebuyers in the <strong>City</strong> <strong>of</strong> Sunnyvale.<br />
Affordable housing Density Bonus<br />
The <strong>City</strong> <strong>of</strong>fers density increases <strong>of</strong> at least 25 percent over the otherwise maximum<br />
density in the zone in exchange for the provision <strong>of</strong> 10 percent very low-income units,<br />
20 percent low-income units, or 50 percent age restricted units. Rents in density bonus<br />
units must remain affordable for at least 55 years.<br />
The state legislature has amended Section 65915 <strong>of</strong> the California Government Code<br />
which regulates affordable housing density bonuses, providing a tiered system <strong>of</strong><br />
density bonuses ranging from 20-35 percent and up to three development incentives/<br />
concessions, depending on the proportion <strong>of</strong> affordable units and level <strong>of</strong> income<br />
targeting. Sunnyvale’s current density bonus provisions indicate any updates to<br />
Government Code Section 65915 supersede any inconsistencies created in the local<br />
ordinance.<br />
housinG Chapter 5<br />
5–5
<strong>City</strong> <strong>of</strong> Sunnyvale GeneRal plan – July <strong>2011</strong><br />
5–6<br />
housing Trust fund <strong>of</strong> Santa Clara County (hTSCC)<br />
HTSCC is a nonpr<strong>of</strong>it 501(c)(3) community-based organization created in 2001<br />
through a cooperative effort <strong>of</strong> the private and public sectors, including the Housing<br />
Collaborative on Homelessness and Affordable Housing, the Silicon Valley Leadership<br />
Group, Santa Clara County, Community Foundation Silicon Valley, and all 15 towns<br />
and cities within Santa Clara County. The purpose <strong>of</strong> the Trust is to increase the supply<br />
<strong>of</strong> affordable housing in Santa Clara County within three program areas: first-time<br />
homebuyer assistance, multi-family rental housing, and homeless with special needs.<br />
Funds are available for acquisition, rehabilitation, new construction, predevelopment<br />
costs, and supportive housing services.<br />
policy He-1.1 enCouRAge diveRSiTY in The TYPe, Size, PRiCe And<br />
TenuRe oF ReSidenTiAl develoPMenT in SunnYvAle, inCluding<br />
Single-FAMilY hoMeS, TownhoMeS, APARTMenTS, Mixed-uSe houSing,<br />
TRAnSiT-oRienTed develoPMenT And live-woRk houSing. (Housing<br />
Policy A.1)<br />
policy He-1.2 FACiliTATe The develoPMenT oF AFFoRdAble houSing<br />
ThRough RegulAToRY inCenTiveS And ConCeSSionS, And/oR<br />
FinAnCiAl ASSiSTAnCe. (Housing Policy A.2)<br />
policy He-1.3 uTilize The below MARkeT RATe (bMR) houSing<br />
ReQuiReMenTS AS A Tool To inTegRATe AFFoRdAble uniTS wiThin<br />
MARkeT RATe develoPMenTS, And inCReASe The AvAilAbiliTY oF<br />
AFFoRdAble houSing ThRoughouT The CoMMuniTY. (Housing Policy A.3)<br />
policy He-1.4 ConTinue To ReQuiRe oFFiCe And induSTRiAl<br />
develoPMenT To MiTigATe The deMAnd FoR AFFoRdAble houSing.<br />
(Housing Policy A.4)
policy He-1.5 woRk wiTh SunnYvAle’S MAJoR eMPloYeRS,<br />
eduCATionAl And heAlTh CARe inSTiTuTionS To FACiliTATe And<br />
enCouRAge The develoPMenT oF woRkFoRCe houSing. PRoMoTe<br />
The CiTY’S AFFoRdAble houSing PRogRAMS wiTh loCAl eMPloYeRS.<br />
(Housing Policy A.5)<br />
policy He-1.6 PRovide FiRST TiMe hoMebuYeR ASSiSTAnCe To low<br />
And ModeRATe inCoMe houSeholdS, wiTh PRioRiTY To buYeRS who<br />
CuRRenTlY woRk And/oR live in SunnYvAle. (Housing Policy A.6)<br />
policy He-1.7 SuPPoRT CollAboRATive PARTneRShiPS wiTh non-<br />
PRoFiT oRgAnizATionS, AFFoRdAble houSing buildeRS, And FoR-<br />
PRoFiT develoPeRS To gAin gReATeR ACCeSS To vARiouS SouRCeS oF<br />
AFFoRdAble houSing FundS. (Housing Policy A.7)<br />
Goal he-2<br />
enhanCed houSinG ConditionS and affordaBility<br />
MAinTAin And enhAnCe The CondiTionS And AFFoRdAbiliTY oF exiSTing<br />
houSing in SunnYvAle. (Housing and Community Revitalization Goal B /<br />
Adopted In 2009)<br />
To maintain and enhance the conditions and affordability <strong>of</strong> existing housing in<br />
Sunnyvale, the <strong>City</strong> supports neighborhood preservation and rehabilitation programs,<br />
nonpr<strong>of</strong>it housing organizations and affordable housing options.<br />
Neighborhood Preservation and Rehabilitation Programs<br />
Programs with Community Development Block Grant (CDBG) and hOME funds<br />
Through the CDBG and HOME programs, the U.S. Department <strong>of</strong> Housing and<br />
Urban Development (HUD) provides funds to local governments for a wide range <strong>of</strong><br />
community development activities for low-income persons. Funds can be used for a<br />
wide array <strong>of</strong> activities, including housing rehabilitation, lead-based paint detection<br />
and removal, and accessibility grants.<br />
housinG Chapter 5<br />
5–7
<strong>City</strong> <strong>of</strong> Sunnyvale GeneRal plan – July <strong>2011</strong><br />
5–8<br />
Emergency Loan Program<br />
The Emergency Loan Program provides emergency repair grants and low-interest loans<br />
to fund critical health and safety repairs for low-income homeowners. These grants and<br />
loans can be used for the following necessary repairs: burst pipes; water heater repairs;<br />
heating repairs; sewer line repair or replacement; or any other repair that affects the<br />
immediate health and safety <strong>of</strong> the household.<br />
Multi-family Rental Property Rehabilitation<br />
The Multi-Family Rental Property Rehabilitation Program provides low-interest loans<br />
to address code violations and general improvement and updates to multi-family rental<br />
housing structures. Property owners must agree to maintain affordable rents following<br />
rehabilitation <strong>of</strong> the property.<br />
Neighborhood Enhancement Action Team (NEAT)<br />
The <strong>City</strong> began implementing the NEAT in 2002, focusing code compliance and housing<br />
rehabilitation improvements in single-family neighborhoods showing signs <strong>of</strong> distress.<br />
Neighborhoods are evaluated by an inter-departmental team including Community<br />
Development, Public Works, and Public Safety staff, and are selected based on the<br />
incidence <strong>of</strong> code violations, the age <strong>of</strong> the housing stock, crime statistics, and other<br />
factors impacting neighborhood revitalization. Once a Neighborhood Enhancement<br />
area has been selected, staff begins by visiting every household to provide information<br />
on the improvement program for the neighborhood and to solicit input on any particular<br />
community concerns.<br />
policy He-2.1 enCouRAge PRoPeRTY owneRS To MAinTAin RenTAl And<br />
owneRShiP uniTS in Sound CondiTion ThRough The neighboRhood<br />
PReSeRvATion And RehAbiliTATion PRogRAMS. (Housing Policy B.1)<br />
policy He-2.2 PRovide CoMMuniTY ouTReACh And CoMPRehenSive<br />
neighboRhood iMPRoveMenT PRogRAMS wiThin SunnYvAle’S<br />
neighboRhood enhAnCeMenT AReAS To iMPRove houSing<br />
CondiTionS And The oveRAll QuAliTY oF liFe. (Housing Policy B.2)<br />
Nonpr<strong>of</strong>it housing Organizations<br />
The <strong>City</strong> assists nonpr<strong>of</strong>it housing corporations in acquiring and/or rehabilitating aging<br />
multi-family rental properties, in order to preserve or improve affordability, correct<br />
health and safety code violations, and address deferred maintenance.
policy He-2.3 STRengThen MulTi-FAMilY neighboRhoodS ThRough<br />
PARTneRShiP wiTh non-PRoFiT houSing oRgAnizATionS in The<br />
ACQuiSiTion And RehAbiliTATion oF oldeR ReSidenTiAl PRoPeRTieS And<br />
MAinTenAnCe AS long TeRM AFFoRdAble houSing. (Housing Policy B.3)<br />
policy He-2.4 woRk wiTh PRoPeRTY owneRS, TenAnTS And non-PRoFiT<br />
PuRChASeRS To FACiliTATe The PReSeRvATion oF PubliClY-ASSiSTed<br />
RenTAl houSing To MAinTAin AFFoRdAbiliTY To loweR inCoMe<br />
houSeholdS. (Housing Policy B.4)<br />
Affordable housing Options<br />
Section 8 Rental Assistance Program<br />
The Section 8 Rental Assistance Program extends rental subsidies to very low-income<br />
households, including families, seniors, and the disabled. The Section 8 Program <strong>of</strong>fers<br />
a voucher that pays the difference between the current fair market rent (FMR) and what<br />
a tenant can afford to pay (i.e. 30 percent <strong>of</strong> household income). The voucher allows<br />
a tenant to choose housing that costs more than the payment standard, provided the<br />
tenant pays the extra cost.<br />
policy He-2.5 SuPPoRT The PRoviSion oF RenTAl ASSiSTAnCe bY<br />
The SAnTA ClARA CounTY houSing AuThoRiTY To loweR inCoMe<br />
houSeholdS. (Housing and Community Revitalization Policy B.5)<br />
Mobile home Park Zoning District<br />
The <strong>City</strong> has established a designated mobile home park zoning district. Currently, 13<br />
<strong>of</strong> the <strong>City</strong>’s 16 parks, comprising a total <strong>of</strong> 420 acres, are zoned for long-term mobilehome<br />
use. Chapter 19.72 <strong>of</strong> the Municipal Code regulates the conversion <strong>of</strong> mobile home<br />
parks to other uses, including requirements for preparation <strong>of</strong> a conversion impact<br />
report, tenant noticing and public hearing requirements, and payment <strong>of</strong> relocation<br />
assistance to displaced tenants.<br />
housinG Chapter 5<br />
5–9
<strong>City</strong> <strong>of</strong> Sunnyvale GeneRal plan – July <strong>2011</strong><br />
See Goal He-1 (adequate<br />
Housing) for further<br />
discussion <strong>of</strong> the BMr<br />
program and other affordable<br />
housing options.<br />
5–10<br />
policy He-2.6 PReSeRve SunnYvAle’S Mobile hoMe PARkS AS An<br />
AFFoRdAble houSing oPTion. MAinTAin AT leAST 400 ACReS oF Mobile<br />
hoMe PARk zoning. (Housing and Community Revitalization Policy B.6)<br />
Condominium Conversions<br />
Apartment projects proposed for conversion to condominium ownership are subject to<br />
the <strong>City</strong>’s Condominium Conversion regulations (Sunnyvale Municipal Code Chapter<br />
19.70). These regulations set forth a series <strong>of</strong> tenant protections, including relocation<br />
provisions, limitations on tenant rent increases, and first right <strong>of</strong> refusal, among other<br />
provisions. The regulations limit the number <strong>of</strong> conversions to 175 units in any 12-month<br />
period and require a citywide rental vacancy rate above three percent, unless otherwise<br />
approved by the Planning Commission. Condominium conversions are now also subject<br />
to the 12.5 percent affordability requirement under the <strong>City</strong>’s BMR provisions.<br />
policy He-2.7 RegulATe The ConveRSion oF RenTAl APARTMenTS To<br />
CondoMiniuM owneRShiP, And onlY PeRMiT ConveRSionS when<br />
The CiTYwide vACAnCY RATe FoR RenTAl uniTS wARRAnTS, And A<br />
beneFiT To The oveRAll houSing SuPPlY CAn be Shown. (Housing and<br />
Community Revitalization Policy B.7)<br />
Goal he-3<br />
MiniMiZed GovernMental ConStraintS on houSinG<br />
MiniMizeS The iMPACT oF goveRnMenTAl ConSTRAinTS on The MAinTenAnCe,<br />
iMPRoveMenT And develoPMenT oF houSing. (Housing and Community<br />
Revitalization Goal C / Adopted In 2009)<br />
The provision <strong>of</strong> adequate and affordable housing opportunities is an important goal<br />
<strong>of</strong> the <strong>City</strong>. However, there are a variety <strong>of</strong> governmental factors that can encourage or<br />
constrain the development, maintenance and improvement <strong>of</strong> housing stock in Sunnyvale.<br />
Governmental controls can fall into the following categories: land use controls, flexible<br />
zoning standards, and provisions for a variety <strong>of</strong> housing, development permit procedures,<br />
fees and exactions, building codes and their enforcements and site improvements.
Overview <strong>of</strong> Governmental Constraints<br />
Land Use Controls<br />
The <strong>City</strong>’s Land Use and Transportation chapter <strong>of</strong> the General Plan sets forth <strong>City</strong>’s<br />
policies for guiding local development. These policies, together with existing zoning<br />
regulations, establish the amount and distribution <strong>of</strong> land allocated for different uses.<br />
Sunnyvale provides for a mix <strong>of</strong> residential developments with densities ranging from<br />
less than 7 dwelling units/acre up to 78 dwelling units/acre in the Downtown Specific<br />
Plan area. The <strong>City</strong> uses a variety <strong>of</strong> land use controls to regulate and promote housing<br />
in Sunnyvale, including residential development standards, ITR districts and the<br />
Downtown Specific Plan and parking requirements.<br />
flexible Zoning Standards<br />
Sunnyvale has adopted several provisions in the Zoning Code that facilitate a range<br />
<strong>of</strong> residential development types and can lower the cost <strong>of</strong> developing housing. These<br />
mechanisms include mixed-use development provisions, Industrial to Residential (ITR)<br />
zoning, the Below-Market Rate (BMR) Program, density bonuses, and other provisions<br />
for small lot development.<br />
Provisions for a Variety <strong>of</strong> housing<br />
Housing element law specifies that jurisdictions must identify adequate sites to be made<br />
available through appropriate zoning and development standards to encourage the<br />
development <strong>of</strong> various types <strong>of</strong> housing for all economic segments <strong>of</strong> the population.<br />
This includes single-family homes, accessory living units, multi-family housing, factorybuilt<br />
housing, mobile homes, single-room occupancy housing, emergency shelters and<br />
transitional housing among others.<br />
Development Permit Procedures<br />
The development review process, although necessary to ensure the development is<br />
safe and in compliance with local, regional and state regulations and Zoning Code<br />
requirements, can sometimes lead to delays in projects and increase costs.<br />
Under the current Use Permit process, once an application is deemed complete, multifamily<br />
development applications can be scheduled for hearing in approximately one to<br />
two months. Average permit processing times to obtain a permit to construct a new<br />
single-family residence on a legal lot range between one to three months depending on<br />
the types <strong>of</strong> permits required. The <strong>City</strong> <strong>of</strong> Sunnyvale lays a strong emphasis on customer<br />
service and satisfaction and processes set in place are designed for expedited processing<br />
<strong>of</strong> all planning and building permits.<br />
fees and Exactions<br />
housinG Chapter 5<br />
The <strong>City</strong> <strong>of</strong> Sunnyvale collects various fees from developments to cover the costs <strong>of</strong><br />
processing permits and providing the necessary services and infrastructure related to<br />
new development projects. According to the Home Builders Association <strong>of</strong> Northern<br />
California 2006-2007, Sunnyvale’s fees were the second lowest <strong>of</strong> eight jurisdictions<br />
surveyed in the south bay for both single-family and multi-family projects. Sunnyvale’s 5–11
<strong>City</strong> <strong>of</strong> Sunnyvale GeneRal plan – July <strong>2011</strong><br />
5–12<br />
development fees are comparable if not lower than those charged in surrounding<br />
communities and are not considered a constraint to housing development in this area.<br />
Building Codes and their Enforcement<br />
The <strong>City</strong> <strong>of</strong> Sunnyvale typically adopts the International Building Code, as amended by<br />
California’s Building Regulations (Title 24), which establishes standards and requires<br />
inspections at various stages <strong>of</strong> construction to ensure code compliance. The <strong>City</strong>’s<br />
building code also requires new residential construction to comply with the federal<br />
American with Disabilities Act (ADA), which specifies a minimum percentage <strong>of</strong><br />
dwelling units in new developments that must be fully accessible to the physically<br />
disabled. Although these new standards and the time required for inspections increase<br />
housing production costs and may impact the viability <strong>of</strong> rehabilitation <strong>of</strong> older<br />
properties which are required to be brought up to current code standards, the intent <strong>of</strong><br />
the codes is to provide structurally sound, safe and energy-efficient housing.<br />
Site Improvements<br />
The Sunnyvale Zoning Code requires housing developers to provide <strong>of</strong>f-street parking,<br />
wiring for electrical and telecommunications, and open space for all residential<br />
development. For multifamily units, developers are also required to provide secure<br />
storage space and landscaping. The Subdivision Code requires the installation <strong>of</strong> a<br />
variety <strong>of</strong> public infrastructure elements, including curbs and gutters, sidewalks, water<br />
distribution systems, storm drainage channels, and other improvements. While these<br />
requirements all increase the cost <strong>of</strong> housing, they are consistent with current market<br />
demand and similar to requirements in other Bay Area communities.<br />
policy He-3.1 MoniToR All RegulATionS, oRdinAnCeS, dePARTMenTAl<br />
PRoCeSSing PRoCeduReS And FeeS RelATed To The RehAbiliTATion And<br />
ConSTRuCTion oF houSing uniTS To ASSeSS The iMPACT on houSing<br />
CoSTS And/oR FuTuRe SuPPlY. (Housing and Community Revitalization Policy C.1)<br />
Special Issues<br />
Emergency Shelter and Services<br />
Through its CDBG public services sub-recipient grant program, Sunnyvale provides<br />
funding for emergency services, counseling, food, clothing and financial assistance for<br />
low income residents in crisis or at risk <strong>of</strong> homelessness. The <strong>City</strong> has also provided<br />
funding support to area nonpr<strong>of</strong>it agencies that provide shelter and homeless services.
policy He-3.2 ReviSe The CiTY’S zoning Code To ClARiFY PRoviSionS<br />
FoR SuPPoRTive And TRAnSiTionAl houSing, And eMeRgenCY<br />
ShelTeRS. (Housing and Community Revitalization Policy C.2)<br />
Modified Parking Standards for Special Needs and Transit-Oriented housing:<br />
Residential parking requirements play a significant role in project design and achievable<br />
densities. Sunnyvale does not currently have specific parking standards for senior or<br />
disabled housing, and evaluates parking reductions on a case-by-case basis. As a means<br />
<strong>of</strong> encouraging these housing types and providing greater certainty to developers,<br />
the <strong>City</strong> will develop modified parking standards for special needs housing. The <strong>City</strong><br />
evaluates a series <strong>of</strong> incentives to facilitate high-density housing, employment and<br />
mixed use development, including measures such as supportive zoning changes and<br />
parking strategies.<br />
policy He-3.3 eSTAbliSh ReduCed PARking STAndARdS FoR SPeCiAl<br />
needS houSing, And houSing in CloSe PRoxiMiTY To PubliC TRAnSiT.<br />
(Housing and Community Revitalization Policy C.3)<br />
Goal he-4<br />
adeQuate houSinG SiteS<br />
PRovide AdeQuATe SiTeS FoR The develoPMenT oF new houSing ThRough<br />
APPRoPRiATe lAnd uSe And zoning To AddReSS The diveRSe needS oF<br />
SunnYvAle’S ReSidenTS And woRkFoRCe (Housing and Community Revitalization<br />
Goal D / Adopted In 2009)<br />
An important component <strong>of</strong> the Housing Element is the identification <strong>of</strong> adequate sites<br />
for future housing development, and evaluation <strong>of</strong> the adequacy <strong>of</strong> these sites in fulfilling<br />
the <strong>City</strong>’s share <strong>of</strong> regional housing needs. These regional housing needs are determined<br />
by the Association <strong>of</strong> Bay Area Governments (ABAG) through their Regional Housing<br />
Needs Assessment (RHNA). The RHNA assigns the minimum number <strong>of</strong> housing<br />
units each community is required to plan for by providing “adequate sites” through the<br />
general plan and zoning.<br />
housinG Chapter 5<br />
5–13
<strong>City</strong> <strong>of</strong> Sunnyvale GeneRal plan – July <strong>2011</strong><br />
5–14<br />
The <strong>City</strong> plans to fulfill its share <strong>of</strong> regional housing needs using a combination <strong>of</strong> the<br />
following methods:<br />
n Residential construction during the RHNA “gap period” (January 2007 – December<br />
2008)<br />
n Vacant and underdeveloped sites;<br />
n Key residential blocks within the Downtown Specific Plan<br />
n Sites zoned “Industrial to Residential (ITR); and<br />
n Residential development with the Lakeside Specific Plan.<br />
Based on these areas, the <strong>City</strong>’s residential sites inventory provides for a total <strong>of</strong> 6,633<br />
units. Parcel specific site inventories are included in the Housing and Community<br />
Revitalization Sub-element, Appendix B. A brief description <strong>of</strong> each <strong>of</strong> these areas is<br />
provided below.<br />
Residential Sites Inventory<br />
Residential Construction during the RhNA “gap period”<br />
Residential projects in various stages <strong>of</strong> development during the “gap period” can<br />
accommodate over 20 percent <strong>of</strong> Sunnyvale’s 4,426 RHNA. In addition to these<br />
projects, Sunnyvale’s residential sites capacity provides for the realistic development <strong>of</strong><br />
6,856 additional units, including sites suitable for development <strong>of</strong> 2,291 lower-income<br />
units, 3,524 moderate-income units and 1,041 above-moderate-income units, reviewed<br />
in detail in the following sections.<br />
Vacant and Underutilized Residential Sites<br />
Only one vacant residential site remains in Sunnyvale: the 19 acre “Corn Palace” site<br />
located along Lawrence Expressway. Based on the existing low-density and low-medium<br />
density designations, and an assumption that 25 percent <strong>of</strong> the land area would go towards<br />
new public streets, approximately 150 new units can be accommodated on this site.<br />
Throughout most <strong>of</strong> Sunnyvale’s residential zoning districts, there are approximately 42<br />
acres <strong>of</strong> older, underutilized properties developed with fewer units than are permitted<br />
under zoning. These lots are an important source for future housing. Using a series<br />
<strong>of</strong> development assumptions, these properties can accommodate a net increase in 626<br />
new units. The greatest opportunity for additional units lies in the medium-density<br />
R-3 zoning districts and high-density R-4 zoning districts where condominiums,<br />
townhomes, and apartments are the preferred development types.<br />
Industrial to Residential (ITR) Sites<br />
The 1993 Futures Study identified several <strong>of</strong> the <strong>City</strong>’s older underutilized industrial<br />
sites for planned redevelopment with residential uses, while directing higher intensity<br />
industrial development to other areas more suitable over the long-term for such uses.<br />
The result <strong>of</strong> the Futures Study was the establishment <strong>of</strong> the Industrial to Residential<br />
Combining District (ITR), the purpose <strong>of</strong> which is to allow industrial, <strong>of</strong>fice, commercial
and residential uses to existing within the same zoning district, and to encourage ITR<br />
areas to gradually convert to residential uses.<br />
There are currently eight key ITR areas throughout the <strong>City</strong>, the majority <strong>of</strong> which<br />
are combined with R-3 and R-4 zones and planned for condominiums, townhomes<br />
and apartments. Approximately 920 units have current planning approvals in the ITR<br />
areas, including 246 low-income and 123 moderate-income below market rate units,<br />
with potential remaining for the development <strong>of</strong> approximately 3,900 additional multifamily<br />
units in ITR areas.<br />
Downtown Specific Plan<br />
The Downtown Specific Plan (DSP) was originally adopted in 1993 and updated in 2003<br />
to target development to meet current day conditions. The goal <strong>of</strong> the DSP is to rebuild<br />
Downtown Sunnyvale as a traditional downtown, a vibrant pedestrian-friendly central<br />
place for shopping, working, living and entertainment. The DSP is organized into four<br />
main districts to promote a mix <strong>of</strong> uses to create a lively street scene, increase walkability,<br />
reduce dependence on the automobile, and provide for higher-density housing in<br />
proximity to mass transit. In addition, a DSP goal is to encourage below-market-rate<br />
housing in all residential neighborhoods. Within the higher-density residential blocks,<br />
the DSP provides for the development <strong>of</strong> 1,000 net new units.<br />
Lakeside Specific Plan<br />
In 2005, the <strong>City</strong> Council adopted the Lakeside Specific Plan to facilitate redevelopment<br />
<strong>of</strong> an 8.8 acre site that was developed with an older, low rise hotel with development <strong>of</strong> a<br />
mixed use hotel and residential project. One <strong>of</strong> the goals <strong>of</strong> the specific plan is to “create<br />
housing that increases the diversity <strong>of</strong> unit types in tenure, type size and location to<br />
permit a range <strong>of</strong> choice for all current residents and those expected to become <strong>City</strong><br />
residents. The mix <strong>of</strong> these higher-density units, both in terms <strong>of</strong> size and affordability,<br />
shall provide for a variety <strong>of</strong> future residents.”<br />
policy He-4.1 PRovide SiTe oPPoRTuniTieS FoR develoPMenT oF<br />
houSing ThAT ReSPondS To diveRSe CoMMuniTY needS in TeRMS oF<br />
denSiTY, TenuRe TYPe, loCATion And CoST. (Housing and Community<br />
Revitalization Policy D.1)<br />
policy He-4.2 ConTinue To diReCT new ReSidenTiAl develoPMenT<br />
inTo SPeCiFiC PlAn AReAS, neAR TRAnSiT, And CloSe To eMPloYMenT<br />
And ACTiviTY CenTeRS. (Housing and Community Revitalization Policy D.2)<br />
housinG Chapter 5<br />
5–15
<strong>City</strong> <strong>of</strong> Sunnyvale GeneRal plan – July <strong>2011</strong><br />
5–16<br />
policy He-4.3 ReQuiRe new develoPMenT To build To AT leAST 75<br />
PeRCenT oF The MAxiMuM zoning denSiTY, unleSS An exCePTion iS<br />
gRAnTed bY The CiTY CounCil. (Housing and Community Revitalization<br />
Policy D.3)<br />
policy He-4.4 ASSiST ReSidenTiAl develoPeRS in idenTiFYing SiTeS<br />
ThRough diSSeMinATion oF The SiTeS invenToRY, And ASSiST in<br />
ConSolidATion oF PARCelS wiTh RedeveloPMenT PRoJeCT AReAS.<br />
(Housing and Community Revitalization Policy D.4)<br />
policy He-4.5 PRovide oPPoRTuniTieS And inCenTiveS FoR Mixed<br />
uSe, MulTi-FAMilY inFill, And TRAnSiT-oRienTed develoPMenT in<br />
downTown SunnYvAle AS PART oF The CiTY’S oveRAll ReviTAlizATion<br />
STRATegY FoR The AReA. (Housing and Community Revitalization Policy D.5)<br />
policy He-4.6 PRovide exPAnded AReAS FoR higheR denSiTY houSing<br />
ThRough The ConveRSion oF undeRuTilized induSTRiAl AReAS To<br />
ReSidenTiAl uSe, iF The SiTeS ARe FiT FoR ReSidenTiAl uSeS (i.e. no<br />
heAlTh hAzARdS exiST). (Housing and Community Revitalization Policy D.6)<br />
policy He-4.7 TAke AdvAnTAge oF exiSTing inFRASTRuCTuRe And<br />
PubliC iMPRoveMenTS To PRovide AddiTionAl houSing bY Allowing<br />
ACCeSSoRY living uniTS wiThin ReSidenTiAl neighboRhoodS. (Housing<br />
and Community Revitalization Policy D.7)
Goal he-5<br />
eQual houSinG opportunitieS<br />
PRoMoTe eQuAl houSing oPPoRTuniTieS FoR All ReSidenTS, inCluding<br />
SunnYvAle’S SPeCiAl needS PoPulATionS, So ThAT ReSidenTS CAn ReSide in<br />
The houSing oF TheiR ChoiCe. (Housing and Community Revitalization Goal E /<br />
Adopted In 2009)<br />
Promoting housing opportunities for all residents <strong>of</strong> Sunnyvale, including those with<br />
special needs, is an important part <strong>of</strong> the Housing Element. There are several types <strong>of</strong><br />
housing programs Sunnyvale <strong>of</strong>fers to ensure all residents have the opportunity for<br />
equal housing. The programs are: fair housing, shared housing, accessible housing, and<br />
emergency shelter and services.<br />
fair housing Program<br />
The <strong>City</strong> will continue to support programs that provide fair housing services to<br />
Sunnyvale residents. Several regional nonpr<strong>of</strong>it agencies and the <strong>City</strong>’s Housing<br />
Division provide fair housing information and referrals, and/or complaint investigation<br />
and enforcement.<br />
Shared housing Program<br />
The <strong>City</strong> will continue to encourage and support the provision <strong>of</strong> shared housing<br />
matching services in Sunnyvale. Under a shared housing match program, a home<br />
provider, a person who has a home to share, is matched with a home seeker, a person in<br />
search <strong>of</strong> a home to share.<br />
Accessible housing<br />
The <strong>City</strong> adopts updates to Uniform Building and Housing Codes to reflect current<br />
accessibility requirements in new construction. Jurisdictions are required to analyze<br />
constraints to the development, maintenance, and improvement <strong>of</strong> housing for persons<br />
with disabilities and take measures to remove constraints. As part <strong>of</strong> this Housing and<br />
Community Revitalization Sub-element, Sunnyvale has conducted a review <strong>of</strong> the<br />
Zoning Code, building codes and permit processing procedures and has not identified<br />
any institutional barriers to the provision <strong>of</strong> accessible housing. However, the <strong>City</strong> has<br />
not yet developed specific procedures for requesting a reasonable accommodation for<br />
accessibility modifications, and will commit to a program to clarify and add certainty<br />
to exception procedures.<br />
housinG Chapter 5<br />
See Goal He-2 (enhanced<br />
Housing conditions and<br />
affordability) for a discussion<br />
<strong>of</strong> programs to assist in<br />
providing accessible housing.<br />
5–17
<strong>City</strong> <strong>of</strong> Sunnyvale GeneRal plan – July <strong>2011</strong><br />
5–18<br />
policy He-5.1 SuPPoRT The PRoviSion oF FAiR houSing SeRviCeS And<br />
TenAnT/lAndloRd MediATion To ReSidenTS. (Housing and Community<br />
Revitalization Policy E.1)<br />
policy He-5.2 iMPleMenT CiTY oRdinAnCeS RegARding PRohibiTion<br />
oF diSCRiMinATion in houSing. (Housing and Community Revitalization<br />
Policy E.2)<br />
policy He-5.3 ConTinue To AddReSS The SPeCiAl houSing<br />
needS oF SenioRS ThRough PRoviSion oF AFFoRdAble houSing,<br />
And houSing-RelATed SeRviCeS, SuCh AS hoMe RehAbiliTATion<br />
PRogRAMS, PAinT gRAnTS, And MAinTenAnCe, ShARed houSing<br />
MATCh, And houSing CounSeling (i.e. ReveRSe MoRTgAge<br />
CounSeling, eTC.) And vARiouS ReFeRRAl SeRviCeS. (Housing and<br />
Community Revitalization Policy E.3)<br />
policy He-5.4 ConTinue To AddReSS The SPeCiAl needS oF PeRSonS<br />
wiTh diSAbiliTieS ThRough PRoviSion oF SuPPoRTive houSing,<br />
ACCeSSibiliTY gRAnTS, And develoPMenT oF PRoCeduReS FoR<br />
ReASonAble ACCoMModATion. (Housing and Community Revitalization<br />
Policy E.4)<br />
policy He-5.5 enCouRAge The PRoviSion And diSTRibuTion oF<br />
ReSidenTiAl CARe FACiliTieS ThRoughouT The CoMMuniTY. (Housing<br />
and Community Revitalization Policy E.5)
policy He-5.6 PARTiCiPATe in The CounTY CollAboRATive on<br />
AFFoRdAble houSing And hoMeleSS iSSueS To PRovide A<br />
ConTinuuM oF CARe oF SeRviCeS And FACiliTieS FoR The hoMeleSS.<br />
FACiliTATe And SPonSoR The PRoviSion oF houSing FoR hoMeleSS<br />
PeoPle iF The onizukA bASe ConveRSion PlAn iS APPRoved bY<br />
The FedeRAl AgenCieS. SuPPoRT loCAl SeRviCe PRovideRS ThAT<br />
oFFeR FACiliTieS And SuPPoRT SeRviCeS To hoMeleSS individuAlS<br />
And FAMilieS, And PeRSonS AT RiSk oF hoMeleSSneSS. (Housing and<br />
Community Revitalization Policy E.6)<br />
Goal he-6<br />
SuStainaBle neiGhBorhoodS<br />
MAinTAin SuSTAinAble neighboRhoodS wiTh QuAliTY houSing,<br />
inFRASTRuCTuRe And oPen SPACe ThAT FoSTeRS neighboRhood ChARACTeR<br />
And The heAlTh oF ReSidenTS. (Housing and Community Revitalization Goal F /<br />
Adopted in 2009)<br />
Sustainability Policy<br />
Sunnyvale has adopted a sustainability policy to become “a regional leader in<br />
environmental sustainability, advocating to reduce dependence on non-renewable<br />
resources by providing greater transportation options, reducing waste, protecting<br />
our natural resources, and promoting alternative energy usage and research.” The<br />
structure for implementation <strong>of</strong> this policy is set forth in Sunnyvale’s Framework for<br />
Sustainability, with the <strong>City</strong>’s various environmental activities coordinated through<br />
the <strong>City</strong>’s Sustainability Coordinator. The Community Vision also contains a <strong>City</strong>wide<br />
goal for environmental sustainability.<br />
Green Building Requirements<br />
The green building standards for new construction, additions, and remodels <strong>of</strong><br />
buildings were effective for all projects that submit building permits on or after January<br />
1, 2010. The purpose <strong>of</strong> these standards is to implement sustainable development and<br />
construction practices that:<br />
n Use natural resources in a manner that does not eliminate, degrade, or diminish<br />
their usefulness for future generations<br />
n Enhance the public health and welfare by promoting the environmental and economic<br />
health <strong>of</strong> the <strong>City</strong> through the design, construction, maintenance, operation, and<br />
deconstruction <strong>of</strong> buildings and other sire development<br />
n Incorporate green building practices into all development projects.<br />
housinG Chapter 5<br />
5–19
<strong>City</strong> <strong>of</strong> Sunnyvale GeneRal plan – July <strong>2011</strong><br />
5–20<br />
Sunnyvale has a variety <strong>of</strong> programs and policies to foster this goal. Below is a discussion<br />
<strong>of</strong> sustainable policies and green building requirements.<br />
For further information and policies on quality housing, see:<br />
n Goal LT-3 (Appropriate Housing)<br />
n Goal HE-1 (Adequate Housing)<br />
n Goal HE-2 (Affordable Housing)<br />
For further information on transportation infrastructure, see;<br />
n Goal LT-4 (Efficient Transportation).<br />
For further information on open space, see:<br />
n Goals LT-5 and LT-6 (Adequate local and regional open space.)<br />
For further information about community character, see the Community Character<br />
Chapter.<br />
policy He-6.1 ConTinue eFFoRTS To bAlAnCe The need FoR<br />
AddiTionAl houSing wiTh oTheR CoMMuniTY vAlueS, inCluding<br />
PReSeRving The ChARACTeR oF eSTAbliShed neighboRhoodS, high<br />
QuAliTY deSign, And PRoMoTing A SenSe oF idenTiTY in eACh<br />
neighboRhood. (Housing and Community Revitalization Policy F.1)<br />
policy He-6.2 PRoMoTe neighboRhood viTAliTY bY PRoviding<br />
AdeQuATe CoMMuniTY FACiliTieS, inFRASTRuCTuRe, lAndSCAPing<br />
And oPen SPACe, PARking, And PubliC heAlTh And SAFeTY wiThin<br />
new And exiSTing neighboRhoodS. (Housing and Community<br />
Revitalization Policy F.2)
policy He-6.3 ConTinue A high QuAliTY oF MAinTenAnCe FoR<br />
PubliC STReeTS, RighTS-oF-wAY, And ReCReATionAl AReAS, And<br />
PRovide SAFe PedeSTRiAn, bike, And TRAnSiT linkAgeS (ACCeSSibiliTY)<br />
beTween JobS, ReSidenCeS, TRAnSPoRTATion hubS, And goodS And<br />
SeRviCeS. (Housing and Community Revitalization Policy F.3)<br />
policy He-6.4 ConTinue To iMPleMenT A CiTizen-oRienTed,<br />
PRoACTive eduCATion PRogRAM RegARding neighboRhood<br />
PReSeRvATion. enCouRAge ReSidenT involveMenT in idenTiFYing<br />
And AddReSSing neighboRhood needS in PARTneRShiP wiTh The<br />
CiTY. (Housing and Community Revitalization Policy F.4)<br />
policy He-6.5 PRoMoTe The PReSeRvATion oF hiSToRiCAllY And<br />
ARChiTeCTuRAllY SigniFiCAnT buildingS And neighboRhoodS<br />
ThRough lAnd uSe, deSign And houSing PoliCieS. (Housing and<br />
Community Revitalization Policy F.5)<br />
policy He-6.6 enCouRAge uSe oF SuSTAinAble And gReen building<br />
deSign in new And exiSTing houSing. (Housing and Community<br />
Revitalization Policy F.6)<br />
policy He-6.7 ConTinue To PeRMiT And enCouRAge A Mix<br />
oF ReSidenTiAl And Job-PRoduCing lAnd uSeS, AS long AS<br />
TheRe iS neighboRhood CoMPATibiliTY And no unAvoidAble<br />
enviRonMenTAl iMPACTS. (Housing and Community Revitalization Policy F.7)<br />
housinG Chapter 5<br />
5–21
chapteR 6<br />
safety and<br />
noise<br />
The Safety and Noise chapter contains information on the following topics:<br />
n Hazards and disaster preparedness and response — information<br />
on existing natural and manmade hazards and policies and plans to<br />
mitigate these hazards and prepare for disasters.<br />
n Police, fire and emergency services — information on police,<br />
fire and emergency services and policies and plans to continue to<br />
improve these services.<br />
n Noise — information on existing and projected noise conditions<br />
with policies and programs to maintain or reduce noise from<br />
transportation, land use operations and single-event noise.
safety and noise — hazaRds and disasteR pRepaRedness and Response Chapter 6<br />
haZardS and diSaSter preparedneSS and reSponSe<br />
Goal Sn-1<br />
aCCeptaBle levelS <strong>of</strong> riSk for natural and<br />
huMan-CauSed haZardS<br />
enSuRe ThAT nATuRAl And huMAn-CAuSed hAzARdS ARe ReCognized And<br />
ConSideRed in deCiSionS AFFeCTing The CoMMuniTY And ThAT lAnd uSeS<br />
ReFleCT ACCePTAble levelS oF RiSk bASed on idenTiFied hAzARdS And<br />
oCCuPAnCY. (Previously Safety Mission A / Adopted In 2008)<br />
Consideration <strong>of</strong> natural and manmade hazards in land use decisions is a critical<br />
component <strong>of</strong> the <strong>City</strong>’s planning process. By carefully balancing the community’s need<br />
for safety with other needs such as housing, employment and transportation, the <strong>City</strong><br />
can ensure that the knowledge <strong>of</strong> existing safety hazards are reasonably considered in<br />
all planning and development review processes.<br />
Among the hazards that should be considered are seismic, flood, fire, hazardous materials<br />
and aviation hazards. An important consideration is also the protection <strong>of</strong> vital <strong>City</strong><br />
lifelines from hazards. Hazards and lifelines are discussed in more detail below.<br />
policy sn-1.1 evAluATe And ConSideR exiSTing And PoTenTiAl<br />
hAzARdS in develoPing lAnd uSe PoliCieS. MAke lAnd uSe<br />
deCiSionS bASed on An AwAReneSS oF The hAzARdS And PoTenTiAl<br />
hAzARdS FoR The SPeCiFiC PARCel oF lAnd. (Previously Safety Policy A1)<br />
Seismic hazards<br />
Damaging earthquakes are infrequent; however, they pose the most significant threat in<br />
relation to the destruction they may cause to the <strong>City</strong>.<br />
Sunnyvale is located between two active earthquake faults. (See Figure 6-1, San Francisco<br />
Bay Region Earthquake Probability Map.) Scientists have identified four fault segments<br />
on which they believe large earthquakes are most likely to occur. The USGS estimated<br />
that there is a 63 percent chance for at least one earthquake <strong>of</strong> magnitude 6.7 or larger<br />
to strike in the San Francisco Bay Area before the year 2037. An earthquake <strong>of</strong> this size<br />
could strike at any time.<br />
The <strong>City</strong> has taken significant steps to reduce the risk <strong>of</strong> seismic hazards. To improve the<br />
seismic safety <strong>of</strong> buildings in the less stable soil areas <strong>of</strong> the <strong>City</strong>, geotechnical reports<br />
are now required for all developments in the <strong>City</strong>. New Building Code requirements<br />
and the continuing modernization <strong>of</strong> the <strong>City</strong> have greatly reduced the number <strong>of</strong> 6–3
<strong>City</strong> <strong>of</strong> Sunnyvale GeneRal plan – July <strong>2011</strong><br />
See GeneralPlan.InSunnyvale.<br />
com for Sunnyvale’s local<br />
hazard Mitigation plan and<br />
more information about likely<br />
hazards and mitigations.<br />
a 1 percent flood, also<br />
known as a 100 year flood,<br />
has a 1 percent probability<br />
to being equaled or<br />
exceeded in any given year.<br />
See the environmental<br />
Management Chapter for<br />
more information on the<br />
storm drain system.<br />
6–4<br />
structures most vulnerable to seismic events. The <strong>City</strong> actively participates in the State<br />
<strong>of</strong> California Seismic Hazards Mapping Program. In addition, the seismic safety <strong>of</strong> <strong>City</strong><br />
buildings has received considerable attention. Many <strong>City</strong> buildings have been designated<br />
as “Essential Services Buildings.” Seismic retr<strong>of</strong>itting <strong>of</strong> the Community Center, <strong>City</strong><br />
Hall Annex, Library, Corporation yard (stores section) has been completed, along with<br />
all six fire stations.<br />
Other hazards <strong>of</strong> a seismic event include flooding and fire hazards. A local major earthquake<br />
could cause the failure <strong>of</strong> parts <strong>of</strong> the levee system in the San Francisco Bay and such a<br />
failure could lead to flooding in the northern parts <strong>of</strong> the <strong>City</strong> that are below sea level. Fire<br />
in the aftermath <strong>of</strong> an earthquake could also pose serious problems in Sunnyvale. Major<br />
variables that could intensify the situation include water system damage, multiple fires<br />
and isolation <strong>of</strong> some areas due to roadway over crossing failures. The following sections<br />
discuss flood hazards and fire hazards and mitigations to these effects.<br />
flood hazards<br />
Santa Clara Valley is classified as an active flood plain that has been severely altered<br />
by human activity. Approximately 1,800 acres <strong>of</strong> Sunnyvale has been designated by<br />
the Federal Emergency Management Agency (FEMA) as Special Flood Hazard Areas<br />
(SFHA). The SFHA show areas in Sunnyvale susceptible to flooding (See Figure 6-2,<br />
FEMA Flood Hazard Map). In Sunnyvale, SFHAs are generally located in the northeast<br />
portion <strong>of</strong> the <strong>City</strong>. Flood events are generally caused by a creek topping its banks,<br />
clogged catch basins or storm drains.<br />
The <strong>City</strong> has been a participant in the FEMA Community Rating System (CRS) since<br />
1998. In May 2003, the <strong>City</strong> <strong>of</strong> Sunnyvale was granted a Class 7 community rating by<br />
FEMA, enabling Sunnyvale citizens and businesses to obtain discounts on their flood<br />
insurance premiums. This rating is granted based on the community’s participation in<br />
public information activities, mapping and regulating activities and flood preparedness<br />
and damage reduction activities. Sunnyvale’s program addresses flood hazards with a<br />
combination <strong>of</strong> infrastructure projects and building code requirements.<br />
Current flood Control Infrastructure<br />
Creeks and flood Control Channels — The Santa Clara Valley Water District<br />
(SCVWD) maintains Calabazas Creek, Stevens Creek and the Sunnyvale East and West<br />
flood control channels. These channels, coupled with the <strong>City</strong>’s storm drains take the<br />
majority <strong>of</strong> surface run-<strong>of</strong>f to the San Francisco Bay. The East and West Channels and<br />
Calabazas Creek were built to contain a 1 percent annual chance flood.<br />
Storm Drain System — The <strong>City</strong> <strong>of</strong> Sunnyvale owns and operates approximately 3,200<br />
storm drain inlets, two pump stations and 150 miles <strong>of</strong> storm drains. Surface run<strong>of</strong>f<br />
from paved areas enters the storm drain system through storm drain inlets, which<br />
discharge directly to the Bay. The two pump stations collect run<strong>of</strong>f from low lying<br />
urban areas and discharge the run<strong>of</strong>f to creeks and sloughs. Since these pump stations<br />
are at a higher elevation, gravity flow conveys the stormwater to the Bay.
safety and noise — hazaRds and disasteR pRepaRedness and Response Chapter 6<br />
SAN ANDREAS FAULT<br />
1<br />
P a c i f i c O c e a n<br />
0<br />
0 20 KILOMETERS<br />
%<br />
N<br />
Probability <strong>of</strong> magnitude<br />
6.7 or greater quakes<br />
before 2036 on the<br />
indicated fault<br />
Increasing probability<br />
along fault segments<br />
Santa<br />
Rosa<br />
RODGERS CREEK FAULT<br />
RODGERS CREEK FAULT<br />
Petaluma<br />
20 MILES<br />
Expanding urban areas<br />
101<br />
Novato Nov<br />
San Francisco<br />
Pacifica<br />
21%<br />
Half Moon<br />
Bay<br />
Napa<br />
Sonoma<br />
San<br />
Rafael<br />
31%<br />
6%<br />
HAYWARD<br />
HAYWARD<br />
San Francisco Bay<br />
Oakland<br />
San<br />
Mateo<br />
Source: United States Geographic Service (USGS), 2008<br />
Vallejo<br />
101<br />
SAN GREGORIO FAULT<br />
LLEY LLEY FAULT FAULT<br />
CONCORDÐGREEN CONCORDÐGREEN VA VA<br />
3%<br />
680<br />
FAULT FAULT<br />
Hayward<br />
80<br />
Walnut<br />
Creek<br />
Danville<br />
880<br />
17<br />
63%<br />
probability for one or more<br />
magnitude 6.7 or greater<br />
earthquakes from 2007 to 2036.<br />
MT. MT. DIABLO DIABLO<br />
THRUST THRUST FAULT FAULT<br />
1%<br />
Palo<br />
Alto<br />
Sunnyvale<br />
280 San<br />
Jose<br />
Monterey<br />
Bay<br />
Antioch<br />
Santa Cruz<br />
Watsonville<br />
Monterey<br />
GREENVILLE<br />
GREENVILLE<br />
Livermore<br />
Pleasanton<br />
1<br />
3%<br />
7%<br />
580<br />
FAULT FAULT<br />
CALAVERAS CALAVERAS FAULT FAULT<br />
EXTENT EXTENT OF OF RUPTURE RUPTURE<br />
<strong>IN</strong> <strong>IN</strong> LOMA LOMA PRIETA PRIETA QUAKE QUAKE<br />
Gilroy<br />
101<br />
Salinas<br />
Sacramento<br />
Stockton<br />
Tracy<br />
figure 6-1: San francisco<br />
Bay Region Earthquake<br />
Probability<br />
6–5
<strong>City</strong> <strong>of</strong> Sunnyvale GeneRal plan – July <strong>2011</strong><br />
for detailed information, refer<br />
to Sunnyvale Municipal Code<br />
Chapter 16.62 and the flood<br />
insurance rate Map on file in<br />
the public Works department.<br />
6–6<br />
Levees and Dikes — Dike and levee systems have been constructed along the San<br />
Francisco Bay, originally to form and protect the salt evaporators and concentrators that<br />
ring the southernmost arm <strong>of</strong> the bay, not as a barrier to prevent flooding a populated<br />
area. The dikes are constructed <strong>of</strong> weak, locally-derived Bay materials that are constantly<br />
undergoing settlement, erosion by the elements and damage by burrowing animals.<br />
Without the present system <strong>of</strong> dikes and levees, a part <strong>of</strong> Sunnyvale normally would<br />
be subjected to flooding by tides. It assumed that this would still be the case if these<br />
dikes were to be topped breached or failed. To allow use <strong>of</strong> land that was subject to tidal<br />
flooding and subsidence, the levee systems have been extended and strengthened to<br />
protect these low-lying lands.<br />
Dams — Stevens Creek Dam, located on Stevens Creek 2.5 miles south <strong>of</strong> the <strong>City</strong> <strong>of</strong><br />
Sunnyvale’s boundary, is an earthen dam approximately 135 feet in height. Constructed<br />
in 1936, the dam’s principal purpose is water supply. The waters impounded in the<br />
reservoir are released at a rate such that the waters will percolate into the ground, thus<br />
recharging the ground water aquifer.<br />
Building Code Requirements — Sunnyvale has enforced specific building code<br />
requirements in the flood prone areas to minimize potential property damage from<br />
flooding. Specific requirements for development in these areas to reduce flood hazards<br />
include minimum foundation pad heights above the projected flood depth as specified<br />
on the Flood Insurance Rate Map.<br />
future flood Control Activities<br />
There are four sources <strong>of</strong> flooding that can threaten Sunnyvale:<br />
Excessive Precipitation — The areas in Sunnyvale that will flood as a result <strong>of</strong> heavy<br />
rains and the resulting surface run<strong>of</strong>f border Calabazas Creek and the East and West<br />
Flood control channels. Specific street flooding will also occur from clogged storm<br />
drains and low places in some roadways.<br />
Storm drain inlets are routinely inspected prior to the rainy season each year and<br />
cleaned, if necessary, to prevent flooding, alleviate odors and/or prevent mosquitos<br />
from breeding. Maintenance crews also clean inlets in response to citizen and business<br />
complaints. The majority <strong>of</strong> the inlets are shallow (less than three feet deep) and debris<br />
is removed manually. Deeper inlets are cleaned using a vacuum truck and flushed with<br />
water to eliminate remaining debris.<br />
Three significant flooding events have occurred in Sunnyvale since the 1993 writing<br />
<strong>of</strong> the Seismic Safety and Safety Sub-element. These events occurred in 1995, 1997 and<br />
the El Nino flooding <strong>of</strong> 1998. These were all declared disasters throughout Santa Clara<br />
County. In the years following these storms, the SCVWD, as the agency that maintains<br />
and improves the flood control channels in SCVWD completed a project to construct<br />
wing walls along Calabazas Creek several feet higher than they were. Additional channel<br />
openings, called “boxes”, were also installed under Homestead Road, Vireo Avenue<br />
and Lochinvar Avenue, expanding the creek size under these streets. As a result <strong>of</strong> this<br />
improvement, in 2009, <strong>City</strong> and SCVWD staff worked together to petition FEMA to
MIDDLEFIELD<br />
GRANT<br />
safety and noise — hazaRds and disasteR pRepaRedness and Response Chapter 6<br />
FEMA Flood Hazard Map<br />
!<br />
X - Area <strong>of</strong> 500-year flood<br />
A - 1% annual chance <strong>of</strong> flood (approx)<br />
AE - 1% annual chance <strong>of</strong> flood (detailed)<br />
AO - Flood depths <strong>of</strong> 1-3 ft.<br />
AH - 1% annual chance <strong>of</strong> shallow<br />
flooding<br />
D - Undetermined<br />
VE - 1% or greater chance <strong>of</strong> flooding<br />
and storm waves<br />
1% annual chance <strong>of</strong> flood contained<br />
in channel<br />
Areas removed from flood zones<br />
CENTRAL<br />
!<br />
Los Altos<br />
ZONE D<br />
CA-85<br />
Moutain<br />
View<br />
!<br />
BERNARDO<br />
CA-237<br />
ZONE VE<br />
FREMONT<br />
Federal Emergency Management Agency, 2010<br />
!<br />
MARY<br />
!<br />
REM<strong>IN</strong>GTON<br />
ZONE D<br />
CENTRAL EXPRESSWAY<br />
ZONE X<br />
HOLLENBECK<br />
STELL<strong>IN</strong>G<br />
!<br />
!<br />
TASMAN<br />
! ! ! !<br />
<strong>SUNNYVALE</strong> SARATOGA<br />
<strong>SUNNYVALE</strong><br />
MATHILDA<br />
ZONE AE<br />
OLD SAN FRANCISCO<br />
US-280<br />
CALIFORNIA<br />
MAUDE<br />
EL CAM<strong>IN</strong>O REAL<br />
ZONE AO<br />
ZONE X<br />
FAIR OAKS<br />
GUADALUPE SLOUGH<br />
WOLFE<br />
JAVA<br />
ZONE A<br />
FAIR OAKS<br />
!<br />
EVELYN<br />
CARIBBEAN<br />
ZONE AO<br />
Cupertino<br />
REED<br />
HOMESTEAD<br />
ZONE AE<br />
LAWRENCE<br />
US-101<br />
ARQUES<br />
KIFER<br />
MONROE<br />
Santa<br />
Clara<br />
ZONE AH<br />
!<br />
GREAT AMERICA<br />
!<br />
1% Annual Chance<br />
<strong>of</strong> Flood Contained<br />
In Channel<br />
ZONE VE<br />
BOWERS<br />
Major Streets<br />
San<br />
Jose<br />
US-101<br />
Highway/Expressway<br />
Å Train Station<br />
! Light Rail Station<br />
Light Rail<br />
Railroad<br />
Creek<br />
Channel<br />
<strong>City</strong> Boundary<br />
0.5<br />
Miles<br />
¸<br />
WALSH<br />
ZONE AO<br />
SCOTT<br />
figure 6-2: fEMA flood<br />
hazard Map<br />
6–7
<strong>City</strong> <strong>of</strong> Sunnyvale GeneRal plan – July <strong>2011</strong><br />
subsidence — Subsidence<br />
is the motion <strong>of</strong> a surface<br />
(usually, the earth’s surface) as<br />
it shifts downward relative to<br />
a fixed point such as sea-level.<br />
the opposite <strong>of</strong> subsidence is<br />
uplift, which results in<br />
an increase in elevation.<br />
Subsidence can occur when<br />
too much groundwater is<br />
pumped out, causing the land<br />
above to sink.<br />
freeboard — a vertical<br />
distance, or clearance, from<br />
a 1 percent flood incident.<br />
Standards set by the feMa<br />
and the army Corp <strong>of</strong><br />
engineers call for a minimum<br />
three foot freeboard.<br />
6–8<br />
remove more than 200 acres <strong>of</strong> flood zone properties in Sunnyvale along Calabazas<br />
Creek, in the vicinity <strong>of</strong> both Vinemaple Avenue and Oakmead Parkway.<br />
The District is also in the planning and design stage <strong>of</strong> two capital projects to improve<br />
the capacity <strong>of</strong> the Sunnyvale East and West Channels. The two projects were part <strong>of</strong><br />
the 2000 voter-approved Clean, Safe Creeks Program (Measure B). Once completed, the<br />
projects will provide 100-year flood protection to 1,600 parcels along the Sunnyvale East<br />
Channel and 47 acres <strong>of</strong> industrial lands along the Sunnyvale West Channel. In August<br />
2010, the District Board approved the Planning Study Report and its recommendation<br />
for flood protection. Currently the project is in the design phase. Construction is<br />
expected to commence in spring <strong>of</strong> 2014.<br />
Tidal and Tsunamis — Earthquakes may generate flooding from a tsunami (sea wave<br />
caused by an earthquake), seiche (wave generated in an enclosed body <strong>of</strong> water), or dam<br />
failure. A tsunami <strong>of</strong>f the San Francisco coast could cause Bay water to top local levees,<br />
especially if it arrived at high tide. Tidal flooding could occur if the system <strong>of</strong> dikes and<br />
levees failed or their banks overflowed. Local earthquakes could cause failure in parts <strong>of</strong><br />
the levee system which would create problems if a tsunami were to happen as well. The<br />
Santa Clara Valley Water District’s system is put in place to help reduce damage done by<br />
all hazards discussed above whether they happen individually or simultaneously.<br />
The problem <strong>of</strong> dike vulnerability has been compounded by the general lowering <strong>of</strong> the<br />
ground surface in this part <strong>of</strong> Santa Clara County — six to eight feet from 1916 to 1966<br />
in the northern areas <strong>of</strong> the <strong>City</strong>. During the same time frame the ground subsided three<br />
to four feet in the areas along El Camino Real. Until ground water recharge methods<br />
were initiated in the late 1960s, the amount <strong>of</strong> freeboard on the dikes was constantly<br />
being diminished by an accelerated subsidence rate caused by groundwater withdrawal.<br />
Although human-caused subsidence has been minimal since 1967, a certain amount <strong>of</strong><br />
subsidence is happening naturally due to regional tectonic movements, peat decay and<br />
a three inch rise in the sea level during the last 50 years.<br />
A Capital Improvement Project was completed by the Department <strong>of</strong> Public Works in<br />
2006 to repair and strengthen the levees surrounding the ponds, reducing the chance<br />
that the levees would fail in the event <strong>of</strong> a major earthquake.<br />
Dam failure — Failure <strong>of</strong> the Stevens Creek Reservoir dam caused by an earthquake<br />
could also affect the <strong>City</strong> <strong>of</strong> Sunnyvale. Most significantly affected would be the<br />
southwest part <strong>of</strong> the <strong>City</strong> south <strong>of</strong> Remington and west <strong>of</strong> Sunnyvale-Saratoga Road.<br />
This estimated flood inundation area is based upon the maximum 3,700 acre-feet<br />
storage capacity <strong>of</strong> the reservoir. Depending upon the quantity <strong>of</strong> water released, the<br />
depth <strong>of</strong> flooding could vary from several inches to several feet. For any large release <strong>of</strong><br />
water Interstate-280 would act as a barrier to keep some water out <strong>of</strong> Sunnyvale.<br />
Safety improvements to the reservoir and the dam were made in the mid-2000s. The<br />
reservoir and the dam were engineered to withstand an earthquake on the San Andreas<br />
Fault <strong>of</strong> a magnitude 8.25 on the Richter scale. Upstream and downstream berms were<br />
built and the dam was raised 10 feet. The contour <strong>of</strong> gentle slopes surrounding the<br />
dam, plus the compacted earth along the sides and the face <strong>of</strong> the dam, were designed<br />
to encourage run-<strong>of</strong>f and the collection <strong>of</strong> water and to discourage landslides. The
safety and noise — hazaRds and disasteR pRepaRedness and Response Chapter 6<br />
spillway was also upgraded to be capable <strong>of</strong> withstanding a flow <strong>of</strong> 15,600 cubic feet per<br />
second. As an added precaution, safety inspections are done after all earthquakes <strong>of</strong> 5.0<br />
or greater magnitude.<br />
Rise in Sea Level — Although changes in sea level have been gradual and constant over<br />
the past 5,000 years, the rate <strong>of</strong> sea level rise in the past 100 years has almost doubled<br />
during the past several decades. The cause <strong>of</strong> the increase in the rate <strong>of</strong> sea level rise may<br />
be due in part to climate change and high levels greenhouse gas intensities.<br />
A rise in sea level could cause significant problems in the future: flooding, shoreline<br />
erosion and saltwater intrusion into fresh water streams and aquifers. Although<br />
subsidence is now controlled by groundwater recharge and management <strong>of</strong> pumped<br />
aquifers, it may not be feasible to control the effects <strong>of</strong> global warming on rising sea<br />
levels.<br />
policy sn-1.2 TAke MeASuReS To PRoTeCT liFe And PRoPeRTY<br />
FRoM The eFFeCTS oF A 1 PeRCenT (100 YeAR) Flood. (Previously Safety<br />
Policy A2)<br />
n SN-1.2a Encourage the Santa Clara Valley Water District to reevaluate the capacity <strong>of</strong><br />
Stevens Creek, Calabazas Creek, Sunnyvale East, West and El Camino Flood Control<br />
Channels in relation to a 1 percent (100 year) flood. (Previously Seismic Safety and<br />
Safety Key Initiative A.2.1)<br />
n SN-1.2b Encourage SCVWD to maintain their dikes and levees at least 3 ft. above the<br />
1 percent flood level and to provide continued inspection and repair from damage<br />
caused by burrowing animals. (Previously Seismic Safety and Safety Key Initiative<br />
A.2.3)<br />
n SN-1.2c Participate in the National Flood Insurance Program. (Previously Seismic<br />
Safety and Safety Key Initiative A.2.5)<br />
policy sn-1.3 oPeRATe And MAinTAin The SToRM dRAinAge<br />
SYSTeM AT A level To MiniMize dAMAgeS And enSuRe PubliC SAFeTY.<br />
(Previously Surface Run<strong>of</strong>f Policy C.1)<br />
no landslides on any <strong>of</strong> the<br />
county’s dams have occurred<br />
in the past decade, not even<br />
in the 1995, 1997 and 1998<br />
“el nino” storms or after the<br />
1989 earthquake.<br />
6–9
<strong>City</strong> <strong>of</strong> Sunnyvale GeneRal plan – July <strong>2011</strong><br />
See Goal sn-5 (effective fire<br />
response system) for further<br />
information and policies on<br />
fire risk and response.<br />
6–10<br />
policy sn-1.4 MoniToR And PlAn FoR hYdRAuliC ChAngeS<br />
due To globAl wARMing, eARThQuAkeS And/oR SubSidenCe.<br />
(Previously Surface Run<strong>of</strong>f Policy C.3)<br />
n SN-1.4a Budget for and construct additional storm drainage detention and pumping<br />
facilities as needed, to assure the continued ability to discharge urban run<strong>of</strong>f and<br />
stormwater into channels, creeks and San Francisco Bay. (Previously Surface<br />
Run<strong>of</strong>f Action Statement C.3.d)<br />
n SN-1.4b When designing structures along shorelines, consider future sea level<br />
changes. (Previously Surface Run<strong>of</strong>f Action Statement C.3.e)<br />
fire hazards<br />
Sunnyvale has a relatively low risk factor for fire loss and past fire experience has<br />
demonstrated Sunnyvale to be a relatively fire-safe community. However, as in any<br />
<strong>City</strong>, the potential for serious fire events is ever present. A trained and well-equipped<br />
fire service must be ready to respond to fires and other incidents. While the potential<br />
for extraordinary disaster always exists, and while the aging process <strong>of</strong> the <strong>City</strong> and<br />
its buildings will have some adverse impact on fire loss, the overall environment is<br />
comparatively fire-safe.<br />
Because Sunnyvale is a relatively new community and because the <strong>City</strong> has a strong<br />
facilities inspection and fire education program, the incidence <strong>of</strong> fire is low. Each year,<br />
inspections are completed at all commercial facilities, apartments, hotels and schools<br />
with an emphasis on prevention. Additionally, fire station-based education programs<br />
target school children, while the Crime Prevention Unit provides more advanced public<br />
education programs to businesses and neighborhoods.<br />
The majority <strong>of</strong> fires experienced in Sunnyvale are kitchen fires caused by inattention<br />
while cooking. Future public education will focus on residential kitchen fires to raise<br />
awareness and provide the community with information that will help to reduce the<br />
incidence <strong>of</strong> these types <strong>of</strong> fires.
safety and noise — hazaRds and disasteR pRepaRedness and Response Chapter 6<br />
hazardous Materials<br />
For decades, Sunnyvale has been home to many innovative high tech companies.<br />
New and emerging technology companies (e.g. solar cell companies and LED<br />
light manufacturers) whose presence here is vital to a thriving and diverse business<br />
community, require the use <strong>of</strong> a large variety <strong>of</strong> hazardous materials, including highly<br />
toxic compressed gases. The highest hazard facilities, those with larger quantities <strong>of</strong><br />
hazardous materials or materials having greater toxicity, are located in the industrial<br />
area in the northern part <strong>of</strong> the <strong>City</strong>.<br />
As <strong>of</strong> 2010, more than 900 businesses in the <strong>City</strong> <strong>of</strong> Sunnyvale store or use hazardous<br />
materials in quantities requiring a permit. By serving as a Certified Unified Program<br />
Agency (CUPA) the <strong>City</strong>’s Department <strong>of</strong> Public Safety is able to conduct inspections<br />
<strong>of</strong> hazardous materials facilities and to review and certify risk management plans<br />
to prevent accidental releases <strong>of</strong> hazardous materials. The <strong>City</strong> also maintains a<br />
hazardous materials response team, which is specially trained and equipped to mitigate<br />
emergencies that result in hazardous materials spills, releases and discharges. This team<br />
is relied upon to maintain the safety <strong>of</strong> all citizens when confronted with an emergency<br />
involving hazardous materials. The <strong>City</strong> has also improved Hazardous Materials<br />
response by maintaining a Type II HazMat Response Unit.<br />
New hazardous materials threats continue to emerge in research and development<br />
activities, as well as terrorist initiated use <strong>of</strong> chemical, biological, radiological, nuclear<br />
and explosive (CBRNE) (also known as weapons <strong>of</strong> mass destruction (WMD)) agents.<br />
The <strong>City</strong> will continue to evaluate the need for collaborating between hazardous<br />
materials inspectors and first responders.<br />
The State <strong>of</strong> California recognized and responded to the need for increased sharing<br />
<strong>of</strong> hazardous materials information by passing Assembly Bill 2286 which requires all<br />
businesses handling regulated quantities <strong>of</strong> hazardous material to electronically report<br />
inventories and site maps to the jurisdiction by 2013. Similarly, the <strong>City</strong> will be required to<br />
report hazardous materials inventories and compliance inspection data to the state by 2013.<br />
policy sn-1.5 PRoMoTe A living And woRking enviRonMenT SAFe<br />
FRoM exPoSuRe To hAzARdouS MATeRiAlS. (Previously Safety Policy A3)<br />
n SN-1.5a Maintain the <strong>City</strong>’s status as a Unified Program Agency as certified by the<br />
Environmental Protection Agency. (Previously Seismic Safety and Safety Key Initiative<br />
A.3.3)<br />
Certified unified<br />
program agency —<br />
a certification awarded by<br />
the California environmental<br />
protection agency that<br />
allows the <strong>City</strong> to implement<br />
several important state<br />
environmental programs<br />
locally.<br />
6–11
<strong>City</strong> <strong>of</strong> Sunnyvale GeneRal plan – July <strong>2011</strong><br />
See Goal sn-10 (maintained<br />
or reduced transportation<br />
noise) for further discussion<br />
and policies about M<strong>of</strong>fett<br />
field noise.<br />
further policies addressing<br />
naSa ames/M<strong>of</strong>ett field<br />
are available in the Council<br />
policy Manual, available at<br />
www.sunnyvale.ca.gov<br />
6–12<br />
policy sn-1.6 oPeRATe A ReSPonSe SYSTeM ThAT will PRovide eFFeC-<br />
Tive ConTRol And inveSTigATion oF hAzARdouS MATeRiAlS eMeRgenCieS.<br />
(Previously Fire Services Policy 4.2B.2)<br />
n SN-1.6a Provide a specially trained and equipped response team capable <strong>of</strong><br />
mitigating emergencies resulting from hazardous materials leaks, spills and<br />
discharges and conduct related inspections and permit activities. (Previously Fire<br />
Services Action Statement 4.2B.2a)<br />
n SN-1.6b Consider electronic technology to provide Hazardous Materials<br />
Management Plan (HMMP) information “on-line” at emergency scenes. (Previously<br />
Fire Services Action Statement 4.2B.2c)<br />
n SN-1.6c Consider regional hazardous materials response system. (Previously Fire<br />
Services Action Statement 4.2B.2d)<br />
n SN-1.6d Study potential impacts <strong>of</strong> emerging bio-technology on response capabilities<br />
and related inspection and permit activities. (Previously Fire Services Action Statement<br />
4.2B.2e)<br />
Aviation hazards<br />
Sunnyvale lies in the landing pattern <strong>of</strong> M<strong>of</strong>fett Federal Airfield and, during south<br />
winds, planes take <strong>of</strong>f over heavily-developed areas. Risk <strong>of</strong> future accidents exists even<br />
though the Navy’s usage <strong>of</strong> M<strong>of</strong>fett Field as a Naval Air Station ended in 1994.<br />
Compatible land uses for and around NASA Ames/M<strong>of</strong>fett Field have been the subject <strong>of</strong><br />
intense debate for many years. Other than the potential <strong>of</strong> aircraft accidents, noise is the<br />
most significant concern <strong>of</strong> area residents. The noise levels at M<strong>of</strong>fett Federal Airfield<br />
have dropped significantly since the Navy was operating the field. Stage III aircraft are<br />
now required for aircraft landing at M<strong>of</strong>fett. This is the lowest level for both noise and<br />
emission levels. Both the level <strong>of</strong> activity and noise levels are more closely examined in<br />
the Noise subsection <strong>of</strong> this chapter.<br />
NASA/Ames has recently explored and initiated the leasing <strong>of</strong> airfield usage to large<br />
private companies as part <strong>of</strong> corporate collaborations. Close monitoring <strong>of</strong> increased<br />
usage and potential growth <strong>of</strong> M<strong>of</strong>fett Field is warranted. While Sunnyvale has no<br />
direct authority over NASA/Ames, NASA has been responsive to the cities <strong>of</strong> Sunnyvale<br />
and Mountain View regarding noise/traffic levels.
safety and noise — hazaRds and disasteR pRepaRedness and Response Chapter 6<br />
policy sn-1.7 MAke PlAnning deCiSionS ThAT eSTAbliSh And/oR<br />
MAinTAin A SAFe Mix oF AviATion And lAnd uSe FoR The AReAS AF-<br />
FeCTed bY nASA AMeS/MoFFeTT Field. (Previously Safety Policy A4)<br />
n SN-1.7a Oppose any effort to promote M<strong>of</strong>fett Field for civil/general aviation.<br />
(Previously Safety Key Initiative A.4.1)<br />
Lifelines<br />
Lifelines are essential services that are necessary for the continued functioning <strong>of</strong> the<br />
community following a disaster. They include utilities (gas, electricity, water, sewer and<br />
communications), <strong>City</strong> streets, major highways, bridges and railways lines. Information<br />
on age, service, condition and location help emergency preparedness planners assess the<br />
likelihood <strong>of</strong> failure.<br />
Electric Power — PG&E provides the natural gas and electrical power for Sunnyvale.<br />
The severity <strong>of</strong> damage to these utilities resulting from an earthquake and what effects<br />
it will have is very difficult to forecast. PG&E has three electrical sub-stations in the<br />
Sunnyvale area — along with a backup power supply network comprised <strong>of</strong> multiple<br />
transmission lines. If power is interrupted, service from other sources can be obtained.<br />
Water Service — Sunnyvale has four sources <strong>of</strong> potable water in the <strong>City</strong>: San<br />
Francisco’s Hetch Hetchy system, the Santa Clara Valley Water District (SCVWD), 10<br />
<strong>City</strong> wells and Cal Water. This system supplies both domestic and emergency water for<br />
the <strong>City</strong>. Projects were completed in the 1990’s that provide the grid connections in<br />
Sunnyvale’s water delivery system that will allow water from any supply source to be<br />
distributed to any area <strong>of</strong> the <strong>City</strong>, along with additional backup supply sources.<br />
Sanitary Sewer — The Water Pollution Control Plant (WPCP) is a large facility that<br />
processes all <strong>of</strong> the <strong>City</strong>’s sewage. The WPCP has two separate generators normally<br />
used every day that supply approximately 90 percent <strong>of</strong> the electrical needs <strong>of</strong> the<br />
plant. Operators <strong>of</strong> the plant have participated in a thorough training program in plant<br />
operations and emergency incidents (including chemical spills, leaks and containment<br />
procedures).<br />
Roadways and Overcrossings — Sunnyvale has 46 major roadway over-crossings and<br />
bridges on streets and freeways within <strong>City</strong> limits. Sunnyvale has completed seismic<br />
retr<strong>of</strong>itting for all over-crossings in the <strong>City</strong> <strong>of</strong> Sunnyvale. The Mathilda overcrossing<br />
at Evelyn is scheduled for modernization and widening to be completed with the most<br />
recent seismic safety standards by <strong>2011</strong>.<br />
See em-1, em-2, em-3<br />
and em-4 (Water supply)<br />
for further discussion and<br />
policies in the environmental<br />
Management Chapter.<br />
6–13
<strong>City</strong> <strong>of</strong> Sunnyvale GeneRal plan – July <strong>2011</strong><br />
for more information about<br />
the levee system, see the<br />
flood hazards discussion.<br />
See Goal sn-1 (acceptable<br />
levels <strong>of</strong> risk for natural<br />
and Human-caused Hazards)<br />
for a discussion <strong>of</strong> lifelines.<br />
6–14<br />
policy sn-1.8 MAinTAin liFelineS in good oPeRATing CondiTion<br />
To leSSen dAMAge And inCReASe SuRvivAbiliTY AFTeR A MAJoR<br />
diSASTeR. (Previously Safety Policy A5)<br />
n SN-1.8a Study, evaluate and fund the improvements needed to the levee system at the<br />
Water Pollution Control Plant to increase its ability to survive a major earthquake.<br />
(Previously Seismic Safety and Safety Key Initiative A.5.3)<br />
n SN-1.8b Actively pursue funding for the undergrounding <strong>of</strong> utilities in accordance<br />
with the principals and guidelines <strong>of</strong> Public Utilities Commission and PG&E Tariff<br />
Rule 20-A. (Previously Seismic Safety and Safety Key Initiative A.5.4)<br />
Goal Sn-2<br />
effeCtive diSaSter preparedneSS<br />
enSuRe ThAT The CiTY, iTS CoMMuniTY MeMbeRS, buSineSS, FAiTh-bASed<br />
oRgAnizATionS, CoMMuniTY oRgAnizATionS And SPeCiAl needS<br />
PoPulATionS ARe PRePARed To eFFeCTivelY ReSPond And ReCoveR FRoM<br />
MAJoR diSASTeRS And eMeRgenCieS. (Previously Seismic Safety and Safety<br />
Mission B and C Combined / Adopted in 2008)<br />
There is a difference between the day-to-day response to emergencies and the response<br />
needed to meet the demands <strong>of</strong> a disaster. <strong>City</strong> Departments respond to the routine<br />
emergencies <strong>of</strong> the community. However, disasters pose a different set <strong>of</strong> demands that the<br />
normal resources and established levels <strong>of</strong> service cannot meet. In general terms, a disaster<br />
is defined as an emergency event which exceeds the capacity <strong>of</strong> the <strong>City</strong> to handle it in the<br />
same manner as it handles the day-to-day emergencies. Effective disaster management<br />
requires the <strong>City</strong> to use all <strong>of</strong> its resources to meet emergency needs.<br />
The overall strategy <strong>of</strong> disaster management is to provide for an integrated approach to<br />
preventing, planning, responding, preparing and mitigating disasters.<br />
Isolation after a Disaster<br />
Neighborhood and/or community isolation after a disaster such as a major earthquake is<br />
likely as some normal transportation routes and communication lines may be damaged<br />
during such an event. Internal isolation occurs when the <strong>City</strong>’s ability to receive reports<br />
<strong>of</strong> emergencies, relay emergency information and respond to citizen’s requests for help<br />
is limited by destroyed or damaged lifelines. External isolation occurs when the <strong>City</strong>’s<br />
ability to communicate emergency conditions and the ability to request or receive<br />
outside emergency resources is lost due to destroyed or damaged lifelines. When these<br />
effects delay or prevent the delivery <strong>of</strong> emergency services into affected areas it increases<br />
the level <strong>of</strong> risk to persons and property.
safety and noise — hazaRds and disasteR pRepaRedness and Response Chapter 6<br />
Emergency Planning and Coordination<br />
Responsibility for preparing for emergencies lies both with the <strong>City</strong> and the members<br />
<strong>of</strong> the community. No government agency has all the resources needed to respond to all<br />
the needs <strong>of</strong> its community members in or after a disaster. The <strong>City</strong> has established an<br />
emergency management program to coordinate emergency planning for neighborhoods,<br />
schools and businesses. When <strong>City</strong> resources are exhausted and a local emergency has<br />
been declared, outside assistance can be requested through an established network <strong>of</strong><br />
local, operational area, regional, state and federal mutual aid.<br />
Community and Staff Notification Systems<br />
Public Safety has automated a notification system that uses two different methods<br />
to rapidly notify personnel for emergencies. The first method is the rapid, automatic<br />
notification <strong>of</strong> specific groups <strong>of</strong> staff members identified as having certain needed<br />
skills sets, such as SWAT, Hazardous Materials, Accident Investigation teams and DPS<br />
administration. Santa Clara County also has a Web base that allows any subscriber in<br />
the county to enter their phone number, usually cell number, and e-mail address. Santa<br />
Clara County implemented a system which includes this Web-based “reverse 911” type<br />
system in 2010.<br />
Community Resources<br />
One <strong>of</strong> the <strong>City</strong>’s greatest resources is its people. When a disaster — natural or manmade<br />
— strikes a community, spontaneous, unaffiliated volunteers — neighbors and<br />
residents — <strong>of</strong>ten arrive on-site at a disaster ready to help. As seen in previous disasters<br />
(e.g. Loma Prieta Earthquake, September 11 tragedy, Hurricane Katrina, etc.) affiliated<br />
and unaffiliated volunteers willingly and in unprecedented numbers, will do anything<br />
to provide assistance in recovery efforts including <strong>of</strong>fice work, treating the injured,<br />
looking for the missing, making signs, removing debris from collapsed structures and<br />
interviewing other volunteers. In Santa Clara County, specifically in Sunnyvale, the <strong>City</strong><br />
is providing the means beforehand to identify and train affiliated volunteers and have<br />
in place an Emergency Volunteer Plan to address the needs <strong>of</strong> unaffiliated volunteers.<br />
Unaffiliated volunteers are not part <strong>of</strong> a recognized voluntary agency and <strong>of</strong>ten have<br />
no formal training in emergency response. They are not <strong>of</strong>ficially invited to become<br />
involved but are motivated by a sudden desire to help others in times <strong>of</strong> trouble. They<br />
come with a variety <strong>of</strong> skills. They may come from within the affected area or from<br />
outside the area.<br />
Volunteer and resource programs include:<br />
n Sunnyvale Neighborhoods Actively Prepare (SNAP) — a program to educate and<br />
train our residents to take care <strong>of</strong> themselves in the aftermath <strong>of</strong> a major disaster.<br />
n Project Ark — a disaster shelter program that involves emergency containers called<br />
“ARKS” placed at eight school sites around the <strong>City</strong>.<br />
affiliated volunteers are<br />
attached to a recognized<br />
voluntary organization<br />
and are trained for specific<br />
disaster response activities.<br />
their relationship with the<br />
organization precedes the<br />
immediate disaster and<br />
they are invited by that<br />
organization to become<br />
involved in a particular<br />
aspect <strong>of</strong> emergency<br />
management. an example<br />
<strong>of</strong> affiliated volunteers is<br />
Sunnyvale amateur radio<br />
emergency Services (SareS).<br />
6–15
<strong>City</strong> <strong>of</strong> Sunnyvale GeneRal plan – July <strong>2011</strong><br />
for more information<br />
on the <strong>City</strong>’s emergency<br />
preparedness and volunteer<br />
programs and other resources,<br />
see oes.inSunnyvale.com<br />
See Goal sn-1 (recognition <strong>of</strong><br />
natural and Human-caused<br />
Hazards) for further discussion<br />
and policies on hazards and<br />
generalplan.inSunnyvale.<br />
com for the local hazard<br />
Mitigation plan (lhMp).<br />
6–16<br />
n Sunnyvale Amateur Radio Emergency Services (SARES) — an organization <strong>of</strong><br />
more than 100 amateur radio operators in the community that provide assistance to<br />
the <strong>City</strong> at both routine special events, when additional radio communications are<br />
needed and during emergencies/disasters.<br />
n Volunteer Emergency Response Team (VERT) — a team created by the <strong>City</strong> <strong>of</strong><br />
Sunnyvale to organize emergency volunteers.<br />
n Volunteer Center — a countywide workgroup sponsored by the Volunteer Center<br />
<strong>of</strong> Silicon Valley and the Emergency Manager’s association to plan and coordinate<br />
volunteers during a major disaster or emergency.<br />
n <strong>City</strong> Disaster Workers (DSW) — a training given to all <strong>City</strong> employees to enable<br />
them to remain at, or report back to work in the event <strong>of</strong> a disaster.<br />
n Other <strong>City</strong> Volunteering Efforts — the <strong>City</strong> allows employees to volunteer for<br />
disaster relief efforts during normal work hours with <strong>City</strong> approval.<br />
Post Disaster Recovery<br />
The recovery from a disaster needs to be as well planned as the initial emergency<br />
response. When a community has been devastated by a disaster, pressure from displaced<br />
businesses and families to rebuild as quickly as possible can be overwhelming for the<br />
local Planning Commission and <strong>City</strong> Council. If this happens, little thought will be<br />
given to correcting past mistakes, evaluating changes in land usage and their long-range<br />
effects on a community. A community can effectively plan to recover from a disaster and<br />
with thoughtful planning; those strategies will provide a framework for the recovery.<br />
In 2005, ABAG received grant funds to assist local agencies to comply with the Disaster<br />
Mitigation Act <strong>of</strong> 2000 requirements. ABAG invited local agencies to participate and<br />
complete the detailed planning necessary to create a pre-disaster mitigation plan.<br />
ABAG completed a regional plan for the nine Bay Area counties which was adopted by<br />
ABAG on March 17, 2005 after being approved by FEMA. Local agencies were given the<br />
opportunity to partner with ABAG to reduce the staff time required to complete a plan.<br />
Sunnyvale staff participated with ABAG and completed a FEMA approved Local Annex<br />
to the approved ABAG Plan in 2005. The plan is part <strong>of</strong> an overall strategy to reduce<br />
or eliminate long term risk to life and property from a natural hazard event. Adoption<br />
<strong>of</strong> the “Local Annex” as a part <strong>of</strong> the overall plan better prepares Sunnyvale for future<br />
emergencies and allows the <strong>City</strong> to apply for FEMA grant funds to mitigate existing risks.<br />
Sunnyvale’s 2005 Local Hazard Mitigation Plan (LHMP) Annex focuses on the nine<br />
likely hazards to occur in the Bay Area. The nine hazards are five earthquake related<br />
hazards – faulting, shaking, landslides, liquefaction and tsunamis; and four weather<br />
related hazards – flooding, landslides, wildfires and drought.) The LHMP continues to<br />
be examined and analyzed for future needed changes that may develop in the area <strong>of</strong><br />
recovery. This plan will be updated periodically.
safety and noise — hazaRds and disasteR pRepaRedness and Response Chapter 6<br />
policy sn-2.1 ConSTRuCT oR MAinTAin CiTY FACiliTieS uTilized FoR<br />
eMeRgenCY ReSPonSe To eSSenTiAl SeRviCeS buildingS, So ThAT<br />
TheY ReMAin oPeRAble AFTeR A MAJoR SeiSMiC evenT. (Previously Safety<br />
Policy B1)<br />
policy sn-2.2 PRovide FoR The eMeRgenCY MAnAgeMenT oF The CiTY<br />
in oRdeR To ReSPond eFFeCTivelY And To ASSuRe liFe And PRoPeRTY<br />
SAFeTY in The evenT oF A diSASTeR. (Previously Safety Policy B2)<br />
n SN-2.2a Develop an alternate Emergency Operations Center site, in the event <strong>of</strong> loss<br />
<strong>of</strong> the primary site. (Previously Safety Key Initiative B.2.4)<br />
policy sn-2.3 PRovide An inTegRATed APPRoACh To PlAnning<br />
And MAnAgeMenT FoR eMeRgenCieS And diSASTeRS. (Previously Safety<br />
Policy B3)<br />
policy sn-2.4 PRovide inFoRMATion, ASSiSTAnCe And<br />
enCouRAgeMenT To CoMMuniTY MeMbeRS, PubliC/PRivATe SChoolS,<br />
dAY CARe CenTeRS, buSineSS And induSTRY To ASSiST in TheiR<br />
PlAnning And PRePARedneSS FoR eMeRgenCieS And diSASTeRS.<br />
(Previously Safety Policy B4, B5 and B6)<br />
policy sn-2.5 PRovide eMeRgenCY RAdio oR oTheR CoMMuniCATion<br />
deviCeS FoR CooRdinATion oF eMeRgenCY ReSPonSe And The<br />
CAPAbiliTY To CoMMuniCATe wiTh ouTSide AgenCieS And CoMMuniTY<br />
MeMbeRS. (Previously Safety Policy B7)<br />
6–17
<strong>City</strong> <strong>of</strong> Sunnyvale GeneRal plan – July <strong>2011</strong><br />
6–18<br />
policy sn-2.6 ACTivelY Seek And APPlY FoR gRAnT Funding FRoM<br />
AvAilAble goveRnMenTAl And PRivATe SouRCeS ThAT would<br />
enhAnCe eMeRgenCY PRePARedneSS. (Previously Safety Policy B8)<br />
policy sn-2.7 PRovide FoR The ConTinuATion oF CiTY goveRnMenT<br />
And SeRviCeS Following A MAJoR diSASTeR AS QuiCklY AS FeASible.<br />
(Previously Safety Policy C1)<br />
policy sn-2.8 enCouRAge CoMMuniTY MeMbeRS And buSineSS/<br />
induSTRY To PlAn FoR ReCoveRY FRoM diSASTeRS AS QuiCklY AS<br />
FeASible. (Previously Safety Policy C2)<br />
poliCe, fire and eMerGenCy ServiCeS<br />
Goal Sn-3<br />
Safe and SeCure <strong>City</strong><br />
enSuRe A SAFe And SeCuRe enviRonMenT FoR PeoPle And PRoPeRTY in The<br />
CoMMuniTY bY PRoviding eFFeCTive PubliC SAFeTY ReSPonSe And PRevenTion<br />
And eduCATion SeRviCeS (Previously Law Enforcement Goal 4.1A and 4.1B/<br />
Adopted in 1995)<br />
Community safety is the top priority for the <strong>City</strong>. The community, both residents and<br />
visitors, must feel fundamentally safe while living, working or conducting daily activities<br />
within the <strong>City</strong> <strong>of</strong> Sunnyvale. This is accomplished in many ways; from prevention <strong>of</strong><br />
the crime before it occurs, to patrol response to the emergency, to investigation <strong>of</strong> the<br />
crime once the initial report has been written. In addition to crime prevention and<br />
investigation, there are non-criminal emergencies as well as traffic related community<br />
safety concerns.<br />
The <strong>City</strong>’s crime prevention function has two aspects: Eliminating the desire and<br />
eliminating the opportunity to commit crime. While it may be more difficult to<br />
eliminate one’s desire to commit a crime, the <strong>City</strong> can lessen the desire by taking away<br />
the opportunities. Current crime prevention techniques include the environmental
safety and noise — police, fiRe and emeRGency seRvices Chapter 6<br />
design <strong>of</strong> residential and commercial developments, neighborhood watch programs,<br />
community education in sexual assault awareness and robbery prevention and high<br />
visibility patrol.<br />
One <strong>of</strong> the key elements <strong>of</strong> any successful crime prevention program is community<br />
involvement. This is accomplished by reaching out to citizens <strong>of</strong> all ages and socioeconomic<br />
background. The <strong>City</strong> has forged these relationships in the schools,<br />
neighborhood groups and fraternal organizations and within the business community.<br />
Over the last several years Public Safety has utilized the Problem Oriented Policing<br />
model for identifying potential trouble spots within the <strong>City</strong> and expending available<br />
resources to help clean the area up and avoid having a rising crime rate. The addition <strong>of</strong><br />
the Neighborhood Preservation Unit (NP) and the Neighborhood Enhancement Action<br />
Team (NEAT) are two such resources that assist with identifying areas <strong>of</strong> the <strong>City</strong> which<br />
may turn into problem areas. NP and NEAT pro-actively survey neighborhoods and<br />
help rid them <strong>of</strong> blight like overgrown weeds, graffiti, broken windows and general rundown<br />
residential and commercial properties. NEAT works with the residents, landlords<br />
and business owners to address property appearance, crime within the neighborhood<br />
and quality <strong>of</strong> life issues. Addressing and correcting these issues makes for a safer,<br />
friendlier environment.<br />
When the desire for crime continues to exist, the need for fundamentally sound patrol<br />
response and skilled investigative follow up become key elements. These two key elements<br />
help keep the overall crime rate low, which routinely places the <strong>City</strong> <strong>of</strong> Sunnyvale as one<br />
<strong>of</strong> the top 10 safest cities in America with a population greater than 100,000. These<br />
crime rates are derived from the Uniformed Crime Report that is published yearly by<br />
the Federal Bureau <strong>of</strong> Investigation. The report is based on crime statistics provided<br />
from police departments across the nation.<br />
Technology and Public Safety<br />
As technology around the world continues to develop, the <strong>City</strong> keeps its pace and worked<br />
with private sector vendors to increase its technological capabilities. In fiscal year 2010/11,<br />
a third generation Mobile Dispatch Terminal called Mobilcom was installed in police<br />
and fire apparatus. This new technology will enable dispatch to send the closest unit(s)<br />
to an emergency call, thereby further reducing our response times. Mobilcom also allows<br />
the infield end users access to information on local, state and federal data bases as well as<br />
internet links such as Google Earth to assist with the investigation <strong>of</strong> crimes.<br />
Other technological advances being pursued and implemented are shared statewide<br />
Records Information Systems (RMS). These systems allows for input and retrieval <strong>of</strong><br />
suspect, vehicle, stolen property and other pertinent information that assists to the<br />
apprehension <strong>of</strong> criminals within our communities.<br />
Within Public Safety’s own databases are technological tools for the <strong>of</strong>ficers and citizens<br />
that provide real time crime information. All <strong>of</strong> these technology tools are utilized by<br />
the Crime Analyst to track crime trends by types <strong>of</strong> crimes, the areas where they are<br />
occurring, day <strong>of</strong> the week and time <strong>of</strong> day. The Crime Analyst also compiles suspect data<br />
from the crime reports to assist the <strong>of</strong>ficers with identifying gang activity within the <strong>City</strong>.<br />
See Goal sn-4 (public<br />
confidence in police<br />
services) for further<br />
information on community<br />
relationships, including<br />
neighborhood resource<br />
<strong>of</strong>ficers and Challenge team<br />
Sunnyvale.<br />
See Community Condition<br />
indicators at GeneralPlan.<br />
InSunnyvale.com for yearly<br />
crime statistics.<br />
See Goal He-2 (maintain and<br />
enhance the conditions and<br />
affordability <strong>of</strong> existing<br />
Housing) for further<br />
information and policies on<br />
neighborhood preservation<br />
and rehabilitation programs.<br />
6–19
<strong>City</strong> <strong>of</strong> Sunnyvale GeneRal plan – July <strong>2011</strong><br />
for more information<br />
about the department <strong>of</strong><br />
public Safety’s programs,<br />
see dps.inSunnyvale.com<br />
6–20<br />
In the future we can look forward to further technological advances in tracking crime<br />
trends as well as interoperability between jurisdictions with RMS and communications<br />
systems.<br />
policy sn-3.1 PRovide RAPid And TiMelY ReSPonSe To All<br />
eMeRgenCieS. (Previously Law Enforcement Policy 4.1A.1)<br />
policy sn-3.2 ConTRol ConduCT ReCognized AS ThReATening To<br />
liFe And PRoPeRTY. (Previously Law Enforcement Policy 4.1A.2)<br />
policy sn-3.3 PRovide inveSTigATive SeRviCeS diReCTed TowARd<br />
SuCCeSSFul PRoSeCuTion And ConviCTion oF CRiMinAl oFFendeRS.<br />
(Previously Law Enforcement Policy 4.1.A.3)<br />
policy sn-3.4 ReduCe CRiMe And FeAR bY STRengThening The PoliCe/<br />
CoMMuniTY PARTneRShiP. (Previously Law Enforcement Policy 4.1A.4)<br />
policy sn-3.5 FACiliTATe The SAFe MoveMenT oF PedeSTRiAnS,<br />
biCYCliSTS And vehiCleS. (Previously Law Enforcement Policy 4.1A.5)<br />
policy sn-3.6 Aid ThoSe who CAnnoT CARe FoR TheMSelveS<br />
(inToxiCATed, AddiCTed, MenTAllY ill, PhYSiCAllY diSAbled, The<br />
Young, The old). (Previously Law Enforcement Policy 4.1B.1)
safety and noise — police, fiRe and emeRGency seRvices Chapter 6<br />
policy sn-3.7 PRovide CRiSiS inTeRvenTion, ConFliCT MAnAgeMenT<br />
And ReSoluTion. (Previously Law Enforcement Policy 4.1B.2)<br />
Goal Sn-4<br />
puBliC ConfidenCe in poliCe ServiCeS<br />
inCReASe And MAinTAin PubliC ConFidenCe in The AbiliTY oF The PubliC<br />
SAFeTY dePARTMenT To PRovide QuAliTY PoliCe SeRviCeS (Previously Law<br />
Enforcement Goal 4.1C / Adopted in 1995)<br />
Public confidence is the cornerstone <strong>of</strong> a successful law enforcement organization. A<br />
police agency that is disengaged from the community cannot possibly meet the demands<br />
<strong>of</strong> modern day law enforcement operations and the expectations <strong>of</strong> today’s society. As<br />
an agency builds the confidence <strong>of</strong> the community, the public <strong>of</strong>ten feels comfortable<br />
contacting law enforcement to request assistance or to relay information. The agency<br />
that quickly responds to this contact with a pr<strong>of</strong>essional, well trained and well equipped<br />
police force, stands to further build trust with the community that ultimately leads<br />
to an enhanced quality <strong>of</strong> service. A pr<strong>of</strong>essional organization that approaches each<br />
community contact as an opportunity to establish a deep connection with the citizen<br />
will likely be rewarded with information that can be utilized to effectively and efficiently<br />
provide the needed services, whether that is the investigation <strong>of</strong> a homicide or the<br />
resolution <strong>of</strong> a neighborhood dispute.<br />
Pr<strong>of</strong>essional Standards and the Public Safety Assurance <strong>of</strong> Quality Control<br />
In order to sustain the successes <strong>of</strong> community confidence building efforts, an agency<br />
must provide feedback to the community about investigations <strong>of</strong> criminal acts or<br />
complaints related to the conduct <strong>of</strong> <strong>of</strong>ficers, to the degree possible. The public must<br />
know that the information that is provided to the police is actually being utilized to<br />
solve the crime that they reported or to improve the service delivered to the community.<br />
Often times this type <strong>of</strong> community confidence is enhanced through mandatory<br />
reporting requirements currently utilized by all agencies in Santa Clara County.<br />
Public Safety participates in all County level sub-committees charged with creating<br />
and reviewing county reporting protocols and the mandatory reporting requirements<br />
contained within them.<br />
Citizen commendations and complaints provide the <strong>City</strong> with valuable information for<br />
evaluating employee performance, identifying areas <strong>of</strong> police misconduct, monitoring<br />
police relations with the public and identifying the need for new or revised policies<br />
or improved training. For these reasons, citizens are encouraged to report both<br />
commendations and matters <strong>of</strong> misconduct to the <strong>City</strong>.<br />
6–21
<strong>City</strong> <strong>of</strong> Sunnyvale GeneRal plan – July <strong>2011</strong><br />
6–22<br />
Neighborhood Resource Officers<br />
The Department <strong>of</strong> Public Safety takes pride in being connected to community.<br />
More than 30 years ago, the Neighborhood Resource Officer position was created.<br />
The primary focus <strong>of</strong> these <strong>of</strong>ficers is to be in schools connecting with children and<br />
teachers. Additionally, these <strong>of</strong>ficers provide service to neighborhoods and the business<br />
community in the form <strong>of</strong> crime prevention tips and neighborhood conflict resolution.<br />
This direct contact will sustain and enhance public trust now and into the future.<br />
Challenge Team Sunnyvale<br />
In 2007, Public Safety created the “Challenge Team Sunnyvale.” Monthly, members <strong>of</strong><br />
the community meet at Public Safety Headquarters to discuss youth and community<br />
issues. These community members represent the business community, nonpr<strong>of</strong>it<br />
organizations, health care pr<strong>of</strong>essionals, faith base organizations, judicial representatives<br />
and law enforcement. The team has brought resources together to sponsor youth<br />
activities, mentoring programs and the group is currently working towards a public/<br />
private collaboration that will be designed to bring youth services to underserved areas<br />
<strong>of</strong> the community. It is this deep connection that will sustain community confidence<br />
and enhance public trust into the future.<br />
Continuously Enhancing Community Connections<br />
In 2004, the <strong>City</strong> requested the assistance <strong>of</strong> the Police Executive Research Forum (PERF)<br />
to evaluate our community outreach efforts and provide suggestions to strengthen our<br />
valued relationship with the public. The Neighborhood Resource Officer position,<br />
as well as the entire Crime Prevention Unit in the Department <strong>of</strong> Public Safety, was<br />
highlighted as key to enhancing connections with the community and strengthening<br />
public trust.<br />
The study determined that citizens in the <strong>City</strong> <strong>of</strong> Sunnyvale feel safe in the community<br />
and are extremely satisfied with the delivery <strong>of</strong> police services. PERF did point out<br />
several areas by which the department could create a deeper connection with the public.<br />
The study suggested enhancements to the Public Safety website and the use <strong>of</strong> the<br />
media to highlight Public Safety activities. The <strong>City</strong> <strong>of</strong> Sunnyvale has made substantive<br />
changes to the website designed to highlight services available and enhance the public’s<br />
experience. In addition, the <strong>City</strong> is currently utilizing social media and an e-newsletter<br />
designed to highlight activities and bring transparency to operations.<br />
The <strong>City</strong> will continue to explore the benefits <strong>of</strong> the utilization <strong>of</strong> social media and<br />
the use <strong>of</strong> smart phone technology to open avenues <strong>of</strong> communication with the public<br />
and provide transparency to the community. In addition to non-traditional methods,<br />
the <strong>City</strong> emphasizes connections in non-traditional settings. Connecting Public Safety<br />
Officers with other <strong>City</strong> departments, such as Economic Development and Community<br />
Services, enhances service to the public. These types <strong>of</strong> relationships break down<br />
barriers and perceptions, leading to significant enhancements <strong>of</strong> public trust.
safety and noise — police, fiRe and emeRGency seRvices Chapter 6<br />
policy sn-4.1 PRovide inSPeCTion And ConTRol oF PeRSonnel And<br />
dePARTMenT oPeRATionS whiCh iS ReSPonSive To CiTizenS’ ConCeRnS.<br />
(Previously Law Enforcement Policy 4.1C.2)<br />
policy sn-4.2 PRovide FoR ASSeSSMenT oF ChAnging CoMMuniTY<br />
needS And exPeCTATionS. (Previously Law Enforcement Policy 4.1C.1)<br />
n SN-4.2a Identify means <strong>of</strong> measuring citizen satisfaction with police services.<br />
(Previously Law Enforcement Action Statement 4.1C.2a)<br />
Goal Sn-5<br />
effeCtive fire ServiCe reSponSe SySteM<br />
PRovide A FiRe SeRviCe ReSPonSe SYSTeM ThAT will ConTRol The SPReAd oF<br />
FiRe in buildingS And oTheR PRoPeRTieS And MAinTAin MiniMAl CASuAlTieS<br />
And PRoPeRTY loSS FRoM FiRe And oTheR RelATed eMeRgenCieS (Previously<br />
Fire Services Goal 4.2A/ Adopted in 1995)<br />
Structure fires are the foundation for most firefighting, training, equipment and policy<br />
decisions. While representing only a small percent <strong>of</strong> total calls for service, structure<br />
fires pose the greatest threat to life, safety and high dollar property loss and a quick<br />
response to emergency incidents is essential.<br />
A strong fire prevention program is a necessity for a safe community. An appropriate<br />
combination <strong>of</strong> building and life safety codes, ordinances, permitting processes,<br />
inspection and enforcement efforts and public education are all vital components <strong>of</strong><br />
such a program. Providing fire safety education to buildings with greater than average<br />
fire and life hazard potential, such as schools, hotels, restaurants, nursing homes, high<br />
density housing and other public assemblies is crucial to increasing life safety and<br />
reducing property loss.<br />
On average, the Fire Services Division responds to approximately 7,300 calls for service<br />
annually. Of those calls for service, approximately 70 percent are Emergency Medical<br />
(EMS) calls. Per year, the Division responds to approximately 620 hazardous material<br />
calls and 140 structure fires. There are six fire stations in the city, all <strong>of</strong> which were<br />
remodeled between 1998 and 1999. The stations are situated throughout the city, based<br />
on a combination <strong>of</strong> call volume and response time. The department has mutual aid<br />
and/or auto aid agreements with Santa Clara County Fire, San Jose Fire, Mountain<br />
See Goal sn-1 (acceptable<br />
levels <strong>of</strong> risk for natural<br />
and Human-caused Hazards)<br />
for additional discussion <strong>of</strong><br />
fire hazards and response.<br />
6–23
<strong>City</strong> <strong>of</strong> Sunnyvale GeneRal plan – July <strong>2011</strong><br />
for more information<br />
on the fire Services<br />
program, see fireprevention.<br />
inSunnyvale.com<br />
6–24<br />
View Fire and Santa Clara (<strong>City</strong>) Fire. These agreements cover responses to freeway<br />
incidents and structure fire incidents, in areas <strong>of</strong> common shared boundaries between<br />
jurisdictions.<br />
An <strong>of</strong>ten-cited measure <strong>of</strong> fire suppression capability is the rating assigned to a department<br />
by the nationally recognized Insurance Services Office (ISO). The ISO is a subsidiary<br />
<strong>of</strong> a publicly traded company and acts as an advisory organization which provides<br />
information that insurance companies may use to establish premium costs. The rating<br />
is based on, among other things, fire alarm and communications systems, telephone and<br />
dispatching systems, fire equipment, staffing, training and geographic distribution <strong>of</strong><br />
fire stations. Based on all this information, the ISO assigns a classification rating from<br />
1-10. Sunnyvale has an ISO rating <strong>of</strong> 2, which falls within the ‘superior’ category.<br />
During fiscal year 2009/2010, fifteen Fire Services vehicles were equipped with Mobile<br />
Dispatch Terminals (MDT’s), with funding provided by the Assistance to Firefighters<br />
grant. The MDT’s improve Fire Services response capabilities through the use <strong>of</strong> state-<strong>of</strong>the-art<br />
technology, which provides field response data and field mapping. This technology<br />
allows fire personnel to reduce the response time to fire and EMS emergencies.<br />
The next phase <strong>of</strong> the MDT implementation is the use <strong>of</strong> GPS-based dispatching.<br />
This technology will utilize a program called Automated Vehicle Locator (AVL). This<br />
program will allow the dispatcher’s Computer Aided Dispatch (CAD) to identify the<br />
fire apparatus which is closest to the call being received and prompting the dispatch <strong>of</strong><br />
that apparatus.<br />
On a regional level, the issue <strong>of</strong> consolidating fire apparatus maintenance is being<br />
discussed and explored. Currently, all nine providers <strong>of</strong> fire service in the county run<br />
their own in-house maintenance unit. Developing shared maintenance facilities will<br />
most likely provide economies <strong>of</strong> scale and cost savings for participating departments,<br />
in addition to enhanced coverage <strong>of</strong> service.<br />
policy sn-5.1 ASSuRe ThAT eQuiPMenT And FACiliTieS ARe PRovided<br />
And MAinTAined To MeeT ReASonAble STAndARdS oF SAFeTY,<br />
dePendAbiliTY And CoMPATibiliTY wiTh FiRe SeRviCe oPeRATionS.<br />
(Previously Fire Services Policy 4.2A.1)<br />
policy sn-5.2 PRovide TRAining ThAT iS AdeQuATe FoR ReQuiRed<br />
duTieS. (Previously Fire Services Policy 4.2A.2)
safety and noise — police, fiRe and emeRGency seRvices Chapter 6<br />
policy sn-5.3 ReSPond To ReQueST FoR SeRviCeS. (Previously Fire<br />
Services Policy 4.2A.3)<br />
policy sn-5.4 ConduCT Field oPeRATionS And eMeRgenCY SCene<br />
MAnAgeMenT in A SAFe, eFFeCTive And eFFiCienT MAnneR. (Previously<br />
Fire Services Policy 4.2A.4)<br />
n SN-5.4a Maintain a system <strong>of</strong> pre-fire surveys for selected buildings and provide<br />
critical information that is immediately available to responding emergency personnel<br />
should an incident occur. Fully integrate all pre-fire surveys into apparatus-based<br />
CAD’s, in order to provide pre-fire survey information “on-line” at emergency<br />
scenes. (Previously Fire Services Action Statement 4.2A.4b)<br />
n SN-5.4b Take measures that reduce the number <strong>of</strong> false alarms. (Previously Action<br />
Statement 4.2A.4f)<br />
Goal Sn-6<br />
effeCtive eMerGenCy reSponSe CapaBility<br />
PRovide eFFeCTive ReSPonSe CAPAbiliTY FoR eMeRgenCY MediCAl evenTS And<br />
oTheR non-FiRe inCidenTS ThAT MAY diReCTlY endAngeR The liveS, PRoPeRTY<br />
And well-being oF The CoMMuniTY. (Previously Fire Services Goal 4.2B /<br />
Adopted in 1995)<br />
The Department <strong>of</strong> Public Safety participates in an emergency medical services (EMS)<br />
system that is integrated into the larger Santa Clara County Emergency Medical Services<br />
System. This system provides for Basic Life Support (BLS) response by Public Safety<br />
resources followed by Advanced Life Support (ALS) response by the County <strong>of</strong> Santa Clara.<br />
This tiered response system efficiently utilizes resources within a cost effective manner.<br />
The EMS system within California is governed by county and state regulations as well<br />
as court decisions. Through this regulatory system, the County <strong>of</strong> Santa Clara holds<br />
the exclusive rights to operate the ALS paramedic transport system. The County <strong>of</strong><br />
Santa Clara is responsible for the medical oversight <strong>of</strong> the EMS system, including the<br />
care provided by Public Safety personnel. Public Safety maintains a physician medical<br />
director to meet regulatory and statutory requirements for equipment purchases and<br />
mandatory internal quality improvement activities. Public Safety is a State <strong>of</strong> California<br />
Certifying Entity and an approved EMT-Basic Training Program and is able to train,<br />
certify and recertify our own personnel as EMT-Basic providers.<br />
See Goal sn-1 (acceptable<br />
levels <strong>of</strong> risk for natural<br />
and Human-caused Hazards)<br />
for a discussion <strong>of</strong> hazardous<br />
materials risks and response.<br />
6–25
<strong>City</strong> <strong>of</strong> Sunnyvale GeneRal plan – July <strong>2011</strong><br />
6–26<br />
In 1996, Public Safety implemented an early defibrillation program, which allowed<br />
public safety personnel to utilize an AED to treat patients in cardiac arrest. Changes in<br />
California law provide the opportunity to add AEDs to <strong>City</strong> facilities for use by nontraditional<br />
responders and laypersons. Sunnyvale was one <strong>of</strong> the first communities in<br />
the California to implement the program. Many cardiac arrest victims have been saved<br />
by Public Safety personnel as well as residents and visitors to our <strong>City</strong> facilities through<br />
the use <strong>of</strong> these AEDs.<br />
The County <strong>of</strong> Santa Clara contracts with a vendor to provide a fee-for-service paramedic<br />
transport system for all <strong>of</strong> Santa Clara County with the exception <strong>of</strong> the <strong>City</strong> <strong>of</strong> Palo<br />
Alto who maintains their own fire department based paramedic transport service. The<br />
Santa Clara County Paramedic Ambulance Contract sets response time standards for<br />
the vendor that applies throughout the County.<br />
Sunnyvale is the only city in Santa Clara County that does not provide paramedic<br />
services though its own or contracted fire service provider. This provides the <strong>City</strong> little<br />
opportunity to affect change. Since the inception <strong>of</strong> paramedic services in Santa Clara<br />
County, Public Safety has brought to Council options to provide paramedic services<br />
within the Public Safety model. Public Safety will continue to monitor the County’s<br />
paramedic service provision. Public Safety will evaluate the options/opportunities to<br />
deliver paramedic services within the Department <strong>of</strong> Public Safety and will periodically<br />
report to Council its findings.<br />
Within this ongoing paramedic evaluation process, the <strong>City</strong> will utilize advances in<br />
technology to help reduce response times. Scheduled for completion in <strong>2011</strong> is the<br />
establishment <strong>of</strong> a link between the Public Safety Dispatch computers and County<br />
Communications to decrease the response time <strong>of</strong> paramedics. As in-vehicle GPS<br />
becomes more accessible, closest-unit dispatching will be explored to further reduce<br />
response times to medical emergencies.<br />
policy sn-6.1 PRovide iMMediATe liFe SuPPoRT To ThoSe ThReATened<br />
bY SiTuATionS ReQuiRing eMeRgenCY MediCAl SeRviCeS oR ReSCue.<br />
(Previously Fire Services Policy 4.2B.1)<br />
n SN-6.1a Study and where feasible, provide alternate methods <strong>of</strong> emergency medical<br />
service delivery when it is determined to be more efficient and beneficial to those<br />
in need. Consider EMT-P level training. (Previously Fire Services Action Statement<br />
4.2B.1b)
Goal Sn-7<br />
effeCtive eMerGenCy CoMMuniCation ServiCeS<br />
PRovide eMeRgenCY CoMMuniCATionS SeRviCeS (Previously Support Services<br />
Goal 4.3D / Adopted in 1988)<br />
The Sunnyvale Department <strong>of</strong> Public Safety Dispatch Center provides a public safety<br />
answer point twenty four hours a day 365 days a year. This is a critical link between the<br />
<strong>City</strong>’s emergency services, first responders and its citizens, and is the primary method<br />
<strong>of</strong> coordination <strong>of</strong> Public Safety services. When a citizen has a complaint, problem,<br />
or emergency, virtually all <strong>of</strong> this information is channeled through the Public Safety<br />
Dispatch Center, which then disseminates and/or dispatches the information to Public<br />
Safety responders or allied agencies/departments. The Dispatch Center handles tens<br />
<strong>of</strong> thousands <strong>of</strong> calls for service each year, including many calls from non-English<br />
speaking citizens. With the advent <strong>of</strong> cellular phones as well as a growing population,<br />
the numbers <strong>of</strong> calls have increased dramatically and most likely will continue into the<br />
foreseeable future.<br />
Most calls coming into the Dispatch Center are either fire or police-related. These<br />
include crimes in progress, medical emergencies and fires. The timely transmission <strong>of</strong><br />
information to field units is critical to enabling successful outcomes. As such, training,<br />
the use <strong>of</strong> new technology and interoperability enables the communications dispatchers<br />
to effectively gather and disseminate information more efficiently.<br />
The Department <strong>of</strong> Homeland Security has stated that interoperability is a top priority<br />
for Public Safety agencies nationwide. The purpose <strong>of</strong> this interoperability goal is to<br />
connect voice and data communications for near real-time sharing across multiple<br />
agencies, counties and regional partners. The Bay Area Urban Area Security Initiative<br />
is tasked with helping 10 counties in the region to prepare for all hazards, natural<br />
or man-made, through a collaborative approach. The ability for multiple cities and<br />
counties to work together provides a significant advantage in the development <strong>of</strong> these<br />
communication networks leveraging infrastructure, knowledge and funding sources as<br />
a region.<br />
There are four major components to this interoperability effort:<br />
n Radio/voice communications<br />
n Information sharing<br />
n Broadband technology<br />
safety and noise — police, fiRe and emeRGency seRvices Chapter 6<br />
n Digital microwave connectivity through the 10 bay area counties<br />
6–27
<strong>City</strong> <strong>of</strong> Sunnyvale GeneRal plan – July <strong>2011</strong><br />
noise is defined as<br />
unwanted sound.<br />
ambient noise — a relatively<br />
steady background noise<br />
which is an accumulation <strong>of</strong><br />
different noise sources near<br />
and far. Most ambient noise<br />
in Sunnyvale is related to<br />
transportation. other ambient<br />
noise sources include wind<br />
and chirping birds.<br />
single-event noise —<br />
an unusual, occasional or<br />
temporary noise. examples<br />
include barking dogs,<br />
construction work, deliveries<br />
and organized athletic,<br />
musical or other group events.<br />
land use operational noise —<br />
a continuous or frequent noise<br />
related to the basic use <strong>of</strong><br />
property. examples include<br />
air conditioners, pool pumps,<br />
restaurant loudspeakers and<br />
industrial machinery.<br />
6–28<br />
Future challenges include upgrading <strong>of</strong> the Public Safety Department’s CAD (Computer<br />
Assisted Dispatch) system and trends towards Public Safety Answer Point/Dispatch<br />
consolidation. Additionally, it is anticipated that an aging population will continue<br />
to increase demands upon the Dispatch Center for response to medical emergencies.<br />
Lastly, costly maintenance and upgrading <strong>of</strong> critical infrastructure will need to remain<br />
a priority to ensure that the highly trained dispatchers and first responders have all<br />
<strong>of</strong> the tools necessary to receive and respond to calls for service at all times including<br />
during critical events, disasters and acts <strong>of</strong> terrorism.<br />
policy sn-7.1 PRovide eMeRgenCY CoMMuniCATionS SeRviCeS<br />
24 houRS A dAY 100 PeRCenT oF The TiMe. (Previously Support Services<br />
Policy 4.3D.1)<br />
noiSe<br />
Noise is a significant and inherent part <strong>of</strong> Sunnyvale’s environment. The noise environment<br />
is a result <strong>of</strong> historical land use decisions, competing regional and community goals,<br />
geographic factors and limited local controls. The <strong>City</strong>’s residents and businesses must<br />
tolerate some noise, as noise is a part <strong>of</strong> any urban environment. Excessive noise, however,<br />
can cause physical and mental health problems. A legitimate public concern is therefore,<br />
to protect residents from excessive noise.<br />
The discussion <strong>of</strong> noise is divided into two categories: transportation noise and<br />
community noise. Transportation noise generated by roadway, aircraft and train and<br />
light rail facilities is a major contributor to ambient noise in Sunnyvale. Community<br />
noise consists <strong>of</strong> everything other than transportation-related noise and includes<br />
single-event and land use operational noise.<br />
A sound level meter is used to take an instantaneous decibel reading. The resultant<br />
reading is the sound level (dBA) for an instant in time. Noise is measured and regulated<br />
in two different ways. For land use operational noise, instantaneous readings are<br />
measured. For ambient or transportation related noise (except for single-event train<br />
horns), an average noise (Ldn) is used (the average sound Level for Day and Night). An<br />
Ldn measurement (day/night average sound level) is a weighted average sound level in<br />
decibels during a 24-hour period.<br />
For the purposes <strong>of</strong> enforcement, all noise measurements are taken at applicable<br />
property lines <strong>of</strong> the property generating the noise. Single-event or land use operational<br />
noise is measured through instantaneous sound levels. Land use compatibility sound<br />
levels are measured with the Ldn measurement. These measurements are used to enforce<br />
Sunnyvale noise regulations.
figure 6-3: Decibel Levels <strong>of</strong> Common Sounds<br />
Noise Source<br />
(distance between source and listener)<br />
Sound Level<br />
(dBA)<br />
Civil defense Siren (100’) 130<br />
Subjective<br />
Impression<br />
Jet Take<strong>of</strong>f (200’) 120 Threshold <strong>of</strong> Pain<br />
Rock Music Concert 110<br />
bus (15’), Ambulance Siren (100’) 100 very loud<br />
boiler Room Printing Press Plant 90<br />
garbage disposal (3’), Freeway (100’) 80<br />
Freight Cars (100’) 70 Moderately loud<br />
vacuum Cleaner (10’) , department Store Speech (1’) 60<br />
light Traffic (100’) business <strong>of</strong>fice 50<br />
Typical home interior Typical home exterior (nighttime) 40 Quiet<br />
Quiet bedroom S<strong>of</strong>t whisper 30<br />
Mosquito (5’) 10 Threshold <strong>of</strong> hearing<br />
Source: Illingworth and Rodkin, Inc. /Acoustics – Air Quality, 1997<br />
Transportation facilities are Sunnyvale’s main source <strong>of</strong> noise and the most difficult to<br />
control. Roadways are the major source <strong>of</strong> transportation noise, followed by M<strong>of</strong>fett<br />
Federal Airfield, the Caltrain corridor and San Jose International Airport. See the 2010<br />
Noise Contour Map in Figure 6-4.<br />
The Noise Condition map shows projected noise contours for the year 2010 for major<br />
roadway and railroad noise sources in Sunnyvale. These noise contours represent an<br />
average noise level over a 24 hour period. This map can help determine if future land<br />
uses are compatible with their noise environments. If the use would be exposed to<br />
excessive noise, the <strong>City</strong> could require a detailed noise study that shows existing and<br />
future noise levels along with methods to achieve acceptable noise levels.<br />
safety and noise — noise Chapter 6<br />
20<br />
Measuring noise: Sounds<br />
are measured in decibels<br />
(dB). the decibel scale<br />
is logarithmic with the<br />
following characteristics:<br />
a change <strong>of</strong> one dB cannot<br />
generally be heard<br />
a change <strong>of</strong> three dB is a<br />
just noticeable difference<br />
a change <strong>of</strong> five dB is<br />
distinct<br />
a change <strong>of</strong> 10 dB is heard<br />
as a doubling <strong>of</strong> noise<br />
(e.g. 70dB is twice as loud<br />
as 60 dB)<br />
Combining two noises <strong>of</strong><br />
the same decibel level<br />
will add three dBa to the<br />
resulting noise<br />
(e.g. two noises at 60 dBa<br />
add up to 63 dBa, not<br />
120 dBa)<br />
See appendix H for the<br />
technical report describing<br />
the methodology and data<br />
used to develop the 2010<br />
noise Condition Map (figure<br />
6-4) and the 1997 noise<br />
exposure Map (figure 6-7).<br />
6–29
<strong>City</strong> <strong>of</strong> Sunnyvale GeneRal plan – July <strong>2011</strong><br />
6–30<br />
Goal Sn-8<br />
CoMpatiBle noiSe environMent<br />
MAinTAin oR AChieve A CoMPATible noiSe enviRonMenT FoR All lAnd uSeS in<br />
The CoMMuniTY. (Previously Noise Goal 3.6A/Adopted In 1997)<br />
What level <strong>of</strong> noise are people expected to tolerate in a residential, commercial or<br />
industrial development? Residential uses are the most sensitive. Industrial uses are the<br />
most tolerant. Tolerance also depends on how loud the noise is, when and where it<br />
happens, the duration, frequency and tone <strong>of</strong> the noise and the sensitivity <strong>of</strong> the person<br />
who hears the noise. People are generally most tolerant <strong>of</strong> existing ambient noise. They<br />
are least tolerant <strong>of</strong> single event noise, operational noise and increases in ambient noise.<br />
Interior Noise Standards<br />
The California Code <strong>of</strong> Regulations protects interiors <strong>of</strong> new multifamily dwellings<br />
and lodging uses from excessive noise. These requirements apply to hotels, motels,<br />
townhomes, condominiums, apartments, group care homes and all other dwellings<br />
except single-family detached homes. Interior noise levels cannot exceed an Ldn <strong>of</strong> 45<br />
dBA with doors and windows closed and a residential site with an exterior Ldn above<br />
60 dBA needs a detailed noise study and mitigation plan. The study must show how the<br />
dwelling will meet an interior Ldn <strong>of</strong> 45 dBA. These requirements are enforced through<br />
development review and the building permit process.<br />
policy sn-8.1 enFoRCe And SuPPleMenT STATe lAwS RegARding<br />
inTeRioR noiSe levelS oF ReSidenTiAl uniTS. (Previously Noise Policy 3.6A.2)<br />
policy sH-8.2 APPlY TiTle 24 noiSe inSulATion ReQuiReMenTS To All<br />
new Single-FAMilY deTAChed hoMeS. (Previously Noise Action Statement<br />
3.6A.2b)<br />
policy sn-8.3 ATTeMPT To AChieve A MAxiMuM inSTAnTAneouS<br />
noiSe level oF 50 dbA in bedRooMS And 55 dbA in oTheR AReAS oF<br />
ReSidenTiAl uniTS exPoSed To TRAin oR AiRCRAFT noiSe, wheRe The<br />
exTeRioR ldn exCeedS 55 dbA. (Previously Noise Action Statement 3.6A.2c)
EFIELD<br />
GRANT<br />
CENTRAL<br />
2010 Noise Conditions<br />
Projected Noise Levels<br />
CA-85<br />
>= 75 Ldn<br />
70-74 Ldn<br />
65-69 Ldn<br />
60-64 Ldn<br />
<strong>City</strong> <strong>of</strong> Sunnyvale GeneRal plan – July <strong>2011</strong><br />
6–32<br />
Exterior Noise Standards<br />
In 1976, the State <strong>of</strong> California published guidelines for noise compatible land use<br />
planning. Generally, exterior noise exposures fall into three categories: normally<br />
acceptable, conditionally acceptable and unacceptable. Each land use has a particular<br />
dBA range within each exterior noise exposure category. The following table summarizes<br />
these guidelines.<br />
figure 6-5: State <strong>of</strong> California Noise Guidelines for Land Use Planning<br />
Summary <strong>of</strong> Land Use Compatibility for Community Noise Environment<br />
Land Use Category<br />
Residential, Hotels and Motels<br />
Outdoor Sports and recreation,<br />
neighborhood Parks and Playgrounds<br />
Schools, Libraries, Museums, Hospitals,<br />
Personal Care, Meeting Halls, Churches<br />
Office Buildings, Commercial and<br />
Pr<strong>of</strong>essional Businesses<br />
Auditoriums, Concert Halls,<br />
Amphitheaters<br />
Industrial, Manufacturing, Utilities<br />
and Agriculture<br />
Exterior Noise Exposure LDN or CNEL, DBA<br />
55 60 65 70 75 80<br />
Normally Acceptable — Specified Land Use is satisfactory, based on the assumption<br />
that any buildings involved are <strong>of</strong> normal conventional construction, without any<br />
special insulation requirements.<br />
Conditionally Acceptable — Specified land use may be permitted only after detailed<br />
analysis <strong>of</strong> the noise reduction requirements and needed noise insulation features are<br />
included in the design.<br />
Unacceptable — New construction or development should generally not be<br />
undertaken because mitigation is usually not feasible to comply with noise element<br />
policies.<br />
Source: Illingworth and Rodkin, Inc. / Acoustics – Air Quality, 1997<br />
The state Noise Guidelines indicate that all residential land uses with exterior noise<br />
levels <strong>of</strong> 60-75 dBA Ldn are “conditionally acceptable.” The <strong>City</strong> has applied this limit<br />
in plans and projects with conditions <strong>of</strong> approval that attempt to achieve a 60 dBA Ldn<br />
for backyards, large balconies and common recreation areas. These areas have a high<br />
use rate and deserve a fairly quiet setting.
Achieving an outdoor Ldn <strong>of</strong> 60 dBA if the noise source is a railroad is generally more<br />
difficult. Train noise is usually made up <strong>of</strong> relatively few loud events. Although the<br />
outdoor Ldn may be high, the noise level between events is typically acceptable for<br />
speech. An Ldn limit <strong>of</strong> 70 dBA is more appropriate for areas affected by train noise.<br />
If the noise source is aircraft, the overhead noise is impractical to mitigate for outdoor<br />
residential areas. Preventing residential uses within areas <strong>of</strong> high Ldn from aircraft is a<br />
way <strong>of</strong> avoiding noise exposure <strong>of</strong> homes from aircraft. However, only industrial areas<br />
in the very northeast section <strong>of</strong> the <strong>City</strong> fall within a noise contour for the San Jose<br />
International Airport.<br />
Historically, the <strong>City</strong>’s demand for housing has been great. Due to the lack <strong>of</strong> alternative<br />
locations, most new residential projects are being developed near major roadways. These<br />
environments are noisy, but they must comply with Title 24 (State <strong>of</strong> California Noise<br />
Insulation Requirements) and are recommended to comply with state Noise Guidelines<br />
for Land Use Planning (see Figure 6-5).<br />
In addition to reviewing proposed development for compliance with noise standards,<br />
all proposed development must be reviewed to see if it results in a “significant noise<br />
impact” on existing development. To determine if a proposed noise increase is considered<br />
“significant” under CEQA, the following standards should be used.<br />
figure 6-6: Significant Noise Impacts from New Development<br />
on Existing Land Use<br />
Ldn Category <strong>of</strong> Existing Development<br />
Per figure 6-4<br />
normally Acceptable<br />
Noise Increase Considered “Significant”<br />
over Existing Noise Levels<br />
An increase <strong>of</strong> more than 3 dbA and the total ldn<br />
exceeds the “normally acceptable” category<br />
normally Acceptable An increase <strong>of</strong> more than 5 dbA<br />
Conditionally Acceptable An increase <strong>of</strong> more than 3 dbA<br />
unacceptable An increase <strong>of</strong> more than 3 dbA<br />
policy sn-8.4 PRevenT SigniFiCAnT noiSe iMPACTS FRoM new<br />
develoPMenT bY APPlYing STATe noiSe guidelineS And SunnYvAle<br />
MuniCiPAl Code noiSe RegulATionS in The evAluATion oF lAnd uSe<br />
iSSueS And PRoPoSAlS. (Previously Noise Policy 3.6A.1)<br />
safety and noise — noise Chapter 6<br />
See San Jose international<br />
airport’s website at<br />
www.sjc.org for noise<br />
contour maps.<br />
6–33
<strong>City</strong> <strong>of</strong> Sunnyvale GeneRal plan – July <strong>2011</strong><br />
6–34<br />
policy sn-8.5 CoMPlY wiTh “STATe oF CAliFoRniA noiSe guidelineS<br />
FoR lAnd uSe PlAnning” (FiguRe 6-5) FoR The CoMPATibiliTY oF<br />
lAnd uSeS wiTh TheiR noiSe enviRonMenTS, exCePT wheRe The CiTY<br />
deTeRMineS ThAT TheRe ARe PRevAiling CiRCuMSTAnCeS oF A uniQue<br />
oR SPeCiAl nATuRe. (Previously Noise Action 3.6A.1c)<br />
policy sn-8.6 uSe FiguRe 6-6, “SigniFiCAnT noiSe iMPACTS FRoM new<br />
develoPMenT on exiSTing lAnd uSe” To deTeRMine iF PRoPoSed<br />
develoPMenT ReSulTS in A “SigniFiCAnT noiSe iMPACT” on exiSTing<br />
develoPMenT. (Previously Noise Action Statement 3.6A.1d)<br />
policy sn-8.7 SuPPleMenT FiguRe 6-5, “STATe oF CAliFoRniA noiSe<br />
guidelineS FoR lAnd uSe PlAnning” FoR ReSidenTiAl uSeS bY<br />
ATTeMPTing To AChieve An ouTdooR ldn oF no gReATeR ThAn 60 dbA<br />
FoR CoMMon ReCReATionAl AReAS, bACkYARdS, PATioS And MediuM<br />
And lARge-Size bAlConieS. TheSe guidelineS Should noT APPlY wheRe<br />
The noiSe SouRCe iS RAilRoAd oR An AiRPoRT. iF The noiSe SouRCe<br />
iS A RAilRoAd, Then An ldn oF no gReATeR ThAn 70 dbA Should<br />
be AChieved in CoMMon AReAS, bACkYARdS, PATioS And MediuM<br />
And lARge bAlConieS. iF The noiSe SouRCe iS FRoM AiRCRAFT, Then<br />
PRevenTing new ReSidenTiAl uSeS wiThin AReAS oF high ldn FRoM<br />
AiRCRAFT noiSe iS ReCoMMended. (Previously Noise Action Statement 3.6A.1f)<br />
policy sn-8.8 Avoid ConSTRuCTion oF new ReSidenTiAl uSeS wheRe<br />
The ouTdooR ldn iS gReATeR ThAn 70 dbA AS A ReSulT FRoM TRAin<br />
noiSe. (Previously Noise Action Statement 3.6B.6c)
Techniques to Insulate People from Noise<br />
Sound walls — Sound walls can be an effective method <strong>of</strong> reducing ambient noise on<br />
properties. Typically sound walls are used to buffer residential or other sensitive uses<br />
from transportation noise or incompatible land use operational noise. Typical sound<br />
walls (six to eight feet high) will reduce noise levels by about six to eight dBA. Sound<br />
walls are most effective at reducing noise on properties nearest the sound wall. However,<br />
sound walls can be unattractive, isolate neighborhoods and give the community a<br />
“walled-in” appearance. These effects can be minimized by landscaping and earth<br />
berms and by requiring walls that are more decorative than the standard choices.<br />
Setbacks — Building setbacks can reduce noise if the distance is substantial. For<br />
example, a building located 50 ft. from the center <strong>of</strong> the road may have an Ldn <strong>of</strong> 64<br />
dBA at the building façade closer to the roadway. If the building is set back 100 ft.<br />
from the center <strong>of</strong> the roadway (an additional 50 feet), the Ldn would be reduced to<br />
approximately 60 dBA, which meets the state guidelines.<br />
Site Planning — Good site planning can buffer sensitive areas (such as bedrooms) with<br />
less sensitive areas (such as a parking structure). Conventional home building practices<br />
will reduce interior noise levels by about 15 dBA, even with the windows partially open.<br />
Other measures include double or triple pane windows, airtight doors and windows and<br />
vents oriented away from the house.<br />
policy sn-8.9 ConSideR TeChniQueS whiCh bloCk The PATh oF noiSe<br />
And inSulATe PeoPle FRoM noiSe. (Previously Noise Policy 3.6A.3)<br />
n SN-8.9a Use a combination <strong>of</strong> barriers, setbacks, site planning and building design<br />
techniques to reduce noise impacts, keeping in mind their benefits and shortcomings.<br />
(Previously Noise Action Statement 3.6A.3a)<br />
n SN-8.9b Consider compiling and distributing information to residents <strong>of</strong> noiseimpacted<br />
areas about what they can do to protect themselves from noise. (Previously<br />
Noise Action Statement 3.6A.3b)<br />
n SN-8.9c Proposed sound walls or other noise reduction barriers should be reviewed<br />
for design, location and material before installing the barrier. Sound readings should<br />
be taken before and after installing the noise reduction barrier in order to determine<br />
the efficacy <strong>of</strong> the noise reduction barrier. Measurement techniques shall be similar<br />
to procedures used by Caltrans to measure efficiency <strong>of</strong> sound walls. (Previously<br />
Noise Action Statement 3.6A.3c)<br />
safety and noise — noise Chapter 6<br />
typical sound walls (six to<br />
eight feet high) will reduce<br />
noise levels by about six to<br />
eight dBa.<br />
See interior noise discussion<br />
for more information on<br />
interior sound levels.<br />
landscaping provides little<br />
reduction in noise levels.<br />
100 feet <strong>of</strong> dense foliage<br />
only achieves approximately<br />
three to five dBa noise<br />
reduction.<br />
6–35
<strong>City</strong> <strong>of</strong> Sunnyvale GeneRal plan – July <strong>2011</strong><br />
6–36<br />
Goal Sn-9<br />
aCCeptaBle liMitS for CoMMunity noiSe<br />
MAinTAin oR AChieve ACCePTAble liMiTS FoR The levelS oF noiSe geneRATed<br />
bY lAnd uSe oPeRATionS And Single-evenTS (Previously Noise Goal 3.6C /<br />
Adopted in 1997)<br />
Noise provisions in the Sunnyvale Municipal Code regulate operational noises and<br />
selected single-event noises (see the list <strong>of</strong> Implementation Plans in Appendix A). These<br />
noise regulations address complaints and concerns regarding the hours <strong>of</strong> operation<br />
and noise levels produced by certain activities and powered equipment. While the<br />
Municipal Code noise provisions address the majority <strong>of</strong> noise complaints, noise<br />
complaints in special circumstances (e.g. unusual schedules or sensitivities to certain<br />
noises) are not accommodated. In some instances, complaints about noise are difficult<br />
to resolve despite the intent and guidelines <strong>of</strong> the noise regulations.<br />
Noise complaints that cannot be resolved through the application <strong>of</strong> code regulations<br />
are primarily due to conditions existing prior to the adoption <strong>of</strong> the 1995 noise code<br />
revisions, conditions that are not appropriate to regulate (children at child care centers) or<br />
conditions that are beyond the <strong>City</strong>’s sphere <strong>of</strong> influence (transportation noise). Despite<br />
these instances, the Sunnyvale Municipal Code addresses most community noise issues<br />
and the majority <strong>of</strong> complaints are resolved in compliance with Sunnyvale regulations.<br />
policy sn-9.1 RegulATe lAnd uSe oPeRATion noiSe. (Previously Noise<br />
Policy 3.6C.1)<br />
policy sn-9.2 RegulATe SeleCT Single-evenT noiSeS And<br />
PeRiodiCAllY MoniToR The eFFeCTiveneSS oF The RegulATionS.<br />
(Previously Noise Policy 3.6C.2)<br />
policy sn-9.3 APPlY CondiTionS To diSCReTionARY lAnd uSe PeRMiTS<br />
whiCh liMiT houRS oF oPeRATion, houRS oF deliveRY And oTheR<br />
FACToRS whiCh AFFeCT noiSe. (Previously Noise Action Statement 3.6C.1b)
Goal Sn-10<br />
Maintained or reduCed tranSportation noiSe<br />
PReSeRve And enhAnCe The QuAliTY oF neighboRhoodS bY MAinTAining<br />
oR ReduCing The levelS oF noiSe geneRATed bY TRAnSPoRTATion FACiliTieS<br />
(Previously Noise Goal 3.6B / Adopted in 1997)<br />
Major Roadways<br />
Major roadways cause most <strong>of</strong> the transportation noise in Sunnyvale. Sunnyvale has an<br />
interstate, three highways, two expressways and numerous arterial and collector streets<br />
within or near its borders. Virtually all existing homes next to freeways and expressways<br />
are protected by sound walls or depressed grades. Traffic noise is generally not an issue<br />
for commercial, <strong>of</strong>fice and industrial uses.<br />
The 1997 Noise Exposure Map, Figure 6-7, shows 1997 noise levels measured 50 ft. from<br />
the edge <strong>of</strong> each major roadway. All major roadways in Sunnyvale have an Ldn <strong>of</strong> at least<br />
60 dBA. Noise levels that range from 60 to 75 dBA Ldn are defined as “conditionally<br />
acceptable” for residential uses (see Figure 6-4, State Noise Guidelines for Land Use<br />
Planning). The Noise Exposure Map can be used to identify areas where existing and<br />
proposed uses are impacted by excessive noise.<br />
In 1986, before sound walls were installed, 40 percent <strong>of</strong> single-family homes were<br />
exposed to “conditionally acceptable” noise levels and one percent <strong>of</strong> single-family<br />
homes were exposed to “unacceptable” noise levels (over 75 dBA Ldn). It was projected<br />
that in the year 2010, these percentages would decrease to 20 percent <strong>of</strong> single-family<br />
homes exposed to “conditionally acceptable” noise and less than 0.1 percent exposed to<br />
“unacceptable” noise levels.<br />
Based on roadway traffic projections, noise levels throughout Sunnyvale are not<br />
predicted to change significantly due to increases in roadway traffic. Generally, a three<br />
dBA Ldn or greater change in noise level is considered “significant” because it can be<br />
noticed by the human ear. Most homes will continue to have acceptable noise levels<br />
in the future. For individual roadway projects, potential noise impacts are evaluated<br />
on a case-by-case basis. Despite the traffic noise, noise levels are considered “normally<br />
acceptable” for most homes today and most homes will continue to have normally<br />
acceptable noise levels in the future. Non-residential uses will generally be unaffected<br />
by current and future traffic noise.<br />
safety and noise — noise Chapter 6<br />
refer to figure 6-5, State<br />
<strong>of</strong> California Guidelines for<br />
land use planning for a list<br />
acceptable, conditionally<br />
acceptable and unacceptable<br />
noise standards for various<br />
land uses.<br />
Generally, a three dBa ldn or<br />
greater change in noise level<br />
is considered “significant”<br />
because it can be noticed by<br />
the human ear.<br />
6–37
<strong>City</strong> <strong>of</strong> Sunnyvale GeneRal plan – July <strong>2011</strong><br />
6–38<br />
policy sn-10.1 ReFRAin FRoM inCReASing oR ReduCe The noiSe<br />
iMPACTS oF MAJoR RoAdwAYS. (Previously Noise Policy 3.6B.1)<br />
n SN-10.1a Identify and mitigate roadway noise impacts as part <strong>of</strong> local land use plans<br />
and proposals. (Previously Noise Action Statement 3.6B.1a)<br />
n SN-10.1b Regulate the location, design and capacity <strong>of</strong> local roadway improvement<br />
projects to mitigate their noise impacts. (Previously Noise Action Statement 3.6B.1b)<br />
n SN-10.1c Use local traffic management techniques to reduce or protect noise levels.<br />
(Previously Noise Action Statement 3.6B.1c)<br />
n SN-10.1d Support state legislation to reduce vehicle noise levels. (Previously Noise<br />
Action Statement 3.6B.1f)<br />
Airports and Aircraft-Related Noise<br />
M<strong>of</strong>fett federal Airfield<br />
M<strong>of</strong>fett Federal Airfield (M<strong>of</strong>fett Field) is now operated by the National Aeronautics<br />
and Space Administration (NASA). In 1995, approximately 24,000 annual aircraft flight<br />
operations (a take-<strong>of</strong>f and a landing are each considered to be one flight operation)<br />
occurred at M<strong>of</strong>fett Field. Other noise sources at M<strong>of</strong>fett Field include wind tunnel<br />
facilities and the Outdoor Aerodynamic Research Facility.<br />
In 1976, when the Navy operated M<strong>of</strong>fett Field, the U.S. Department <strong>of</strong> Defense prepared<br />
guidelines which identify suitable land uses in an area impacted by high noise and potential<br />
accidents. These guidelines are part <strong>of</strong> an Air Installation Compatible Use Zone (AICUZ)<br />
study. Noise contours were updated in 1982. The AICUZ Map displays federal guidelines<br />
for and uses near the Naval Air Station (NAS) at M<strong>of</strong>fett Field. Since the Navy no longer<br />
operates M<strong>of</strong>fett and the number and character <strong>of</strong> flights are different, the AICUZ study<br />
is considered an informational document.<br />
San Jose International Airport<br />
Residents in northeast Sunnyvale are affected by San Jose Airport flight patterns. By<br />
2010, they may hear twice as many aircraft as they did in 1995. However, noise levels<br />
will eventually stabilize and decrease as quieter aircraft become prevalent. Current and<br />
future noise levels are below state limits.<br />
helicopters<br />
There are no heliports located in Sunnyvale. As <strong>of</strong> 1996, Santa Clara County has only<br />
six heliports. One is open to the public at San Jose International Airport. The others<br />
are restricted to private use by companies, hospital/medical uses, executives and other<br />
individuals.
CENTRAL<br />
1997 Noise Exposure<br />
Recorded Average Noise Levels<br />
as Measured 50 ft. from Edge<br />
<strong>of</strong> Road and/or Railroad<br />
CA-85<br />
75-79 Ldn<br />
70-74 Ldn<br />
65-69 Ldn<br />
60-64 Ldn<br />
BERNARDO<br />
CA-237<br />
FREMONT<br />
MARY<br />
Community Development Department, 1997<br />
REM<strong>IN</strong>GTON<br />
HOLLENBECK<br />
STELL<strong>IN</strong>G<br />
CENTRAL EXPRESSWAY<br />
<strong>SUNNYVALE</strong> SARATOGA<br />
<strong>SUNNYVALE</strong><br />
MATHILDA<br />
OLD SAN FRANCISCO<br />
US-280<br />
CALIFORNIA<br />
MAUDE<br />
EL CAM<strong>IN</strong>O REAL<br />
FAIR OAKS<br />
GUADALUPE SLOUGH<br />
WOLFE<br />
JAVA<br />
FAIR OAKS<br />
safety and noise — noise Chapter 6<br />
EVELYN<br />
CARIBBEAN<br />
TASMAN<br />
REED<br />
HOMESTEAD<br />
LAWRENCE<br />
US-101<br />
ARQUES<br />
KIFER<br />
MONROE<br />
Major Streets<br />
Highway/Expressway<br />
ÅTrain Station<br />
! Light Rail Station<br />
Light Rail<br />
Railroad<br />
Creek<br />
0.5<br />
Channel<br />
Miles<br />
¸<br />
GREAT AMERICA<br />
BOWERS<br />
US-101<br />
figure 6-7: 1997<br />
Noise Exposure Map<br />
6–39
<strong>City</strong> <strong>of</strong> Sunnyvale GeneRal plan – July <strong>2011</strong><br />
the airport land-use<br />
Commission (aluC) was<br />
established to provide for<br />
appropriate development<br />
<strong>of</strong> areas surrounding public<br />
airports in Santa Clara County.<br />
it is intended to minimize the<br />
public’s exposure to excessive<br />
noise and safety hazards and<br />
to ensure that the approaches<br />
to airports are kept clear <strong>of</strong><br />
structures that could pose an<br />
aviation safety hazard.<br />
6–40<br />
The Airport Land Use Commission has developed noise standards for heliports affecting<br />
residential uses. Design and location criteria for any new private use heliports require<br />
permits from the ALUC and affected cities.<br />
In 1995, there were approximately 6,000 helicopter flight operations at M<strong>of</strong>fett Field.<br />
One <strong>of</strong> the take-<strong>of</strong>f and landing patterns crosses over Sunnyvale. It mainly crosses over<br />
industrial land uses but also some residential land uses.<br />
policy sn-10.2 SuPPoRT eFFoRTS To ReduCe oR MiTigATe AiRPoRT<br />
noiSe, inCluding noiSe iMPACTS oF MoFFeTT FedeRAl AiRField, SAn<br />
JoSe inTeRnATionAl AiRPoRT And heliCoPTeRS. (Previously Noise Policies<br />
3.6B.2, 3,6B.3, 3.6B.4 and 3.6B.5)<br />
n SN-10.2a Support the retention <strong>of</strong> the Airport Land Use Commission. (Previously<br />
Noise Action Statement 3.6B.2a)<br />
n SN-10.2b Support the right <strong>of</strong> private citizens to sue airports for noise impacts.<br />
(Previously Noise Action Statement 3.6B.2b)<br />
n SN-10.2c Encourage airport operation policies and procedures which reduce the<br />
level and frequency <strong>of</strong> noise as well as other policies and federal funding to alleviate<br />
the effects <strong>of</strong> aircraft noise. (Previously Noise Action Statement 3.6B.2c)<br />
n SN-10.2d Support federal legislation that requires military and federal aircraft to<br />
meet Stage 3 noise requirements similar to commercial aircraft. (Previously Noise<br />
Action Statement 3.6B.3i)<br />
n SN-10.2e Support state legislation to lower the noise levels <strong>of</strong> civilian aircraft and<br />
airports. (Previously Noise Action Statements 3.6B.4g and 3.6B.4h)<br />
policy sn-10.3 oPPoSe AnY eFFoRT And/oR exPendiTuRe oF PubliC<br />
FundS To PRoMoTe MoFFeTT FedeRAl AiRField FoR non-FedeRAl<br />
PuRPoSeS. (Previously Noise Action Statement 3.6B.3g)
Trains and Light Rail<br />
Central Sunnyvale has a Caltrain heavy-rail corridor running east-west. The rail is used<br />
by both commuter trains during the day and freight train operations. Unscheduled<br />
freight operations can happen at any time, but typically occur at night. Sunnyvale also<br />
has a light rail transit in the northern part <strong>of</strong> the <strong>City</strong> along Tasman and Java Drives.<br />
Nearby surrounding uses are mobile home parks, multifamily residential uses and<br />
industrial areas.<br />
Train Noise<br />
There are two main sources <strong>of</strong> train noise — engine noise and train horn noise. Train<br />
horns blow at the Mary Avenue and Sunnyvale Avenue at-grade rail crossings and the<br />
two local stations (Downtown Sunnyvale and Lawrence Station). In 1996, the areas<br />
affected by train noise had an Ldn <strong>of</strong> 71-73 dBA at 50 ft. from the tracks (see Figure 6-7,<br />
1997 Noise Exposure Map). Maximum noise events could reach 90 dBA (engines) and<br />
105 dBA (horns).<br />
These noise levels are acceptable for all but approximately 80 homes near the tracks<br />
which experience “conditionally acceptable” noise levels. Some <strong>of</strong> these homes are<br />
exposed to excessive outdoor noise (above 70 dBA Ldn) and probably excessive interior<br />
noise as well (above 45 dBA Ldn). These noise levels are generally acceptable for nonresidential<br />
uses.<br />
Freight train operations are not likely to expand. There are few major rail shippers left<br />
on the railroad line and heavy industry on the Peninsula and in San Francisco is in<br />
decline. Commuter passenger service is now the primary use <strong>of</strong> the railroad line.<br />
Commuter train operations are likely to continue and expand. Plans to increase service<br />
could increase the noise levels by a noticeable three dBA. Possible electrification <strong>of</strong> the<br />
route could reduce existing Ldn by as much as eight dBA. Because <strong>of</strong> the uncertainty<br />
<strong>of</strong> these plans these conditions are not noted on the Noise Condition map. Sunnyvale<br />
has no jurisdiction over the number or noise level <strong>of</strong> trains, but actions can be taken to<br />
monitor and mitigate future noise events.<br />
safety and noise — noise Chapter 6<br />
6–41
<strong>City</strong> <strong>of</strong> Sunnyvale GeneRal plan – July <strong>2011</strong><br />
6–42<br />
Sunnyvale’s transportation center located near Evelyn Avenue and Murphy Street is a prime example <strong>of</strong> how<br />
residents and businesses deal with ambient noise while residing in an urban environment.
Light Rail Noise<br />
Light rail noise is generally less than train noise. Noise and vibration studies completed<br />
as part <strong>of</strong> an Environmental Impact Report/Statement for the construction <strong>of</strong> the Light<br />
Rail Project indicated that barriers should be provided to guard against wheel squeal.<br />
No excessive noise impacts are expected for residents in these areas.<br />
policy sn-10.4 MiTigATe And Avoid The noiSe iMPACTS FRoM TRAinS<br />
And lighT RAil FACiliTieS. (Previously Noise Policies 3.6B.6 and 3.6B.7)<br />
n SN-10.4a Monitor plans and projects which would increase the number <strong>of</strong><br />
commuter or freight trains and evaluate their noise impacts and seek mitigation for<br />
any change that worsens local conditions. (Previously Noise Action Statement 3.6B.6a<br />
and 3.6B.6b)<br />
n SN-10.4b Educate owners <strong>of</strong> older homes on ways to reduce noise levels from trains.<br />
(Previously Noise Action Statement 3.6B.6d)<br />
n SN-10.4c Support legislation to reduce the noise level <strong>of</strong> trains. (Previously Noise<br />
Action Statement 3.6B.6e)<br />
n SN-10.4d Seek the cooperation <strong>of</strong> train engineers to avoid unnecessary and<br />
prolonged use <strong>of</strong> air horns except for safety purposes. (Previously Noise Action<br />
Statement 3.6B.6f)<br />
n SN-10.4e Monitor regional plans for light rail facilities in Sunnyvale to ensure<br />
that noise impacts are identified and mitigated. (Previously Noise Action Statement<br />
3.6B.7a)<br />
safety and noise — noise Chapter 6<br />
6–43
chapteR 7<br />
enviRonmental<br />
manaGement<br />
The Environmental Management chapter contains information on the<br />
following topics:<br />
n Water Supply — information on various sources <strong>of</strong> potable and<br />
nonpotable water, and policies to ensure adequate supplies, water<br />
conservation efforts and water quality.<br />
n Wastewater Collection and Treatment — information on the<br />
wastewater collection system and the Water Pollution Control Plant<br />
and policies for future treatment issues.<br />
n Urban Run<strong>of</strong>f — Information on sources <strong>of</strong> urban run<strong>of</strong>f and<br />
treatment methods, as well as policies to minimize quantity <strong>of</strong><br />
urban run<strong>of</strong>f and improve quality.<br />
n Air Quality — information on sources air pollution and policies<br />
for addressing this pollution through transportation and land use.<br />
n Solid Waste — information on collection, recycling programs<br />
and disposal and policies to reduce future waste and increase<br />
recycling efforts.
Water Supply<br />
Goal eM-1<br />
adeQuate Water SupplieS<br />
enviRonmental manaGement — wateR supply Chapter 7<br />
ACQuiRe And MAnAge wATeR SuPPlieS So ThAT exiSTing And FuTuRe<br />
ReASonAble deMAndS FoR wATeR, AS PRoJeCTed in The 20-YeAR FoReCAST,<br />
ARe ReliAblY MeT. (Previously Water Resources Goal A / Adopted in 2008)<br />
The <strong>City</strong> has several sources <strong>of</strong> potable water to meet expected water demand. These<br />
include local groundwater wells, imported supplies from the San Francisco Public<br />
Utilities Commission (SFPUC) and Santa Clara Valley Water District (SCVWD), plus<br />
interagency connections with other local water suppliers for emergencies. Temporary<br />
interruptions <strong>of</strong> water supply from one source can be readily <strong>of</strong>fset by increasing supply<br />
from the other available sources.<br />
In order to further manage supplies, the <strong>City</strong> uses recycled water for nonpotable use and<br />
water conservation efforts. Future challenges will include the possible expansion <strong>of</strong> the<br />
recycled water system and new capital projects to address the aging water infrastructure.<br />
During the last 10 years, on average, SFPUC and SCVWD have together supplied<br />
approximately 90 percent <strong>of</strong> the total potable water used in the <strong>City</strong>. Of the remaining<br />
10 percent, about six percent <strong>of</strong> the potable water demand has been supplied by seven<br />
<strong>City</strong>-owned and operated wells. To <strong>of</strong>fset potable water demand for landscape irrigation<br />
and other non-potable uses, the remaining four percent has been supplied by recycled<br />
water produced by the Sunnyvale Water Pollution Control Plant (WPCP).<br />
7–3
<strong>City</strong> <strong>of</strong> Sunnyvale GeneRal plan – July <strong>2011</strong><br />
figure 7-1:<br />
Water System<br />
facilities Map<br />
7–4<br />
MIDDLEFIELD<br />
GRANT<br />
Water System Facilities<br />
Connection Point to<br />
Water Supplier<br />
Water Tank<br />
Pressure Zones<br />
Zone I - Fluoridated (SFPUC)<br />
Zone II - Not Fluoridated (SCVWD)<br />
Zone III - Not Fluoridated (SCVWD)<br />
Zone II Future Expansion<br />
" " " "<br />
" " " "<br />
" " " " Blended Area<br />
" " " "<br />
Production Wells<br />
Q Active<br />
Q Standby<br />
Q Cal Water<br />
Interagency Connections<br />
GA Cal Water<br />
GA Cupertino<br />
GA Mountain View<br />
GA Santa Clara<br />
CA-85<br />
Department <strong>of</strong> Public Works, 2007<br />
BERNARDO<br />
CA-237<br />
FREMONT<br />
MARY<br />
REM<strong>IN</strong>GTON<br />
HOLLENBECK<br />
STELL<strong>IN</strong>G<br />
CENTRAL EXPRESSWAY<br />
<strong>SUNNYVALE</strong> SARATOGA<br />
<strong>SUNNYVALE</strong><br />
MATHILDA<br />
OLD SAN FRANCISCO<br />
US-280<br />
CALIFORNIA<br />
MAUDE<br />
EL CAM<strong>IN</strong>O REAL<br />
FAIR OAKS<br />
WOLFE<br />
JAVA<br />
FAIR OAKS<br />
EVELYN<br />
CARIBBEAN<br />
TASMAN<br />
REED<br />
HOMESTEAD<br />
LAWRENCE<br />
US-101<br />
ARQUES<br />
KIFER<br />
MONROE<br />
Major Streets<br />
Highway/Expressway<br />
Å Train Station<br />
! Light Rail Station<br />
Light Rail<br />
Railroad<br />
Creek<br />
Channel<br />
0.5<br />
Miles<br />
¸<br />
GREAT AMERICA<br />
BOWERS<br />
US-101
figure 7-2: historical Percentage <strong>of</strong> Annual Water Deliveries by Source<br />
Percent<br />
60%<br />
50%<br />
40%<br />
30%<br />
20%<br />
10%<br />
0%<br />
SCVWD<br />
SFPUC<br />
1997 1998<br />
Wells<br />
Source: Department <strong>of</strong> Public Works, 2007<br />
1999 2000 2001 2002<br />
Year<br />
San francisco Public Utilities Commission (SfPUC)<br />
Recycled<br />
2003 2004 2005 2006 2007<br />
SFPUC uses the Hetch-Hetchy Reservoir outside <strong>of</strong> Yosemite Valley as its primary water<br />
source. Maximum and minimum usages <strong>of</strong> water are stipulated in the <strong>City</strong>’s current<br />
individual contract with SFPUC. If the overall usage by all suburban retail customers<br />
exceeds the maximum available level, the maximum amount <strong>of</strong> water available to<br />
Sunnyvale would be reduced based on the master agreement that covers both the <strong>City</strong><br />
and other SFPUC wholesale customers. The <strong>City</strong> would then rely on one <strong>of</strong> its other<br />
water supply sources (Santa Clara Valley Water, <strong>City</strong> Wells, Recycled Water) to meet the<br />
demand.<br />
Under the current contract and barring catastrophic events, the SFPUC believes it can<br />
meet the demands <strong>of</strong> its retail and wholesale customers in years <strong>of</strong> average and aboveaverage<br />
precipitation.<br />
Santa Clara Valley Water District (SCVWD)<br />
enviRonmental manaGement — wateR supply Chapter 7<br />
The current contract calls for Sunnyvale to submit proposed water delivery schedules to<br />
SCVWD for three-year periods, indicating amounts <strong>of</strong> treated water desired by the <strong>City</strong><br />
during each <strong>of</strong> the three years. SCVWD can make reductions to the water requested by<br />
Sunnyvale consistent with its ability to deliver water to all its customers.<br />
To maintain water supply reliability and flexibility, SCVWD’s water supply is from a<br />
variety <strong>of</strong> sources including local groundwater, imported water, local surface water, and<br />
recycled water. The District has a program to optimize the use <strong>of</strong> groundwater and<br />
surface water and prevent groundwater overdraft and land subsidence.<br />
7–5
<strong>City</strong> <strong>of</strong> Sunnyvale GeneRal plan – July <strong>2011</strong><br />
subsidence: Subsidence is the<br />
motion <strong>of</strong> a surface (usually,<br />
the earth’s surface) as it<br />
shifts downward relative to a<br />
fixed point such as sea-level.<br />
the opposite <strong>of</strong> subsidence<br />
is uplift, which results in<br />
an increase in elevation.<br />
Subsidence can occur when<br />
too much groundwater is<br />
pumped out, causing the land<br />
above to sink.<br />
See Goal em-7 (effective<br />
Wastewater treatment)<br />
for discussion and policies<br />
relating to the Water<br />
pollution Control plant and its<br />
production <strong>of</strong> recycled water.<br />
7–6<br />
<strong>City</strong> Wells<br />
Sunnyvale has seven operating wells that are kept in full production capacity and one<br />
well maintained in stand-by mode for emergencies. The seven operating wells are used<br />
as a supplemental source to the imported SFPUC and SCVWD water supplies. Well<br />
water is an important component <strong>of</strong> the <strong>City</strong>’s water shortage contingency plan, as<br />
indicated in the Urban Water Management Plan (UWMP).<br />
SCVWD, charged with alleviating land surface subsidence and monitoring <strong>of</strong><br />
groundwater levels and withdrawal rates, has authority over the amount <strong>of</strong> water<br />
that can be extracted from local wells. The allowable withdrawal <strong>of</strong> groundwater by<br />
Sunnyvale depends on a number <strong>of</strong> factors, including withdrawals by other water<br />
agencies, quantity <strong>of</strong> water recharged and carryover storage from the previous year.<br />
Cal Water provides service from its own wells and facilities to about a dozen service area<br />
pockets in Sunnyvale many <strong>of</strong> which are connected with the <strong>City</strong>’s system.<br />
Recycled Water<br />
The Water Pollution Control Plant (WPCP) produces approximately 13 million gallons<br />
per day (mgd) <strong>of</strong> high-quality advanced secondary-treated wastewater. A portion <strong>of</strong><br />
this water is further treated to “disinfected tertiary” recycled water standards, and can<br />
be used for approved non-potable purposes, such as landscape irrigation, industrial<br />
cooling towers and construction. Recycled water is a reliable, drought-resistant, <strong>City</strong>controlled<br />
supply that helps conserve and augment the potable water supply (See Figure<br />
7-3, Existing Recycled Water Facilities).<br />
Recycled water is currently delivered to primarily irrigation customers. Most recycled<br />
water usage occurs between April and October, with usage demand peaking during the<br />
months <strong>of</strong> July and August.<br />
The WPCP can normally meet all recycled water demand, although seasonal changes in<br />
the WPCP’s oxidation ponds occasionally make it difficult to meet the more stringent<br />
water quality requirements for disinfected tertiary recycled water versus discharge to<br />
the Bay. Modest increases in demand can be accommodated by the existing production<br />
and delivery systems.<br />
future Water Supply Issues<br />
According to the annually-updated 20-year water forecast, the <strong>City</strong> has adequate supply<br />
commitments and facilities to reliably meet the projected water needs <strong>of</strong> its residents<br />
and businesses for the foreseeable future.<br />
Innovative demand-side influence programs can help balance future supply versus<br />
demand. Techniques such as water banking, water transfers, plumbing retr<strong>of</strong>its,<br />
landscaping with low-water using plants, rate structures encouraging conservation,<br />
and other more restrictive demand side management options could be put into effect if<br />
needed. These measures, together with increased use <strong>of</strong> recycled water for non-potable<br />
purposes, appear adequate to ensure sufficient water supply to meet the foreseeable<br />
needs <strong>of</strong> the future.
GRANT<br />
IELD<br />
CENTRAL<br />
Recycled Water Facilities<br />
CA-85<br />
West Valley<br />
Recycled Water Storage<br />
Existing Reclaimed Water Pipes<br />
Future Reclaimed Water Pipes<br />
Parcels with Recycled Water<br />
! Schools and Parks<br />
BERNARDO<br />
CA-237<br />
Cherry Chase<br />
Sunnyvale Middle<br />
De Anza<br />
Park<br />
Greenwood Park<br />
FREMONT<br />
San<br />
Antonio<br />
Park<br />
Cupertino Middle<br />
Department <strong>of</strong> Public Works, 2008<br />
MARY<br />
Vargas<br />
Cumberland<br />
REM<strong>IN</strong>GTON<br />
Serra Park<br />
Homestead High<br />
M<strong>of</strong>fet Golf<br />
Course<br />
Sunnyvale Golf Course<br />
Encinal Park<br />
Washington<br />
Park<br />
HOLLENBECK<br />
STELL<strong>IN</strong>G<br />
CENTRAL EXPRESSWAY<br />
Cannery<br />
Park<br />
<strong>City</strong> Hall<br />
Las<br />
Palmas<br />
Park<br />
Nimitz<br />
enviRonmental manaGement — wateR supply Chapter 7<br />
Fremont High<br />
Plaza<br />
Del<br />
Sol<br />
<strong>SUNNYVALE</strong> SARATOGA<br />
<strong>SUNNYVALE</strong><br />
MATHILDA<br />
OLD SAN FRANCISCO<br />
Stocklmeir<br />
Murphy<br />
Park<br />
CALIFORNIA<br />
MAUDE<br />
EL CAM<strong>IN</strong>O REAL<br />
Community Center<br />
Ortega Park<br />
US-280<br />
Bishop<br />
Ellis<br />
Orchard<br />
Gardens<br />
Park<br />
FAIR OAKS<br />
Braly Park<br />
and School<br />
Panama Park<br />
WOLFE<br />
Water Pollution Control Plant<br />
JAVA<br />
Columbia Park<br />
and Middle<br />
School<br />
Fair Oaks Park<br />
Victory<br />
Village<br />
Park<br />
FAIR OAKS<br />
Corp<br />
Yard<br />
EVELYN<br />
CARIBBEAN<br />
San Miguel<br />
El Camino/Wolfe<br />
Peterson Middle<br />
Raynor Park<br />
Ponderosa Park<br />
and School<br />
TASMAN<br />
REED<br />
HOMESTEAD<br />
Lakewood Park<br />
and School<br />
Laurelwood<br />
LAWRENCE<br />
Baylands Park<br />
Fairwood Park<br />
and School<br />
US-101<br />
ARQUES<br />
KIFER<br />
MONROE<br />
Major Streets<br />
Wilcox<br />
GREAT AMERICA<br />
BOWERS<br />
Highway/Expressway<br />
Å Train Station<br />
! Light Rail Station<br />
Light Rail<br />
Railroad<br />
Creek<br />
Channel<br />
0.5<br />
Miles<br />
¸<br />
US-101<br />
figure 7-3:<br />
Recycled Water<br />
System Map<br />
WALSH<br />
US HWY 280<br />
7–7<br />
SCOTT
<strong>City</strong> <strong>of</strong> Sunnyvale GeneRal plan – July <strong>2011</strong><br />
See Goal sn-1 (acceptable<br />
levels <strong>of</strong> risk for natural<br />
and Human-caused Hazards)<br />
for discussion and policies<br />
relating to earthquake<br />
hazards and mitigation.<br />
See Goal em-7 (effective<br />
Wastewater treatment)<br />
for policies relating to the<br />
production <strong>of</strong> recycled water.<br />
7–8<br />
The <strong>City</strong> will also continue to address the following:<br />
n Replacement and repair <strong>of</strong> <strong>City</strong> water supply infrastructure and <strong>City</strong> wells.<br />
n Coordination with SFPUC and SCVWD to ensure their infrastructure is repaired<br />
and maintained adequately.<br />
n Planning for the possibility <strong>of</strong> an earthquake and its effect on the levees and the<br />
water system.<br />
n Temporary loss <strong>of</strong> water supplies from SCVWD, which could be replaced in the short<br />
term by a combination <strong>of</strong> increased production from <strong>City</strong> wells and an increase in<br />
SFPUC supply.<br />
n Increased storage and system capacity for recycled water supply to facilitate significant<br />
increases in recycled water production. The WPCP’s Strategic Implementation Plan<br />
(SIP) will include an evaluation <strong>of</strong> recycled water production in the context <strong>of</strong> the<br />
overall future needs <strong>of</strong> the plant.<br />
policy em-1.1 MAnAge wATeR SuPPlY To MeeT deMAndS FoR PoTAble<br />
wATeR ThRough The eFFeCTive uSe oF wATeR SuPPlY AgReeMenTS.<br />
(Previously Water Resources Policy A.1.)<br />
n EM-1.1a Investigate possibilities to increase well water sources within the <strong>City</strong>.<br />
(Previously Water Resources Action Statement A.1c)<br />
policy em-1.2 MAxiMize ReCYCled wATeR uSe FoR All APPRoved<br />
PuRPoSeS boTh wiThin And in AReAS AdJACenT To The CiTY, wheRe<br />
FeASible. (Previously Water Resources Policy A.2.)<br />
n EM-1.2a Update the 2000 Recycled Water Master Plan to provide a current roadmap<br />
for potential expansions to the <strong>City</strong>’s recycled water system. (Previously Water<br />
Resources Action Statement A.2f)<br />
n EM-1.2b Pursue opportunities for external funding for existing and future recycled<br />
water projects by supporting the efforts <strong>of</strong> regional water quality and recycling<br />
organizations such as BARWRP as they seek and apply for funding for expansion<br />
and continued support <strong>of</strong> recycled water and water quality in the region. (Previously<br />
Water Resources Action Statement A.2h)
policy em-1.3 PRovide enough RedundAnCY in The wATeR SuPPlY<br />
SYSTeM So ThAT MiniMuM PoTAble wATeR deMAnd And FiRe<br />
SuPPReSSion ReQuiReMenTS CAn be MeT undeR boTh noRMAl And<br />
eMeRgenCY CiRCuMSTAnCeS. (Previously Water Resources Policy A.3)<br />
Goal eM-2<br />
Water ConServation<br />
PRoMoTe MoRe eFFiCienT uSe oF The CiTY’S wATeR ReSouRCeS To ReduCe The<br />
deMAndS PlACed on The CiTY’S wATeR SuPPlieS. (Previously Water Resources<br />
Goal B / Adopted in 2008)<br />
The <strong>City</strong> currently provides water in six broad categories: multi-family residential, singlefamily<br />
residential, institutional, landscape, commercial/industrial (incorporating all nonresidential<br />
accounts not classified as landscape) and users <strong>of</strong> recycled water (Figure 7-3).<br />
figure 7-4: Annual Water Consumption by Use Category<br />
Acre Feet<br />
10,000<br />
9,000<br />
8,000<br />
7,000<br />
6,000<br />
5,000<br />
4,000<br />
3,000<br />
2,000<br />
1,000<br />
0<br />
Institutional<br />
Residential<br />
1997 1998<br />
Source: Department <strong>of</strong> Public Works, 2007<br />
enviRonmental manaGement — wateR supply Chapter 7<br />
Apartments<br />
Landscape<br />
1999 2000 2001<br />
Year<br />
2002<br />
Commercial/Industrial<br />
Recycled Water<br />
2003 2004 2005 2006<br />
From 1987 to 1992, California experienced a prolonged drought, with severe water<br />
shortages and water rationing in Santa Clara County. Through the cooperative efforts<br />
<strong>of</strong> water retailers and their customers, Santa Clara County endured the drought with<br />
minimal economic and aesthetic impacts. Between 1984 and 1993, the <strong>City</strong> experienced<br />
a decrease in water consumption, primarily due to water conservation in the residential,<br />
commercial, and industrial sectors. Some <strong>of</strong> the demand management practices that<br />
were used to maximize the availability <strong>of</strong> water supply during the drought, such as<br />
7–9
<strong>City</strong> <strong>of</strong> Sunnyvale GeneRal plan – July <strong>2011</strong><br />
the Sunnyvale 2005<br />
urban Water Management<br />
plan is available at<br />
GeneralPlan.inSunnyvale.com<br />
See Goal em-1 (adequate<br />
Water supplies) and Goal<br />
eM-7 (effective Wastewater<br />
treatment) for more<br />
information about the <strong>City</strong>’s<br />
recycled water system.<br />
7–10<br />
inverted rates and water Best Management Practices, continue to this day. On-going<br />
water conservation efforts were able to reduce potable water consumption from 161<br />
gallons per capita per day in 2000 to 139 gallons per capita per day in 2006, a 13.6<br />
percent reduction for residential customers. Demand in the commercial/industrial<br />
sector remained flat with a slight decline in 2006.<br />
Water use varies depending on weather, seasonal climatic patterns, business conditions<br />
and the economy. Long-term trends in water requirements are valuable in projecting<br />
future supply needs. Figure 7-5 illustrates past, current and projected total water usage<br />
through 2030. Additional details on the current and planned water supplies to meet<br />
these demands are provided in the Sunnyvale Urban Water Management Plan.<br />
figure 7-5: historic and Projected Water Demand<br />
Water Usage (AF)<br />
30,000<br />
29,000<br />
28,000<br />
27,000<br />
26,000<br />
25,000<br />
24,000<br />
23,000<br />
22,000<br />
1993 1998 2003 2008 2013 2018 2028 2033<br />
Year<br />
Source: Department <strong>of</strong> Public Works, 2007<br />
The <strong>City</strong> uses a variety <strong>of</strong> demand management measures to assist in meeting this<br />
projected demand. Many <strong>of</strong> the Demand Management Measures (DMMs) <strong>of</strong>fered<br />
by Sunnyvale are actually programs run by or coordinated through Santa Clara<br />
Valley Water District (SCVWD). The programs have been either funded through the<br />
wholesale water rates paid by Sunnyvale, or directly reimbursed by the <strong>City</strong>. The DMMs<br />
implemented by the <strong>City</strong>, water usage restrictions during normal and drought years and<br />
other details can be found in the Urban Water Management Plan.<br />
Conservation measures include the following:<br />
n Inclining block tier rate structure that penalizes excessive water consumption<br />
n Conservation efforts consistent with industry Best Management Practices (BMPs)<br />
n Recycled water program to replace the use <strong>of</strong> potable water for non-potable uses<br />
where possible.
enviRonmental manaGement — wateR supply Chapter 7<br />
The <strong>City</strong> also has a drought response based on the Sunnyvale Water Conservation Plan.<br />
This plan, adopted in 1977 and updated in 1989, includes mandatory and voluntary water<br />
use restrictions associated with different levels <strong>of</strong> reduction, rate block adjustments for<br />
each level, and approaches for enforcement.<br />
The <strong>City</strong> will continue to plan and coordinate its water needs with regional and local<br />
wholesalers and retailers for best management <strong>of</strong> available water supplies. By 2030<br />
the <strong>City</strong> expects to save almost 800 acre feet <strong>of</strong> water per year through conservation<br />
measures.<br />
policy em-2.1 loweR oveRAll wATeR deMAnd ThRough The<br />
eFFeCTive uSe oF wATeR ConSeRvATion PRogRAMS in The ReSidenTiAl,<br />
CoMMeRCiAl, induSTRiAl And lAndSCAPing ARenAS. (Previously Water<br />
Resources Policy B.1)<br />
Goal eM-3<br />
reliaBle and Safe Water diStriBution<br />
PRoACTivelY MAinTAin The wATeR diSTRibuTion SYSTeM inFRASTRuCTuRe<br />
To enSuRe The ReliAble And SAFe deliveRY oF wATeR undeR noRMAl And<br />
eMeRgenCY CondiTionS To boTh CuRRenT And FuTuRe CuSToMeRS. (Previously<br />
Water Resources Goal C / Adopted in 2008)<br />
The <strong>City</strong> owns, operates, and maintains a water supply and distribution system that<br />
includes connections with <strong>City</strong> suppliers and neighboring water utilities. Although not<br />
obvious, ground elevations in Sunnyvale vary from sea level at the north end <strong>of</strong> the <strong>City</strong><br />
to 300 feet above sea level at the southwest corner. Because <strong>of</strong> this elevation difference,<br />
the water system is broken up into a series <strong>of</strong> three pressure zones (Figure 7-1, Water<br />
System Facilities).<br />
Within the <strong>City</strong>’s service area, some pocketed areas adjacent to Fremont Avenue and<br />
Sunnyvale-Saratoga Road receive water from Cal Water. These areas were formerly<br />
part <strong>of</strong> the county, but have been annexed by Sunnyvale. Cal Water produces water<br />
from its own wells, which meets all federal and state quality requirements. The <strong>City</strong> has<br />
provided six emergency connections to Cal Water service areas to improve fire flows<br />
and reliability, and all fire hydrants have been replaced to conform to <strong>City</strong> standards.<br />
Perhaps the largest water system issue for the <strong>City</strong> is the need for significant and on-going<br />
investment in improvements to the water system infrastructure. A significant portion <strong>of</strong><br />
the <strong>City</strong>’s investment in water system infrastructure is represented by the transmission<br />
and distribution pipelines. Approximately 80 percent <strong>of</strong> the 330 miles <strong>of</strong> transmission<br />
and distribution pipelines and related facilities were constructed in the 1960s and are<br />
additional information<br />
on water conservation<br />
measures and programs can<br />
be found in on the SCvWd<br />
website. the SfpuC also has<br />
corresponding plans for the<br />
<strong>City</strong> and County <strong>of</strong><br />
San francisco.<br />
one acre foot <strong>of</strong> water<br />
= 325,851 gallons. 800<br />
acre feet <strong>of</strong> water =<br />
approximately 260 million<br />
gallons <strong>of</strong> water.<br />
7–11
<strong>City</strong> <strong>of</strong> Sunnyvale GeneRal plan – July <strong>2011</strong><br />
the principal law governing<br />
drinking water safety in the<br />
united Stated is the Safe<br />
drinking Water act (SdWa).<br />
enacted in 1974, the SdWa<br />
requires the environmental<br />
protection agency (epa) to<br />
establish comprehensive<br />
national drinking water<br />
regulations and to set<br />
enforceable standards for<br />
health-related drinking water<br />
contaminants.<br />
7–12<br />
potentially approaching the end <strong>of</strong> their estimated 50 year service life. While actual<br />
service life varies depending on site specific factors, utility services provided today are<br />
“using up” infrastructure resources which must be replaced to serve future customers.<br />
policy em-3.1 MAinTAin A PRevenTive MAinTenAnCe PRogRAM ThAT<br />
PRovideS FoR ReliAbiliTY oF PoTAble And ReCYCled wATeR SYSTeMS.<br />
(Previously Water Resources Policy C.1)<br />
policy em-3.2 MAinTAin A PRoACTive long RAnge inFRASTRuCTuRe<br />
PlAn ThAT idenTiFieS SCheduleS And FundS And iMPleMenTS needed<br />
SYSTeM uPgRAdeS And RePlACeMenTS beFoRe FACiliTieS exCeed TheiR<br />
eFFeCTive uSeFul liveS. (Previously Water Resources Policy C.2)<br />
policy em-3.3 MAinTAin An uP-To-dATe eMeRgenCY wATeR<br />
oPeRATionS PlAn. (Previously Water Resources Policy C.3)<br />
Goal eM-4<br />
adeQuate Water Quality<br />
enSuRe ThAT All wATeR MeeTS STATe And FedeRAl STAndARdS FoR AeSTheTiCS,<br />
QuAliTY And heAlTh. (Previously Water Resources Goal D/ Adopted In 2008)<br />
Water delivered in the <strong>City</strong> originates from different sources and is therefore subject<br />
to different water quality conditions. Waters from different sources blend within the<br />
distribution system, depending on the daily demand, seasonal quality and relative<br />
quantity fluctuations, and temporary interruptions due to maintenance activities,<br />
resulting in water quality variances. In all cases the <strong>City</strong>’s water quality meets or exceeds<br />
all federal and state requirements.<br />
The <strong>City</strong> conducts an extensive water quality monitoring program in compliance with<br />
all applicable state and federal requirements. Over 2,000 samples are collected each<br />
year from the distribution system, imported sources, wells in operation, storage tanks,<br />
and/or household taps, depending on the constituent <strong>of</strong> interest. Samples are analyzed<br />
by either the <strong>City</strong>’s state-certified laboratory or an outside state-certified laboratory.<br />
The <strong>City</strong> has been in consistent compliance with the requirements <strong>of</strong> its water quality<br />
monitoring program since it was instituted in 1988.
enviRonmental manaGement — wateR supply Chapter 7<br />
The California Department <strong>of</strong> Public Health (CDPH) requires the <strong>City</strong> to distribute to<br />
all customers an Annual Water Quality Report. This report provides information on<br />
contaminants that may be present in the three source waters and in the distribution<br />
system. Testing has consistently shown that the water provided by the <strong>City</strong> meets<br />
established water quality standards.<br />
The SFPUC completed construction <strong>of</strong> its new, system-wide fluoridation facility in 2005.<br />
Beginning in November 2005, all water delivered from the SFPUC was fluoridated.<br />
SCVWD does not currently fluoridate its water, though it is currently studying the<br />
feasibility <strong>of</strong> doing so. The <strong>City</strong> does not fluoridate its well water. As a result, some areas<br />
<strong>of</strong> Sunnyvale receive fluoridated water (the northern part <strong>of</strong> the <strong>City</strong> approximately<br />
north <strong>of</strong> El Camino Real), other areas receive non-fluoridated water (southern portion),<br />
and some areas receive a mixture. <strong>City</strong> staff manages the water system to provide<br />
consistent concentrations <strong>of</strong> fluoride by keeping the SFPUC and SCVWD service areas<br />
separated as much a possible.<br />
The SDWA regulations have continued to evolve as more monitoring data have been<br />
collected by water systems, monitoring and detection capabilities have improved, and<br />
new constituents <strong>of</strong> concern have been identified. <strong>City</strong> staff continues to closely track<br />
new and proposed regulations and update monitoring and analyses accordingly.<br />
policy em-4.1 MAinTAin And uPdATe A CoMPRehenSive wATeR<br />
QuAliTY-MoniToRing PRogRAM ThAT MeeTS oR exCeedS All STATe<br />
And FedeRAl ReQuiReMenTS, while AlSo MeeTing SPeCiFiC CiTY And<br />
ReSidenTS’ needS. (Previously Water Resources Policy D.1)<br />
policy em-4.2 MAinTAin An AggReSSive inSPeCTion And PRevenTive<br />
MAinTenAnCe PRogRAM ThAT enSuReS ThAT bACkFlow FRoM<br />
PoTenTiAllY ConTAMinATed wATeR SeRviCeS iS PRevenTed. (Previously<br />
Water Resources Policy D.2)<br />
n EM-4.2a Investigate the potential for the <strong>City</strong> owning all backflow devices, thereby<br />
ensuring their proper function and maintenance. (Previously Water Resources Action<br />
Statement D.2d)<br />
policy em-4.3 PRovide APPRoPRiATe SeCuRiTY And PRoTeCTion oF<br />
wATeR FACiliTieS. (Previously Water Resources Policy D.3)<br />
7–13
<strong>City</strong> <strong>of</strong> Sunnyvale GeneRal plan – July <strong>2011</strong><br />
7–14<br />
policy em-4.4 MAinTAin And uPdATe An ACTion PlAn ThAT ReSPondS<br />
To And PRoTeCTS wATeR SuPPlieS FRoM ConTAMinATion. (Previously<br />
Water Resources Policy D.4)<br />
WaSteWater ColleCtion and treatMent<br />
Goal eM-5<br />
MiniMal pollution and Quantity <strong>of</strong> WaSteWater<br />
enSuRe ThAT The QuAnTiTY And CoMPoSiTion oF wASTewATeR geneRATed in<br />
The CiTY doeS noT exCeed The CAPAbiliTieS oF The wASTewATeR ColleCTion<br />
SYSTeM oR And The wATeR PolluTion ConTRol PlAnT. (Previously Wastewater<br />
Goal 3.3.A / Adopted in 2001)<br />
Goal eM-6<br />
effeCtive WaSteWater ColleCtion SySteM<br />
ConTinue To oPeRATe And MAinTAin The wASTewATeR ColleCTion SYSTeM<br />
So ThAT All SewAge And induSTRiAl wASTeS geneRATed wiThin The CiTY ARe<br />
ColleCTed And ConveYed undeR SAFe And SAniTARY CondiTionS To The wATeR<br />
PolluTion ConTRol PlAnT. (Previously Wastewater Goal 3.3B / Adopted in 2001)<br />
Goal eM-7<br />
effeCtive WaSteWater treatMent<br />
ConTinue To oPeRATe And MAinTAin The wATeR PolluTion ConTRol PlAnT,<br />
uSing CoST eFFeCTive MeThodS, So ThAT All SewAge And induSTRiAl<br />
wASTeS geneRATed wiThin The CiTY ReCeive SuFFiCienT TReATMenT To MeeT<br />
The eFFluenT diSChARge And ReCeiving wATeR STAndARdS oF RegulAToRY<br />
AgenCieS. (Previously Wastewater Goal 3.3C / Adopted in 2001)<br />
The wastewater from homes and businesses (toilet, shower, kitchen sink, etc.) is carried<br />
by sanitary sewer lines to the Sunnyvale Water Pollution Control Plant (WPCP), where<br />
it is treated before being discharged to local waterways which flow into the San Francisco<br />
Bay. The amount and quality <strong>of</strong> this effluent is regulated by the San Francisco Bay Water
enviRonmental manaGement — wateR collection system Chapter 7<br />
Quality Control Board. The Board’s purpose is to protect beneficial uses <strong>of</strong> the San<br />
Francisco Bay in compliance with the California Water Code and federal Clean Water Act.<br />
Water ColleCtion SySteM<br />
Sunnyvale’s wastewater collection system has the capacity to convey all sewage and<br />
industrial wastes generated when the <strong>City</strong> is fully developed in accordance with the land<br />
use projections (approximately 55.7 million gallons per day). Five major trunk networks<br />
terminate at the Water Pollution Control Plant (WPCP), referred to as the Lawrence,<br />
Borregas, Lockheed, M<strong>of</strong>fett and Cannery trunks. Figure 7-7 is a map showing drainage<br />
area boundaries for the areas served by the five collection networks. Capacities <strong>of</strong><br />
individual networks are:<br />
figure 7-6: Capacities <strong>of</strong> Individual Sewer Collection Areas<br />
Collection Area Capacity in Million Gallons per Day (MGD)<br />
lawrence 22.0<br />
borregas 17.0<br />
Cannery 5.5<br />
lockheed 4.9<br />
M<strong>of</strong>fett Field 6.3<br />
TOTAL 55.7<br />
Based on growth projections in 2001, it is not anticipated that flows will exceed the<br />
capacity <strong>of</strong> the overall collection system. Specific locations within the collection system<br />
may require additional capacity in the future.<br />
As sanitary sewers become older, gaps from cracks, joints, aging gaskets and leaking<br />
services tend to allow some groundwater or rainwater to enter the system. This<br />
process is called infiltration. A certain amount <strong>of</strong> rainwater may also find its way into<br />
the wastewater system as inflow. Inflow can result from direct connections <strong>of</strong> storm<br />
drains or downspouts to the wastewater system, either in the right-<strong>of</strong>-way or on private<br />
property. Components <strong>of</strong> the system itself, such as piping, manholes, pumps, etc., will<br />
also require replacement as they exhaust their life expectancy.<br />
Infiltration and inflow can interfere with the needed capacity <strong>of</strong> sanitary sewers and<br />
the WPCP. Though virtually impossible to eliminate altogether, maintenance crews use<br />
closed circuit video inspection to monitor for bad joints and/or broken pipes which allow<br />
infiltration. Private industry is also inspected for illegal storm drain cross-connections<br />
to ensure that the quantity <strong>of</strong> rainfall that flows to the WPCP is kept under control.<br />
If infiltration and inflow are allowed to continue unmitigated, additional wastewater<br />
flows could overwhelm treatment plant capacity and result in increased treatment costs.<br />
7–15
<strong>City</strong> <strong>of</strong> Sunnyvale GeneRal plan – July <strong>2011</strong><br />
See wpcp.insunnyvale.com<br />
for more information on the<br />
npdeS permit and related<br />
programs and regulations.<br />
potable water is fit for<br />
consumption by humans and<br />
other animals. non-potable<br />
water is all other water.<br />
See Goal em-1 (adequate<br />
Water supplies) for discussion,<br />
policies, and a map <strong>of</strong> the<br />
recycled water system.<br />
7–16<br />
<strong>City</strong> crews maintain the operation <strong>of</strong> the sewer main lines by regular flushing and<br />
performing repairs to the system. Areas <strong>of</strong> known-grease or dirt accumulation are<br />
flushed on an enhanced cleaning schedule. Depending upon the degree <strong>of</strong> build-up, the<br />
frequency may vary from several weeks to several months.<br />
Water pollution Control plant<br />
The WPCP provides treatment <strong>of</strong> wastewater from residential, commercial, and<br />
industrial sources from the <strong>City</strong> <strong>of</strong> Sunnyvale, the Rancho Rinconada portion <strong>of</strong><br />
Cupertino, and M<strong>of</strong>fett Federal Airfield. The WPCP is designed to treat an average <strong>of</strong><br />
29.5 million gallons <strong>of</strong> wastewater per day and a peak flow <strong>of</strong> 40 million gallons per day.<br />
From 2004 to 2007, the average dry weather effluent flow was 14.2 MGD, well within the<br />
plant capacity.<br />
The WPCP is designed to combine physical, chemical, and natural biological processes<br />
to treat wastewater This unique combination allows the WPCP to consistently produce<br />
a high-quality effluent from which more than 85 percent <strong>of</strong> the pollutants have been<br />
removed from the influent. This wastewater treatment process provides both secondary<br />
and advanced treatment to produces a high quality effluent, suitable for discharge into<br />
San Francisco Bay under a National Pollutant Discharge Elimination System (NPDES)<br />
permit and for recycling for irrigation and other uses.<br />
Wastewater is treated at three distinct levels: primary, secondary, and tertiary.<br />
n Primary Treatment — The first stage in the treatment process to remove solids.<br />
n Secondary Treatment — The second stage in the treatment process where oxygen is<br />
added to help remove remaining solids and bionutrients.<br />
n Tertiary Treatment — The third stage in the treatment process to remove ammonia,<br />
algae, and bacteria.<br />
Recycled water is tertiary treated wastewater diverted from discharge and treated for<br />
reuse in industrial processes, landscape irrigation, and other non-potable uses. It is used<br />
by businesses and the <strong>City</strong> <strong>of</strong> Sunnyvale for landscape and golf course irrigation, and<br />
decorative ponds. By reusing water in this way, valuable potable (drinking) water is<br />
conserved. The rest <strong>of</strong> the tertiary effluent is discharged into the Guadalupe Slough,<br />
which flows to the Bay.<br />
In <strong>2011</strong>, about 10 percent <strong>of</strong> the daily flow is diverted for reuse. The <strong>City</strong> <strong>of</strong> Sunnyvale<br />
water recycling program provides a sustainable and drought-resistant supply <strong>of</strong> water to<br />
portions <strong>of</strong> the <strong>City</strong> for non-potable uses.<br />
Wastewater Pre-Treatment Program<br />
The Pretreatment Program includes Industrial Waste Inspectors, Laboratory Chemists<br />
and Field Technicians, whose primary goal is the protection <strong>of</strong> the treatment plant<br />
and sanitary sewer collection system from industrial waste. By regulating the disposal<br />
<strong>of</strong> industrial wastewater into the sanitary sewer, the Pretreatment Program seeks to<br />
prevent the introduction <strong>of</strong> pollutants that could interfere with the operation <strong>of</strong> the
CENTRAL<br />
Sewer Collection Facilities<br />
CA-85<br />
#*<br />
enviRonmental manaGement — wateR pollution contRol plant Chapter 7<br />
Sewer Lift Station<br />
Main Sewer Trunk Line<br />
Sewer Collection Areas<br />
Borregas<br />
Cannery<br />
Lawrence 2<br />
Lawrence 1<br />
Lockheed<br />
M<strong>of</strong>fett<br />
BERNARDO<br />
CA-237<br />
FREMONT<br />
Department <strong>of</strong> Public Works, 2001<br />
LAWRENCE 2<br />
MARY<br />
REM<strong>IN</strong>GTON<br />
HOLLENBECK<br />
STELL<strong>IN</strong>G<br />
CENTRAL EXPRESSWAY<br />
BORREGAS<br />
MOFFETT<br />
CANNERY<br />
<strong>SUNNYVALE</strong> SARATOGA<br />
<strong>SUNNYVALE</strong><br />
MATHILDA<br />
LOCKHEED<br />
OLD SAN FRANCISCO<br />
US-280<br />
CALIFORNIA<br />
MAUDE<br />
EL CAM<strong>IN</strong>O REAL<br />
FAIR OAKS<br />
WOLFE<br />
JAVA<br />
FAIR OAKS<br />
EVELYN<br />
CARIBBEAN<br />
TASMAN<br />
LAWRENCE 1<br />
REED<br />
HOMESTEAD<br />
#*<br />
From Rancho<br />
Rinconada<br />
LAWRENCE<br />
#*<br />
US-101<br />
ARQUES<br />
KIFER<br />
MONROE<br />
#*<br />
Major Streets<br />
Highway/Expressway<br />
Å Train Station<br />
! Light Rail Station<br />
Light Rail<br />
Railroad<br />
Creek<br />
Channel<br />
0.5<br />
Miles<br />
¸<br />
GREAT AMERICA<br />
BOWERS<br />
US-101<br />
figure 7-7: Sewer<br />
Collection Area Maps<br />
7–17
<strong>City</strong> <strong>of</strong> Sunnyvale GeneRal plan – July <strong>2011</strong><br />
See wpcp.inSunnyvale.com for<br />
annual water quality reports<br />
and information.<br />
7–18<br />
Plant, cause damage to the sewer system, compromise public health or worker safety, or<br />
pass through the Plant to the Bay.<br />
Industrial and commercial facilities are regulated through discharge permits, Best<br />
Management Practices (BMPs), and routine inspection and monitoring. Discharge<br />
Permits contain specific requirements and limits for the concentration <strong>of</strong> pollutants in<br />
wastewater discharges. On average, the Pretreatment Program has 70 active industrial<br />
wastewater discharge permits issued to Significant Industrial Users (SIUs). Additionally,<br />
hundreds <strong>of</strong> commercial facilities are regulated through the application <strong>of</strong> BMPs tailored<br />
to specific activities commonly found in commercial businesses. When implemented,<br />
the BMPs reduce or eliminate the introduction <strong>of</strong> pollutants into the sanitary sewer.<br />
Regulatory Compliance Activities<br />
The WPCP operates under the requirements set for by the Global Warming Solutions<br />
Act <strong>of</strong> 2006, Assembly Bill 32 or AB 32. AB 32 is a California State Law that fights<br />
climate change by establishing a comprehensive program to reduce greenhouse gas<br />
emissions from all sources throughout the state. AB 32 requires the California Air<br />
Resources Board (CARB) to develop regulations and market mechanisms to reduce<br />
California’s greenhouse gas emissions to 1990 levels by 2020, representing a 25 percent<br />
reduction statewide, with mandatory caps beginning in 2012 for significant emissions<br />
sources. For the Plant, it sets in motion a series <strong>of</strong> mandatory reporting, and equipment<br />
maintenance requirements that are additional to the “normal” function <strong>of</strong> maintaining<br />
plant effluent compliance.<br />
future Water Pollution Control Plant Improvements<br />
Plant capacity appears sufficient based on use in 2001 and the updated projections. The<br />
Environmental Protection Agency requires that when flows reach 75 percent <strong>of</strong> design<br />
capacity, agencies begin to evaluate future needs and develop plans for expansion,<br />
if appropriate. Based on 2001 figures, it is not anticipated that this milestone will be<br />
reached in Sunnyvale and it will not be necessary to evaluate ways to provide additional<br />
capacity at the WPCP during the next five to ten years. Projections indicate that<br />
flows may not continue to increase significantly between 2001 and 2020. This overall<br />
projection is attributed to changes in land use, changes in water consumption patterns,<br />
and the overall reduced rate <strong>of</strong> growth.<br />
Portions <strong>of</strong> the WPCP were first constructed in 1954 and are now nearly 50 years old. In<br />
addition, the nature <strong>of</strong> wastewater treatment itself presents an adverse environment for<br />
facilities and equipment. In order to maintain this infrastructure and ensure the ongoing<br />
ability to meet effluent and recycled water quality requirements, it is necessary to have in<br />
place a strategy for the ongoing refurbishment and replacement <strong>of</strong> components <strong>of</strong> the plant.<br />
An asset condition assessment conducted in 2005 identified several critical plant<br />
structures as at-risk, and in need <strong>of</strong> rehabilitation soon. In 2007, a Capital Project<br />
Strategic Infrastructure Plan (SIP) was put in place to set future direction <strong>of</strong> plant<br />
process enhancements and physical improvements. Following completion <strong>of</strong> this effort,<br />
SIP implementation is expected to continue for ten to fifteen years for construction <strong>of</strong><br />
new and/or rehabilitated plant facilities.
enviRonmental manaGement — wateR pollution contRol plant Chapter 7<br />
Policies supporting Goal EM-5 (Minimal Pollution and Quantity <strong>of</strong> Wastewater):<br />
policy em-5.1 wATeR PolluTion ConTRol PlAnT iMPRoveMenTS<br />
Should be deSigned, ConSTRuCTed And MAinTAined And The<br />
QuAnTiTY oF induSTRiAl wASTeS Should be ConTRolled So ThAT The<br />
PlAnT doeS noT hAve To be exPAnded in exCeSS oF iTS CAPACiTY oF<br />
29.5 Mgd. (Previously Wastewater Policy 3.3A.1)<br />
policy em-5.2 enSuRe ThAT wASTeS diSChARged To The wASTewATeR<br />
ColleCTion SYSTeM CAn be TReATed bY exiSTing TReATMenT<br />
PRoCeSSeS oF The wATeR PolluTion ConTRol PlAnT. (Previously<br />
Wastewater Policy 3.3A.2)<br />
Policy supporting Goal EM-6 (Effective Wastewater Collection System):<br />
policy em-6.1 inSPeCT CRiTiCAl PoinTS in The wASTewATeR MAnAge-<br />
MenT SYSTeM AnnuAllY To enSuRe ThAT The PRoPeR level oF MAin-<br />
TenAnCe iS being PRovided And ThAT The Flow in SeweRS doeS noT<br />
exCeed deSign CAPACiTY. (Previously Wastewater Management Policy 3.3B.1)<br />
Policy supporting Goal EM-7 (Effective Wastewater Treatment):<br />
policy em-7.1 MoniToR wATeR PolluTion ConTRol PlAnT oPeRATionS<br />
And MAinTenAnCe To MeeT RegulAToRY STAndARdS. (Previously Wastewater<br />
Management Policy 3.3C.1)<br />
policy em-7.2 CooRdinATe oPeRATing PRoCeduReS wiTh The CiTY<br />
eneRgY PoliCY To oPTiMize An AlTeRnATive eneRgY PRogRAM So ThAT<br />
MiniMuM uSe And ReliAnCe ARe PlACed on ouTSide eneRgY SouRCeS.<br />
(Previously Wastewater Management Policy 3.3C.2)<br />
7–19
<strong>City</strong> <strong>of</strong> Sunnyvale GeneRal plan – July <strong>2011</strong><br />
7–20<br />
policy em-7.3 ACTivelY PARTiCiPATe in The wATeRShed MAnAgeMenT<br />
APPRoACh To Solving wATeR QuAliTY iSSueS oF The SAnTA ClARA<br />
bASin wATeRShed And The SouTh bAY. (Previously Wastewater Management<br />
Policy 3.3C.3)<br />
policy em-7.4 PRoduCe QuAliTY ReCYCled wATeR And Seek To<br />
MAxiMize The uSe oF ThiS ReSouRCe. (Previously Wastewater Management<br />
Policy 3.3C.4)<br />
n EM-7.4a Study feasibility <strong>of</strong> recycled water for restoration and/or enhancement <strong>of</strong><br />
marshlands.<br />
urBan run<strong>of</strong>f<br />
Goal eM-8<br />
proteCtion <strong>of</strong> CreekS and Bay<br />
ASSuRe The ReASonAble PRoTeCTion oF beneFiCiAl uSeS oF CReekS And<br />
SAn FRAnCiSCo bAY, eSTAbliShed in The RegionAl boARd’S bASin PlAn, And<br />
PRoTeCT enviRonMenTAllY SenSiTive AReAS. (Previously Surface Run<strong>of</strong>f Goal A /<br />
Adopted in1993)<br />
Goal eM-9<br />
adeQuate StorM drain SySteM<br />
MAinTAin SToRM dRAin SYSTeM To PRevenT Flooding. (Previously Surface<br />
Run<strong>of</strong>f Goal B / Adopted in 1993)
enviRonmental manaGement — uRban Run<strong>of</strong>f Chapter 7<br />
Goal eM-10<br />
reduCed run<strong>of</strong>f and pollutant diSCharGe<br />
MiniMize The QuAnTiTY oF RunoFF And diSChARge oF PolluTAnTS To The<br />
MAxiMuM exTenT PRACTiCAble bY inTegRATing SuRFACe RunoFF ConTRolS<br />
inTo new develoPMenT And RedeveloPMenT lAnd uSe deCiSionS. (Previously<br />
Surface Run<strong>of</strong>f Goal D / Adopted in 1993)<br />
Urban run<strong>of</strong>f consists <strong>of</strong> stormwater run<strong>of</strong>f from rainfall as well as non-stormwater<br />
run<strong>of</strong>f from human activities (e.g. over-irrigation <strong>of</strong> landscapes, vehicle washing,<br />
discharges from pools, spas, or water features, etc.). Urban run<strong>of</strong>f is collected and<br />
transported through the city’s storm drain system and ultimately discharged to local<br />
waterways. Managing urban run<strong>of</strong>f minimizes the discharge <strong>of</strong> pollutants to creeks,<br />
waterways, and San Francisco Bay, and prevents or minimizes flooding. The protection<br />
<strong>of</strong> local waterways preserves water quality and maintains the structural integrity <strong>of</strong><br />
creeks, channels, and shoreline to prevent both potential flooding and the degradation<br />
<strong>of</strong> their natural form and function.<br />
Urbanization increases impervious surfaces associated with development, which<br />
increases the amount <strong>of</strong> urban run<strong>of</strong>f. Run<strong>of</strong>f typically collects impurities while<br />
passing over ro<strong>of</strong>tops, streets, parking lots, landscaping and gutters. Often this run<strong>of</strong>f<br />
is untreated and deposits impurities in the creeks and the San Francisco Bay after being<br />
conveyed through a storm drain system. This increased run<strong>of</strong>f results in increased<br />
erosion and sedimentation in creeks. Conveying run<strong>of</strong>f through a storm drain system<br />
also makes less water available to creeks and groundwater during dry weather.<br />
There are two approaches to managing urban run<strong>of</strong>f. The first is the conveyance<br />
approach, which seeks to “get rid <strong>of</strong> the water.” A conveyance stormwater system collects<br />
and concentrates run<strong>of</strong>f through a network <strong>of</strong> impervious gutters, drainage structures<br />
and underground pipes. Because the system collects water from impermeable surfaces<br />
and carries it through impervious pipes, suspended pollutants are concentrated in the<br />
rapidly flowing run<strong>of</strong>f. When the system reaches its outfall, large volumes <strong>of</strong> polluted<br />
water can be emptied, untreated, into a natural water body and the large volume can<br />
further erode our natural waterways.<br />
The <strong>City</strong>, as part <strong>of</strong> the region, is transitioning from the conveyance approach to a newer<br />
infiltration approach <strong>of</strong>ten referred to as Low Impact Development (LID). This system<br />
seeks to “preserve and restore the hydrologic cycle.” An infiltration stormwater system<br />
seeks to infiltrate run<strong>of</strong>f into the soil by allowing its to flow slowly over permeable<br />
surfaces. These permeable surfaces can double as recreational and landscape areas<br />
during dry weather. Because the infiltration network allows much <strong>of</strong> the run<strong>of</strong>f to return<br />
to the soil, overall run<strong>of</strong>f volume is reduced, and more water is available to replenish<br />
groundwater and maintain stream base flows. Storm drain systems are designed to<br />
transport urban run<strong>of</strong>f to the San Francisco Bay or nearby creeks or channels. Adequate<br />
storm drain systems help prevent or minimize property damage due to flooding. The<br />
impervious surfaces:<br />
Constructed or modified<br />
surfaces that do not<br />
effectively allow infiltration<br />
<strong>of</strong> rainfall into the soil<br />
below. impervious surfaces<br />
include, but are not limited<br />
to building ro<strong>of</strong>tops, asphalt<br />
or concrete pavement,<br />
sidewalks, and driveways<br />
where such surfaces are not<br />
constructed with pervious<br />
materials. pervious Surfaces:<br />
May include natural or<br />
designed landscapes or<br />
specially constructed<br />
paving materials (e.g.<br />
pervious paving) that allow<br />
stormwater to infiltrate into<br />
sub-surface soils.<br />
7–21
<strong>City</strong> <strong>of</strong> Sunnyvale GeneRal plan – July <strong>2011</strong><br />
See dpw.inSunnyvale.com<br />
for more information about<br />
urban run<strong>of</strong>f BMps and <strong>City</strong><br />
programs.<br />
maximum extent<br />
practicable: a standard for<br />
implementation <strong>of</strong> stormwater<br />
management programs under<br />
the Clean Water act to reduce<br />
the level <strong>of</strong> the pollutants<br />
in stormwater run<strong>of</strong>f to the<br />
maximum extent possible,<br />
taking into account equitable<br />
considerations and competing<br />
facts including, but not<br />
limited to the seriousness<br />
<strong>of</strong> the problem, public<br />
health risks, environmental<br />
benefits, pollutant removal<br />
effectiveness, regulatory<br />
compliance, cost, and<br />
technical feasibility.<br />
7–22<br />
<strong>City</strong> <strong>of</strong> Sunnyvale owns and operates approximately 150 miles <strong>of</strong> storm drains, with two<br />
pump stations that collect run<strong>of</strong>f from low-lying urban areas and discharge to creeks<br />
and sloughs which are at a higher elevation (see Figure 7-8: Storm Drain System).<br />
To address both the quantity and quality <strong>of</strong> urban run<strong>of</strong>f, the <strong>City</strong> has undertaken a<br />
series <strong>of</strong> programs to both reduce and treat run<strong>of</strong>f. These programs and actions are<br />
collectively described as Urban Run<strong>of</strong>f Best Management Practices (BMPs). Urban<br />
Run<strong>of</strong>f BMPs are continually changing based on recent studies, practical experience<br />
and advancements in construction materials. These new practices include Low Impact<br />
Development, source control and pollution prevention. Low Impact Development<br />
includes methods to retain and treat run<strong>of</strong>f onsite through detention and landscape<br />
features. Source control measures typically include reducing the amount <strong>of</strong> impervious<br />
surface for new development or large remodeling/additions. Pollution prevention<br />
includes installing non-mechanical filters to lessen the volume <strong>of</strong> run<strong>of</strong>f, minimizing<br />
pesticides, covering areas such trash enclosures or loading docks and requiring drainage<br />
<strong>of</strong> dirty areas to sanitary sewer lines rather than storm drains. Public outreach and<br />
information is also an important part <strong>of</strong> reducing urban run<strong>of</strong>f.<br />
Regulations and Permit Requirements<br />
There are a variety <strong>of</strong> laws and permit requirements regulating the quantity and quality<br />
<strong>of</strong> urban run<strong>of</strong>f regionally. These agencies include:<br />
n Federal — The Federal Clean Water Act, as amended in 1987, requires the <strong>City</strong><br />
to obtain NPDES permits for discharge <strong>of</strong> stormwater and develop stormwater<br />
management plans and “to reduce the discharge <strong>of</strong> pollutants to the maximum<br />
extent practicable.” The San Francisco Bay Regional Water Quality Control Board<br />
(Regional Board or RWQCB) issues permits to meet requirements <strong>of</strong> the Federal<br />
Clean Water Act.<br />
n State — The Clean Water Act and State <strong>of</strong> California legislation requires that the<br />
beneficial uses <strong>of</strong> water bodies be protected, and must meet standards set for water<br />
quality and to control sources <strong>of</strong> pollution.<br />
n <strong>City</strong> — The <strong>City</strong> has an ordinance that addresses stormwater pollution prevention<br />
and provides appropriate adequate legal authority to implement provisions <strong>of</strong> its<br />
NPDES Stormwater Discharge Permit, which effectively implement controls on<br />
pollutants in urban run<strong>of</strong>f and meet permit requirements.<br />
Collaboration with Regional Agencies<br />
Water resource protection at the local and regional level is becoming more complex. A<br />
wide variety <strong>of</strong> regulatory agencies, diverse sources <strong>of</strong> nonpoint source pollution, and a<br />
multitude <strong>of</strong> stakeholders make it difficult to achieve a consistent, easily understandable<br />
strategy for watershed protection. The <strong>City</strong> continually works with a variety <strong>of</strong> agencies<br />
and stakeholders to facilitate watershed protection and urban run<strong>of</strong>f management.
The <strong>City</strong> is a member <strong>of</strong> the Santa Clara Valley Urban Run<strong>of</strong>f Pollution Prevention<br />
Program (SCVURPPP), an association <strong>of</strong> 13 south bay cities, the SCVWD, and Santa<br />
Clara Country. All members <strong>of</strong> SCVURPPP have shared a common NPDES stormwater<br />
permit for their discharge into local creeks and South San Francisco Bay since 1990 and<br />
leverage resources to better facilitate each agency’s compliance with the permit.<br />
Through SCVURPPP, the <strong>City</strong> also participates in the Bay Area Stormwater Management<br />
Agencies Association (BASMAA), which was started by local governments to promote<br />
regional consistency and to facilitate the efficient use <strong>of</strong> public resources by sharing<br />
information. In addition, BASMAA provides a forum for representing and advocating<br />
the common interests <strong>of</strong> member programs at the regional and state level.<br />
The <strong>City</strong> also participates in the California Stormwater Quality Association (CASQA),<br />
a quasi-governmental organization, which advises the State Water Resources Control<br />
Board on matters related to developing stormwater regulations. It assists municipalities<br />
and others in compliance with the municipal, construction and industrial NPDES<br />
stormwater mandates <strong>of</strong> the federal Clean Water Act.<br />
future Trends<br />
enviRonmental manaGement — uRban Run<strong>of</strong>f Chapter 7<br />
Regulatory requirements from both state and federal agencies will continue and likely<br />
become more restrictive as each NPDES Permit is re-issued. The <strong>City</strong> will need to<br />
perform periodic updating <strong>of</strong> the goals and policies associated with urban run<strong>of</strong>f, the<br />
Urban Run<strong>of</strong>f Management Plan, and sections <strong>of</strong> the Sunnyvale Municipal Code to<br />
address these changes, update data and emerging trends, as well as measure success<br />
toward completing urban run<strong>of</strong>f goals. Annual reports will continue to be made to<br />
the Regional Board to demonstrate compliance with NPDES permit provisions and<br />
document the <strong>City</strong>’s progress toward meeting the establish goals and policies through<br />
the implementation <strong>of</strong> action statements.<br />
In addition, the storm drain systems will continue to be monitored and maintained to<br />
ensure the adequate collection and transfer <strong>of</strong> urban run<strong>of</strong>f.<br />
Beneficial Uses: the uses<br />
<strong>of</strong> water <strong>of</strong> the State <strong>of</strong><br />
California that are protected<br />
against degradation.<br />
examples <strong>of</strong> beneficial uses<br />
include, but are not limited<br />
to: domestic, municipal,<br />
agricultural and industrial<br />
water supply; power<br />
generation; recreation;<br />
aesthetic enjoyment;<br />
navigation; and preservation<br />
<strong>of</strong> fish and wildlife and<br />
other aquatic resources or<br />
preserves.<br />
7–23
<strong>City</strong> <strong>of</strong> Sunnyvale GeneRal plan – July <strong>2011</strong><br />
figure 7-8: Storm<br />
Drain System<br />
7–24<br />
MIDDLEFIELD<br />
GRANT<br />
CENTRAL<br />
Storm Drain System<br />
Drainage Basin Boundary<br />
# Wells<br />
CA-85<br />
Storm Drain Pipes<br />
Well Buffer <strong>of</strong> 600 feet<br />
Retention Pond<br />
HMP Applicability Zone<br />
Infiltration Device Zones<br />
Exclusion<br />
Inclusion<br />
BERNARDO<br />
FREMONT<br />
Department <strong>of</strong> Public Works, 2001<br />
CA-237<br />
MARY<br />
REM<strong>IN</strong>GTON<br />
HOLLENBECK<br />
STELL<strong>IN</strong>G<br />
CENTRAL EXPRESSWAY<br />
<strong>SUNNYVALE</strong> SARATOGA<br />
<strong>SUNNYVALE</strong><br />
MATHILDA<br />
OLD SAN FRANCISCO<br />
US-280<br />
CALIFORNIA<br />
MAUDE<br />
EL CAM<strong>IN</strong>O REAL<br />
FAIR OAKS<br />
WOLFE<br />
JAVA<br />
FAIR OAKS<br />
EVELYN<br />
CARIBBEAN<br />
TASMAN<br />
REED<br />
HOMESTEAD<br />
LAWRENCE<br />
US-101<br />
ARQUES<br />
KIFER<br />
MONROE<br />
Major Streets<br />
GREAT AMERICA<br />
BOWERS<br />
Highway/Expressway<br />
ÅTrain Station<br />
! Light Rail Station<br />
Light Rail<br />
Railroad<br />
Creek<br />
Channel<br />
0.5<br />
Miles<br />
¸<br />
US-101
figure 7-9: Where does it go?<br />
enviRonmental manaGement — uRban Run<strong>of</strong>f Chapter 7<br />
Policies that support Goal EM-8 (Protection <strong>of</strong> Creeks and Bay):<br />
policy em-8.1 CoMPlY wiTh RegulAToRY ReQuiReMenTS And PARTiCi-<br />
PATe in PRoCeSSeS whiCh MAY ReSulT in ModiFiCATionS To RegulA-<br />
ToRY ReQuiReMenTS. (Previously Surface Run<strong>of</strong>f Policy A.1)<br />
policy em-8.2 ConTinue To SuPPoRT The idenTiFiCATion And develoPMenT<br />
oF APPRoACheS To SToRMwATeR TReATMenT And beST MAn-<br />
AgeMenT PRACTiCeS To ConTRol SouRCeS oF PolluTAnTS ThRough<br />
PARTiCiPATion in loCAl, RegionAl, STATewide And nATionAl ASSoCiA-<br />
TionS And AgenCieS (e.g. SAnTA ClARA vAlleY uRbAn RunoFF Pollu-<br />
Tion PRevenTion PRogRAM (SCvRRP), bAY AReA SToRMwATeR MAnAge-<br />
MenT AgenCieS ASSoCiATion, SToRMwATeR QuAliTY ASSoCiATion, And<br />
AMeRiCAn PubliC woRkS ASSoCiATion And SiMilAR oRgAnizATionS).<br />
(Previously Surface Run<strong>of</strong>f Policy A.2)<br />
policy em-8.3 enSuRe ThAT SToRMwATeR ConTRol MeASuReS And<br />
beST MAnAgeMenT PRACTiCeS (bMPS) ARe iMPleMenTed To ReduCe The<br />
diSChARge oF PolluTAnTS in SToRM wATeR To The MAxiMuM exTenT<br />
PRACTiCAble. (Previously Surface Run<strong>of</strong>f Policy A.3)<br />
7–25
<strong>City</strong> <strong>of</strong> Sunnyvale GeneRal plan – July <strong>2011</strong><br />
7–26<br />
n EM-8.3a Modify Industrial Pretreatment permits to also require BMPs to control<br />
the discharge <strong>of</strong> pollutants to city-owned storm drains. (Previously Surface Run<strong>of</strong>f<br />
Action Statement A.3b)<br />
n EM-8.3b Label approximately 1060 municipal storm drainage inlets a year until all<br />
inlets are labeled and maintain labels as necessary to educate the public on the fate<br />
<strong>of</strong> material discharged to storm drains. (Previously Surface Run<strong>of</strong>f Action Statement<br />
A.3e)<br />
policy em-8.4 eFFeCTivelY PRohibiT illiCiT diSChARgeS And iMPRoPeR<br />
diSPoSAl oF wASTeS inTo The SToRM dRAin SYSTeM. (Previously Surface<br />
Run<strong>of</strong>f Policy A.4)<br />
policy em-8.5 PRevenT ACCeleRATed Soil eRoSion. ConTinue<br />
iMPleMenTATion oF A ConSTRuCTion SiTe inSPeCTion And ConTRol<br />
PRogRAM To PRevenT diSChARgeS oF SediMenT FRoM eRoSion And<br />
diSChARgeS oF oTheR PolluTAnTS FRoM new And RedeveloPMenT<br />
PRoJeCTS. (PReviouSlY SuRFACe RunoFF PoliCY A.5)<br />
policy em-8.6 (new) MiniMize The iMPACTS FRoM SToRMwATeR And<br />
uRbAn RunoFF on The biologiCAl inTegRiTY oF nATuRAl dRAinAge<br />
SYSTeMS And wATeR bodieS.<br />
Policies that support Goal EM-9 (Adequate Storm Drain System):<br />
policy em-9.1 MAinTAin And oPeRATe The SToRM dRAin SYSTeM So ThAT<br />
SToRM wATeRS ARe dRAined FRoM 95 PeRCenT oF The STReeTS wiThin<br />
one houR AFTeR A SToRM SToPS. (Previously Surface Run<strong>of</strong>f Policy B.1.)<br />
policy em-9.2 ReSPond To SToRM dRAin eMeRgenCieS. (Previously<br />
Surface Run<strong>of</strong>f Policy B.2)
enviRonmental manaGement — uRban Run<strong>of</strong>f Chapter 7<br />
Policies that support Goal EM-10 (Reduced Run<strong>of</strong>f and Pollutant Discharge):<br />
policy em-10.1 ConSideR The iMPACTS oF SuRFACe RunoFF AS PART<br />
oF lAnd uSe And develoPMenT deCiSionS And iMPleMenT bMPS To<br />
MiniMize The ToTAl voluMe And RATe oF RunoFF oF wASTe QuAliTY And<br />
QuAnTiTY (hYdRo ModiFiCATion) oF SuRFACe RunoFF AS PART oF lAnd<br />
uSe And develoPMenT deCiSionS. (Previously Surface Run<strong>of</strong>f Policy D.1)<br />
policy em-10.2 ConSideR The AbiliTY oF A lAnd PARCel To<br />
deTAin exCeSS SToRM wATeR RunoFF in Flood PRone AReAS And<br />
ReQuiRe inCoRPoRATion oF APPRoPRiATe ConTRolS. ReQuiRe The<br />
inCoRPoRATion oF APPRoPRiATe SToRMwATeR TReATMenT And<br />
ConTRol MeASuReS FoR new And RedeveloPMenT RegulATed<br />
PRoJeCTS And/oR AnY SiTeS ThAT MAY ReASonAblY be ConSideRed To<br />
CAuSe oR ConTRibuTe To The PolluTion oF SToRMwATeR And uRbAn<br />
RunoFF AS deFined in The CuRRenT veRSion oF The SToRMwATeR<br />
MuniCiPAl RegionAl PeRMiT. (Previously Surface Run<strong>of</strong>f Policy D.2)<br />
policy em-10.3 ReQuiRe The inCoRPoRATion oF APPRoPRiATe<br />
SToRMwATeR TReATMenT And ConTRol MeASuReS FoR induSTRiAl And<br />
CoMMeRCiAl FACiliTieS AS idenTiFied in The SToRMwATeR MuniCiPAl<br />
RegionAl PeRMiT. (New)<br />
policy em-10.4 SuPPoRT legiSlATion And RegulATionS ThAT will<br />
ReduCe oR eliMinATe PolluTAnTS oF ConCeRn AT The SouRCe. (New)<br />
policy em-10.5 PRoMoTe eduCATion And ouTReACh eFFoRTS To<br />
SChoolS, YouTh, ReSidenTS, And buSineSSeS RegARding uRbAn<br />
RunoFF And SToRMwATeR PolluTion PRevenTion ACTionS. (New)<br />
7–27
<strong>City</strong> <strong>of</strong> Sunnyvale GeneRal plan – July <strong>2011</strong><br />
7–28<br />
air Quality<br />
Goal eM-11<br />
iMproved air Quality<br />
iMPRove SunnYvAle’S AiR QuAliTY And ReduCe The exPoSuRe oF iTS CiTizenS<br />
To AiR PolluTAnTS. (Previously Air Quality Goal A / Adopted in 1993)<br />
All major urban areas in California, including Sunnyvale, experience some degree <strong>of</strong><br />
reduced air quality. The combination <strong>of</strong> climatic conditions and a multitude <strong>of</strong> air<br />
pollutant sources (particularly the automobile) results in reduced air quality, which<br />
can be considered as reducing the quality <strong>of</strong> life by adversely affecting human health,<br />
causing damage to plants or crops, and other effects such as soiling, visibility reduction<br />
and accelerated corrosion <strong>of</strong> materials.<br />
One <strong>of</strong> the major reasons that air quality continues to be a problem in the Bay Area<br />
specifically and California in general, is a relatively high rate <strong>of</strong> population and economic<br />
growth. The major obstacle to improved air quality in the future is increasing population<br />
and vehicle use and deteriorating operating conditions on highways and roads.<br />
The major air quality problems in the Bay Area are ozone, carbon monoxide, and PM-10.<br />
Ozone and carbon monoxide are primarily released in the air from combustion sources<br />
such as automobiles and factories. PM-10 (otherwise known as suspended particulate<br />
matter) is a collection <strong>of</strong> particles <strong>of</strong> dust, soot, aerosols and other matter which are small<br />
enough to remain suspended in the air for a long period <strong>of</strong> time. Man-made sources <strong>of</strong><br />
PM-10 include automobile exhausts and road travel, smoke, and factory emissions.<br />
To combat this, the most efficient and cost-effective technological or “hardware”<br />
controls have already been implemented. Remaining technological controls, which<br />
are increasingly expensive, have been found to be unable to reduce emissions to the<br />
point where all air quality standards (glossary in the margin) would be met. Therefore,<br />
attention has been focused in recent years on the relationship <strong>of</strong> land use, community<br />
design and transportation as a means <strong>of</strong> reducing air pollutant generation. For further<br />
information on air quality measurements and modeling, see Appendix H, Air Quality<br />
Technical Report.<br />
Cooperation with Regional Agencies<br />
Past efforts by federal, state and local governments have resulted in steady, gradual<br />
improvement in air quality in Sunnyvale and the greater Bay Area. Sunnyvale is within<br />
the Bay Area Air Quality Management District (BAAQMD). The <strong>City</strong> <strong>of</strong> Sunnyvale<br />
has implemented a number <strong>of</strong> programs and projects that directly or indirectly reduce<br />
air pollutant emissions. Most <strong>of</strong> these programs are part <strong>of</strong> a larger regional effort to<br />
improve air quality. These projects include:
n Adding high occupancy vehicle (HOV) lanes to U.S. 101, S.R. 85, and S.R. 237. These<br />
improvements have expanded their capacity.<br />
n Facilitating regional transportation such as the Tasman Light Rail extension,<br />
increases in Caltrain service, and a “Super Express” commuter bus service.<br />
n Constructing high occupancy vehicle (HOV) lanes on Lawrence Expressway.<br />
policy em-11.1 The CiTY Should ACTivelY PARTiCiPATe in RegionAl AiR<br />
QuAliTY PlAnning. (Previously Air Quality Policy C.1 also Air Quality Goal C)<br />
Land Use and Air Quality<br />
enviRonmental manaGement — aiR Quality Chapter 7<br />
Future development within Sunnyvale impacts regional air quality. Direct impacts are<br />
those related to emissions released on-site from stationary sources. Indirect impacts<br />
are related to vehicle trips attracted to or generated by residential, commercial or<br />
employment-generating land uses.<br />
Stationary Sources — Industries are required to provide information to the public<br />
about emissions <strong>of</strong> toxic air contaminants (quick description in the margin) and their<br />
impact on public health. There are 71 sources <strong>of</strong> TACs within Sunnyvale. The majority<br />
<strong>of</strong> these sources are microelectronic industries, dry cleaners and auto repair businesses.<br />
Future growth in Sunnyvale may include new stationary sources <strong>of</strong> pollutants. However,<br />
any new stationary sources would be subject to the “no net increase” requirements <strong>of</strong><br />
the California Clean Air Act, which requires BAAQMD to develop a permitting system<br />
that provides new sources, can only be approved if there is an <strong>of</strong>fsetting decrease in<br />
emissions elsewhere in the air basin. For any new businesses or facilities that could<br />
emit air pollutants, it is important to consider sensitive receptors. The siting <strong>of</strong> any new<br />
sensitive receptors also needs to consider any existing air pollutant sources nearby.<br />
Indirect Sources— Indirect automobile emissions estimated with future buildout are<br />
shown to increase slightly in the next 10 years. Reducing emissions from these indirect<br />
sources is likely to be an important strategy in regional efforts to attain the state and<br />
federal ambient air quality standards in the Bay Area.<br />
There are several methods in which land use regulations can be used to both reduce<br />
emissions and alleviate the impact on residents. By locating employment and retail<br />
service areas closer to residential areas, vehicle use can be reduced.<br />
In 1993, the Sunnyvale Futures Study examined the effects <strong>of</strong> revising the General<br />
Plan to provide for an improved jobs/housing balance. The study considered potential<br />
residential designations <strong>of</strong> several sites previously designated with commercial and<br />
industrial uses and was approved by Council and created a series <strong>of</strong> Industrial-to-<br />
Residential (ITR sites.) Preliminary findings indicated that increased carbon monoxide<br />
concentrations will occur at certain intersections. However, predicted air quality would<br />
the Bay area air Quality<br />
Management district<br />
(BaaQMd) is required to<br />
prepare and adopt a list<br />
<strong>of</strong> actions, improvements<br />
and programs that improve<br />
system-wide transportation<br />
level <strong>of</strong> service (loS) and<br />
improve air quality. see<br />
Goal lt-5 (effective, safe,<br />
pleasant and convenient<br />
transportation) for<br />
further discussion and<br />
policies on transportation<br />
improvements.<br />
california clean air act<br />
— a law setting forth a<br />
comprehensive program to<br />
ensure that all areas within<br />
the State <strong>of</strong> California will<br />
attain federal and state<br />
ambient air quality standards<br />
by the earliest practicable<br />
date. the law mandates<br />
comprehensive planning<br />
and implementation efforts,<br />
and empowers local air<br />
pollution control districts to<br />
adopt transportation control<br />
measures and indirect source<br />
control measures to achieve<br />
and maintain the ambient air<br />
quality standards.<br />
7–29
<strong>City</strong> <strong>of</strong> Sunnyvale GeneRal plan – July <strong>2011</strong><br />
sensitive receptors —<br />
Sensitive populations such<br />
as children, athletes, elderly<br />
and the sick that are more<br />
susceptible to the effects<br />
<strong>of</strong> air pollution than the<br />
population at large.<br />
see Goal lt-1 (coordinated<br />
regional planning) and<br />
lt-6 (supportive economic<br />
Development environment)<br />
for policies on mixed uses<br />
and locating housing closer to<br />
employment centers<br />
7–30<br />
fall within the standards. Improvements in the job/housing balance would provide<br />
more local housing options, reducing commute lengths and vehicle miles traveled.<br />
Major progress has been made in the 1980’s and 1990’s in reducing emissions from<br />
stationary sources and mobile sources in the Bay Area, with the result that steady<br />
improvement in air quality has been documented despite population growth. Under the<br />
California Clean Air Act and Amendments, the state Air Resources Board and BAAQMD<br />
will be adopting new and more stringent regulations on existing and future industrial<br />
sources, implementing more stringent emission standards for vehicles, developing and<br />
implementing transportation control measures (TCMs) to reduce vehicular emissions,<br />
and adding new sources to the list <strong>of</strong> controlled process (e.g. consumer products,<br />
fireplaces and wood stoves, etc.). These measures, if implemented expeditiously, should<br />
continue the overall improvement in air quality evident over the past 20 years.<br />
policy em-11.2 uTilize lAnd uSe STRATegieS To ReduCe AiR QuAliTY<br />
iMPACT, inCluding oPPoRTuniTieS FoR CiTizenS To live And woRk in<br />
CloSe PRoxiMiTY. (Previously Air Quality Policies B.1 and C.2)<br />
policy em-11.3 ReQuiRe All new develoPMenT To uTilize SiTe<br />
PlAnning To PRoTeCT CiTizenS FRoM unneCeSSARY exPoSuRe To AiR<br />
PolluTAnTS. (Previously Air Quality Policy A.1)<br />
policy em-11.4 APPlY The indiReCT SouRCe Rule To new develoPMenT<br />
wiTh SigniFiCAnT AiR QuAliTY iMPACTS. indiReCT SouRCe Review<br />
would CoveR CoMMeRCiAl And ReSidenTiAl PRoJeCTS AS well AS<br />
oTheR lAnd uSeS ThAT PRoduCe oR ATTRACT MoToR vehiCle TRAFFiC.<br />
(Previously Air Quality Policy B.3)<br />
Transportation Improvements and Air Quality<br />
There are two main ways that transportation improvements can positively impact air<br />
quality. The first is to reduce congestion that causes increased vehicle emissions (stopand-go).<br />
The second is to enhance and encourage alternative modes <strong>of</strong> transportation<br />
to reduce the total number <strong>of</strong> car trips. Sunnyvale has undertaken a variety <strong>of</strong> programs<br />
to improve air quality with regards to transportation.
Reduce Congestion<br />
n Traffic signal improvement and synchronization<br />
n Ten-year capital improvements plan<br />
n Preferential parking for carpool vehicles<br />
n Transportation demand management (TDM)<br />
Alternative Transportation Modes<br />
n Continue to require <strong>City</strong> sidewalks<br />
n Develop requirements for bicycle facilities<br />
n Bicycle and Pedestrian Advisory Committee (BPAC) to review and advise <strong>City</strong><br />
Council on capital improvement projects involving bicycle and pedestrian facilities<br />
as well as educational programs.<br />
n Electric <strong>City</strong> vehicles<br />
enviRonmental manaGement — aiR Quality Chapter 7<br />
policy em-11.5 ReduCe AuToMobile eMiSSionS ThRough TRAFFiC And<br />
TRAnSPoRTATion iMPRoveMenTS. (Previously Air Quality Policy A.2)<br />
policy em-11.6 ConTRibuTe To A ReduCTion in RegionAl vehiCle<br />
MileS TRAveled. (Previously Air Quality Policy C.3)<br />
policy em-11.7 ReduCe eMiSSionS FRoM CiTY oF SunnYvAle FleeT<br />
vehiCleS. (Previously Air Quality Policy C.4)<br />
policy em-11.8 ASSiST eMPloYeRS in MeeTing ReQuiReMenTS oF<br />
TRAnSPoRTATion deMAnd MAnAgeMenT (TdM) PlAnS FoR exiSTing<br />
And FuTuRe lARge eMPloYeRS And PARTiCiPATe in The develoPMenT<br />
oF TdM PlAnS FoR eMPloYMenT CenTeRS in SunnYvAle. (Previously Air<br />
Quality Policy B.2)<br />
See Goal lt-5 (effective,<br />
safe, pleasant and<br />
convenient transportation)<br />
for policies on transportation<br />
improvements.<br />
transportation Demand<br />
management (tDm) —<br />
Strategies that reduce<br />
travel demand such<br />
as telecommuting,<br />
teleshopping, flextime,<br />
carpooling, increased use<br />
<strong>of</strong> public transit, and other<br />
strategies to reduce the<br />
number <strong>of</strong> trips made in<br />
single-occupant vehicles.<br />
7–31
<strong>City</strong> <strong>of</strong> Sunnyvale GeneRal plan – July <strong>2011</strong><br />
7–32<br />
Solid WaSte<br />
Collection Programs<br />
Goal eM-12<br />
Safe and healthy Solid WaSte ColleCtion<br />
enSuRe ThAT MuniCiPAl Solid wASTe iS ColleCTed And TRAnSPoRTed in A SAFe<br />
And heAlThY MAnneR. (Previously Solid Waste Goal 3.2A / Adopted in 1993)<br />
Goal eM-13<br />
Clean neiGhBorhoodS<br />
enCouRAge ReSidenTS To MAinTAin CleAn neighboRhoodS bY PRevenTing<br />
unSighTlY ACCuMulATionS oF diSCARded MATeRiAlS And illegAl duMPing oF<br />
MuniCiPAl Solid wASTe. (Previously Solid Waste Goal 3.2B / Adopted in 1996)<br />
Solid waste consists <strong>of</strong> virtually all <strong>of</strong> the materials discarded by residents and<br />
businesses in the course <strong>of</strong> daily life, business activities and manufacturing. It does not<br />
include hazardous wastes, radioactive wastes, medical waste, sewage or liquids. Because<br />
accumulations <strong>of</strong> solid waste can present public health problems, the Sunnyvale<br />
Municipal Code requires all occupied residence and business premises to subscribe to<br />
regular collection services. According to a 2010 study performed for the <strong>City</strong> by Cascadia<br />
Consulting Group, single-family residents generate approximately 34 percent <strong>of</strong> the<br />
solid waste collected, multi-family residents account for 22 percent, and the remaining<br />
44 percent comes from businesses, government agencies, schools and other institutions<br />
and construction and demolition projects.<br />
Collection <strong>of</strong> solid waste in Sunnyvale is performed by a private company under contract<br />
with the <strong>City</strong>. The contract takes the form <strong>of</strong> a franchise agreement that is “exclusive,”<br />
that is, no other company is allowed to collect solid waste. Exclusivity minimizes the<br />
community and environmental impacts <strong>of</strong> refuse collection by limiting the number<br />
<strong>of</strong> trucks used for collection. It reduces pavement damage, noise and air pollution<br />
from heavy collection trucks compared to an open market approach where multiple<br />
companies may serve homes and businesses located near each other. The Sunnyvale<br />
franchise agreement also gives the <strong>City</strong> the ability to enforce community standards for<br />
service quality, collection hours, truck and container colors and cleanliness, graffiti<br />
removal, use <strong>of</strong> clean air fuels, etc.<br />
The <strong>City</strong> periodically provides special disposal programs at discounted or no cost. These<br />
programs are designed to discourage illegal dumping <strong>of</strong> solid waste and to minimize<br />
accumulations <strong>of</strong> discarded material in the community. These programs include:
enviRonmental manaGement — solid waste Chapter 7<br />
n Spring/Fall Extra Dump Weekends —On four weekends per year (two each for<br />
spring and fall), Sunnyvale residents can dispose <strong>of</strong> extra solid waste at the <strong>City</strong>owned<br />
Sunnyvale Materials Recovery and Transfer (SMaRT Station®), 301 Carl Road,<br />
at no charge. “Extra Dump” Weekends are for residents only, and not for businesses,<br />
contractors, non-resident property owners or other commercial establishments. The<br />
SMaRT Station permit allows over 1,000 vehicle trips per day on Extra Dump event<br />
days.<br />
n On-Call Collection — Service to residents <strong>of</strong> single-family homes includes as many<br />
as two on-call collections per calendar year. Residents may schedule these pickups<br />
on any <strong>of</strong> their regular collection days and may set out two cubic yards <strong>of</strong> extra solid<br />
waste and two “bulky” items, such as a couch, refrigerator, or other appliance.<br />
n Neighborhood Cleanups — Working with recognized neighborhood associations,<br />
the <strong>City</strong> <strong>of</strong>fers a number <strong>of</strong> neighborhood cleanup events. During these events,<br />
typically held on a weekend, the <strong>City</strong> arranges for delivery <strong>of</strong> “roll-<strong>of</strong>f” debris boxes<br />
to pre-selected locations. The boxes are emptied and returned throughout the event.<br />
These events provide a convenient disposal option for residents who cannot or do<br />
not utilize other special disposal options.<br />
policy em-12.1 PRovide ConvenienT And CoMPeTiTivelY PRiCed Solid<br />
wASTe ColleCTionS SeRviCeS. (Previously Solid Waste Policy 3.2A.1)<br />
policy em-13.1 PRovide PeRiodiC oPPoRTuniTieS FoR ReSidenTS To<br />
diSPoSe oF ReFuSe AT diSCounTed oR no ChARge. (Previously Solid waste<br />
Policy 3.2C.1)<br />
7–33
<strong>City</strong> <strong>of</strong> Sunnyvale GeneRal plan – July <strong>2011</strong><br />
7–34<br />
Recycling and Source Reduction<br />
Goal eM-14<br />
reCyClinG and SourCe reduCtion proGraMS<br />
ReduCe Solid wASTe ThRough ReCYCling, SouRCe ReduCTion, eduCATion<br />
And SPeCiAl PRogRAMS. (Previously Solid Waste Goal 3.2B/Adopted in 1996)<br />
Sunnyvale has long been a leader in recycling and in 1982 was one <strong>of</strong> the first cities in<br />
the Bay Area to begin collecting residential recyclables at curbside. In 1990, Sunnyvale<br />
became the first city in the state to adopt the Source Reduction and Recycling Element<br />
required by the Integrated Waste Management Act <strong>of</strong> 1989 (AB 939). In 1994 the SMaRT<br />
Station materials recovery facility (MRF) began sorting recyclables from solid waste<br />
and remains one <strong>of</strong> the most sophisticated municipal MRFs in the nation.<br />
These and other programs and facilities are reflected in Sunnyvale’s state-calculated<br />
diversion rate, which has increased from 18 percent in 1990 to 65 percent in 2009. In 2009<br />
the state Disposal Reporting System coordinated by CalRecycle documented disposal <strong>of</strong><br />
88,442 tons originating in Sunnyvale. This marks a 60 percent disposal reduction since<br />
1982, when the <strong>City</strong> disposed <strong>of</strong> 222,000 tons, even though the <strong>City</strong> has seen substantial<br />
growth in population and business activity over that 27-year period. Milestone dates <strong>of</strong><br />
major components <strong>of</strong> the <strong>City</strong>’s diversion effort include:<br />
n Curbside recycling for single-family residences (1982)<br />
n Concrete Recycling lease at Sunnyvale Landfill (1985)<br />
n Household Hazardous Waste drop-<strong>of</strong>f events (1985)<br />
n Cardboard collection for businesses (1991)<br />
n <strong>City</strong> Facility Recycling (1991)<br />
n Materials Recovery Facility operations at SMaRT Station (1994)<br />
n Yard trimmings collection for single-family residences (1994)<br />
n Recycling collection for multi-family residences (1996)<br />
n New Materials Recovery Facility at SMaRT Station (2009)<br />
Zero Waste Strategic Plan<br />
In 2009, the <strong>City</strong> Council adopted a Zero Waste Policy that broadly describes a vision<br />
for even greater diversion efforts. The first step in implementing the Zero Waste Policy<br />
was a 2010 study detailing the composition <strong>of</strong> Sunnyvale’s generated and disposed<br />
waste (the latter consisting <strong>of</strong> the unrecycled residue following materials recovery at the<br />
SMaRT Station).
As <strong>of</strong> <strong>2011</strong>, the <strong>City</strong> had contracted with a consultant to create a Zero Waste Strategic<br />
Plan that will define just what “Zero Waste” is and will identify program and facility<br />
options for achieving Zero Waste. Potential actions will be both “upstream,” as in<br />
placing controls on problematic materials that become waste and “downstream,” as in<br />
technologies such as composting and anaerobic digestion with the potential to extract<br />
additional value from SMaRT Station residues that are currently disposed.<br />
Many components <strong>of</strong> solid waste have economic value when they are separated,<br />
handled, packaged or <strong>of</strong>fered for collection in a manner different from solid waste.<br />
Other components have been designated by state or federal regulations as hazardous<br />
waste that may not be disposed in a landfill. Over the past 30 years, this trend has<br />
led to an increasingly fragmented waste stream, with equally fragmented systems for<br />
collecting, handling and disposing or recycling individual waste stream components.<br />
This increased regulation and special handling has provided benefits to the environment<br />
by minimizing damaging discharges to air, water and land. It has also increased the<br />
efficiency <strong>of</strong> the economy as a whole, by extracting value from products previously<br />
disposed. But, while those who manufacture, distribute and retail products pr<strong>of</strong>it from<br />
their sale, the “end <strong>of</strong> life” costs associated with achieving these environmental and<br />
societal benefits are borne primarily by local agencies, such as the <strong>City</strong>, and ultimately<br />
paid for by local rate payers and taxpayers. This imbalanced approach provides a<br />
misleading message to consumers by understating the true cost <strong>of</strong> their individual<br />
purchases, while increasing the refuse disposal bills <strong>of</strong> the community, regardless <strong>of</strong> the<br />
individual rate payer’s level <strong>of</strong> consumption.<br />
Product Stewardship<br />
enviRonmental manaGement — solid waste Chapter 7<br />
One way to restore an appropriate balance <strong>of</strong> responsibility is the concept <strong>of</strong> Product<br />
Stewardship, an approach that holds producers liable for the costs <strong>of</strong> responsibly<br />
managing their products at end <strong>of</strong> life. Extending producer responsibility for products<br />
from “cradle to cradle” acknowledges that producers have the greatest control over<br />
product design and therefore have the greatest ability and responsibility to reduce toxicity<br />
and waste. The <strong>City</strong> <strong>of</strong> Sunnyvale has a history <strong>of</strong> supporting product stewardship – on<br />
April 16, 2002, Council directed that the <strong>City</strong> become a member <strong>of</strong> the national Product<br />
Stewardship Institute and passed a product stewardship resolution.<br />
Product Stewardship is more effective at the state and national levels than it is locally,<br />
given the flows <strong>of</strong> people and products throughout the region. Successful examples<br />
in California include 2010 legislation that will put the paint industry in charge <strong>of</strong><br />
collecting waste paint and the carpet industry in charge <strong>of</strong> recovering and recycling<br />
used carpeting. The cost <strong>of</strong> the stewardship system will be built into the cost paid by<br />
consumers <strong>of</strong> paint and carpet.<br />
7–35
<strong>City</strong> <strong>of</strong> Sunnyvale GeneRal plan – July <strong>2011</strong><br />
7–36<br />
household hazardous Wastes<br />
By law, hazardous wastes are not to be collected or disposed along with municipal solid<br />
waste. Disposal <strong>of</strong> hazardous wastes generated by businesses is regulated by state and<br />
federal laws that require documentation <strong>of</strong> shipments, including their receipt at the<br />
hazardous waste disposal site.<br />
Hazardous waste generated by residential use is termed, “Household Hazardous Waste,”<br />
or HHW. Common HHW items include paint, pesticides, lawn care products, home<br />
maintenance and cleaning products and automotive products. It is illegal to dispose <strong>of</strong><br />
HHW with ordinary garbage.<br />
One way to reduce the amount <strong>of</strong> HHW that is improperly disposed is to provide<br />
residents with legal opportunities for disposal <strong>of</strong> HHW. To this end, the <strong>City</strong> provides<br />
HHW drop <strong>of</strong>f events by way <strong>of</strong> the Countywide HHW Program, with a portion <strong>of</strong><br />
the program funding coming from a per-ton fee charged by Santa Clara County on<br />
disposed solid waste. The remaining cost is paid by the Solid Waste Program from<br />
garbage collection rate revenues.<br />
The <strong>City</strong> leases to the Countywide HHW Program an event site at 164 Carl Road. As<br />
<strong>of</strong> <strong>2011</strong>, this is one <strong>of</strong> three fixed locations at which the Program holds regular events,<br />
eleven a year at the Sunnyvale site. The other locations are in San Martin and in San<br />
Jose. Sunnyvale residents are eligible to use events at the three fixed sites or any <strong>of</strong> the<br />
temporary locations used by the Program. Sunnyvale resident participation, measured<br />
by the number <strong>of</strong> vehicles dropping <strong>of</strong>f HHW, equals 7-8 percent <strong>of</strong> the number <strong>of</strong><br />
single-family homes in Sunnyvale.<br />
Encouraging resident use <strong>of</strong> HHW events is not necessarily the best or most costeffective<br />
way to decrease improper disposal <strong>of</strong> HHW. HHW disposal is costly (about<br />
$60 per vehicle on average, in 2010) and unbridled use <strong>of</strong> HHW events could cause<br />
serious cost increases for the Solid Waste Fund and higher rates for Sunnyvale residents<br />
and businesses.<br />
As a result, the <strong>City</strong> encourages reduced generation <strong>of</strong> HHW and an Extended Producer<br />
Responsibility (EPR) approach to handling discarded HHW. Residents are encouraged<br />
to reduce generation by:<br />
n Using non-toxic alternatives<br />
n Using up products that would become HHW if discarded<br />
n Sharing products with neighbors and friends<br />
As described above, an EPR approach to items that will become HHW when discarded<br />
places more responsibility for end-<strong>of</strong>-life management with the businesses that<br />
manufacture, distribute and sell hazardous materials to consumers. EPR has the<br />
potential to reduce the <strong>City</strong>’s cost <strong>of</strong> managing HHW material. Materials that adversely<br />
affect public health and the environment if improperly disposed and that could be<br />
better managed with an EPR approach include pharmaceuticals, sharps (needles and<br />
lancets) and household batteries.
policy em-14.1 ReduCe geneRATion oF Solid wASTe bY PRoviding<br />
SouRCe ReduCTion PRogRAMS And PRoMoTing ReduCTion behAvioR.<br />
(Previously Solid Waste Policy 3.2B.1)<br />
policy em-14.2 MAxiMize diveRSion oF Solid wASTe FRoM diSPoSAl<br />
bY uSe oF deMAnd MAnAgeMenT TeChniQueS, PRoviding And<br />
PRoMoTing ReCYCling PRogRAMS And enCouRAging PRivATe SeCToR<br />
ReCYCling. (Previously Solid Waste Policy 3.2B.2)<br />
policy em-14.3 MeeT oR exCeed All FedeRAl, STATe And loCAl<br />
lAwS And RegulATionS ConCeRning Solid wASTe diveRSion And<br />
iMPleMenTATion oF ReCYCling And SouRCe ReduCTion PRogRAMS.<br />
(Previously Solid Waste Policy 3.2B.3)<br />
policy em-14.4 inCReASe deMAnd FoR ReCYCled MATeRiAlS bY<br />
AdvoCATing loCAl, STATe And FedeRAl legiSlATion ThAT will inCReASe<br />
uSe oF ReCYCled ConTenT PRoduCTS. (Previously Solid Waste Policy 3.2B.4)<br />
Disposal Programs<br />
Goal eM-15<br />
environMentally-Sound diSpoSal<br />
enviRonmental manaGement — solid waste Chapter 7<br />
diSPoSe oF Solid wASTe in An enviRonMenTAllY Sound, dePendAble And<br />
CoST-eFFeCTive MAnneR. (Previously Solid Waste Goal 3.2D / Adopted in 1996)<br />
From the <strong>City</strong>’s perspective, the environmental impacts, costs and legal liabilities<br />
<strong>of</strong> solid waste disposal link together the past, the future and the present. The past is<br />
important because the <strong>City</strong> and individual waste generators located in Sunnyvale retain<br />
liability for environmental issues related to waste previously disposed, regardless <strong>of</strong> the 7–37
<strong>City</strong> <strong>of</strong> Sunnyvale GeneRal plan – July <strong>2011</strong><br />
7–38<br />
location. This calls for responsible management <strong>of</strong> the closed Sunnyvale Landfill, which<br />
served the community’s waste disposal needs from the 1920s to 1993. The future is<br />
important because it will someday become the past. That is to say, the <strong>City</strong>’s choices <strong>of</strong><br />
disposal method and location for the waste <strong>of</strong> the future will someday create liability<br />
for actions taken or not taken with regard to that waste. In the present, the <strong>City</strong> expends<br />
money based on past waste disposal decisions and plans its future disposal methods and<br />
locations.<br />
The <strong>City</strong>’s choice <strong>of</strong> disposal method and site is <strong>of</strong> great importance to the <strong>City</strong> itself and<br />
to waste generators located in Sunnyvale due to the liability associated with disposal.<br />
Waste placed in a landfill doesn’t go “away” and, under certain circumstances, future<br />
environmental cleanup costs at a disposal site may create financial liability for the <strong>City</strong>.<br />
In decades past the <strong>City</strong> has, in fact, been assessed liability for small percentages <strong>of</strong> the<br />
cleanup cost at two hazardous waste landfills and a waste oil recycling facility. Although<br />
the dollar amounts in these cases were relatively small, the experience is instructive.<br />
Closed Sunnyvale Landfill<br />
The Sunnyvale Landfill stopped accepting refuse on September 30, 1993. Final cover<br />
placement in compliance with state regulations was completed in 1994. Approximately<br />
93 <strong>of</strong> the landfill’s 100 acres contain waste. An area <strong>of</strong> about 7 acres is developed for<br />
post-closure use as a biosolids mon<strong>of</strong>ill disposal site. It is designed to accept biosolids<br />
from the WPCP when market conditions or the characteristics <strong>of</strong> the biosolids make it<br />
difficult or expensive to take them elsewhere.<br />
The closed landfill represents one <strong>of</strong> the largest areas <strong>of</strong> open space in Sunnyvale. It<br />
is especially valued for recreation because portions are adjacent to the Bay Trail. The<br />
walking trails and landfill maintenance roads on the South and West Hills are heavily<br />
used for lunch time recreation by employees <strong>of</strong> companies located in the nearby M<strong>of</strong>fett<br />
Park industrial area. Walking, biking, bird watching and the scenic views from the top<br />
<strong>of</strong> the West Hill are especially popular with the public.<br />
Since closure, the landfill has developed increasing biological diversity. Many mammal,<br />
reptile and bird species are observed. Most notable is the Western Burrowing Owl<br />
(Athene cunicularia hypugaea), a “species <strong>of</strong> special concern.” Burrowing owls nest in<br />
old ground squirrel burrows on the landfill surface and are observed seasonally, <strong>of</strong>ten<br />
at up to four sites. The <strong>City</strong> manages the landfill surface around these owl sites so as to<br />
enhance its value as habitat for the owls (for example, grass is mowed short to enhance<br />
visibility <strong>of</strong> prey and predators). Landfill maintenance activities are scheduled to avoid<br />
active burrows and to avoid choice nesting sites in the breeding season. Additionally,<br />
leash laws are actively enforced as the presence <strong>of</strong> loose dogs discourages use <strong>of</strong> the<br />
landfill as owl habitat.
Asphalt and Concrete Recycling facility<br />
Since 1985, the <strong>City</strong> has leased space at or near the landfill to a private company that<br />
recycles concrete and asphalt. The source <strong>of</strong> the raw material is typically pavement<br />
material generated by roadway and sidewalk repairs or demolition <strong>of</strong> concrete structures.<br />
Because the facility accepts material that would be otherwise disposed <strong>of</strong> in a landfill,<br />
it is an important component <strong>of</strong> the <strong>City</strong>’s compliance with the 50 percent diversion<br />
mandate contained in the California Integrated Waste Management Act <strong>of</strong> 1989 (AB<br />
939). The <strong>City</strong>’s lease requires the operator to report the jurisdiction <strong>of</strong> origin <strong>of</strong> the<br />
raw materials, and that information is available to the <strong>City</strong> and other jurisdictions for<br />
preparing AB 939 compliance reports.<br />
household hazardous Waste<br />
Another post-closure activity is the Household Hazardous Waste (HHW) event site at<br />
164 Carl Road, which is leased by the <strong>City</strong> to the Countywide HHW Program. This<br />
location is also used as an operations base and storage location for the <strong>City</strong>’s landfill<br />
post-closure maintenance staff.<br />
Kirby Canyon Landfill<br />
enviRonmental manaGement — solid waste Chapter 7<br />
Waste is disposed at Kirby Canyon under a 1991 disposal agreement between the <strong>City</strong><br />
and Waste Management <strong>of</strong> California, a private company that operates Kirby Canyon,<br />
leasing the site from Castle & Cook. The term <strong>of</strong> the disposal agreement ends in 2021.<br />
The agreement requires that the <strong>City</strong> deliver to the SMaRT Station all municipal solid<br />
waste collected by its franchised hauler. It then requires that all municipal solid waste<br />
that is not segregated at the SMaRT Station for recycling be delivered to Kirby Canyon<br />
for disposal. Although the agreement was drawn up contemplating disposal at Kirby<br />
Canyon, it does contain provisions for Waste Management to direct the <strong>City</strong>’s waste<br />
elsewhere under specified conditions.<br />
In 1991 Sunnyvale, Mountain View and Palo Alto selected the Kirby Canyon Landfill,<br />
operated by Waste Management <strong>of</strong> California and located in south San Jose, as their site<br />
for long term garbage disposal. These three “SMaRT Station” cities, combined, are the<br />
largest single customer at Kirby Canyon. Identifiable contributors <strong>of</strong> the waste, such as<br />
large industrial generators located in Sunnyvale, can also be named directly in cleanup<br />
actions. As a result, these generators tend to share the <strong>City</strong>’s concern about the integrity<br />
<strong>of</strong> disposal sites. The cities cooperated in the construction and now the operation <strong>of</strong> the<br />
SMaRT Station pursuant to the 1992 Second Memorandum <strong>of</strong> Understanding (MOU).<br />
The MOU spells out each city’s operational and financial obligations and benefits with<br />
regard to the facility. It places Sunnyvale at the center <strong>of</strong> the relationship as owner and<br />
operator <strong>of</strong> the SMaRT Station.<br />
See Goal em-13 (recycling<br />
and source reduction<br />
programs) for discussion <strong>of</strong><br />
household hazardous Waste<br />
collection.<br />
7–39
<strong>City</strong> <strong>of</strong> Sunnyvale GeneRal plan – July <strong>2011</strong><br />
7–40<br />
The agreement with Waste Management allows the landfill operator to increase <strong>City</strong><br />
costs due to regulatory changes. Depending on the type <strong>of</strong> regulation, these cost increases<br />
could apply to incoming solid waste as well as “in place” solid waste disposed in prior<br />
years. Reducing the amount <strong>of</strong> solid waste for which the <strong>City</strong> is responsible in landfills<br />
in the future may be the most cost-effective way to manage the cost <strong>of</strong> complying with<br />
future environmental regulations.<br />
The <strong>City</strong>’s decision to enter into a long-term disposal contract with Waste Management<br />
was driven in part by the technical qualifications <strong>of</strong> that company, its proactive<br />
approach to regulatory compliance and its practice <strong>of</strong> keeping up with rapidly changing<br />
requirements and standards for landfill construction, operation and monitoring. <strong>City</strong><br />
staff conducts an annual review and assessment <strong>of</strong> regulatory documents for Kirby<br />
Canyon to verify that the site continues to be operated in a way that minimizes future<br />
<strong>City</strong> liabilities. Future city decisions and policies that affect where Sunnyvale wastes<br />
(hazardous and non-hazardous alike) are disposed should likewise consider not just the<br />
immediate cost <strong>of</strong> disposal, but also the potential for long-term environmental cleanup<br />
liabilities.<br />
Planning for future Disposal<br />
The fact that Sunnyvale has landfill disposal capacity under contract until 2021<br />
should not lead to complacency. There were 16 years between the designation <strong>of</strong> the<br />
SMaRT Station site as suitable for a transfer station and the date the facility was ready<br />
for operation. It should be assumed that acquiring new disposal capacity will take a<br />
minimum <strong>of</strong> five years—possibly longer if coordination with other cities is required.<br />
Thus, the <strong>City</strong> should begin the process <strong>of</strong> arranging for post-2021 disposal no later<br />
than 2016. The time prior to 2016 should be used to determine a Zero Waste Strategic<br />
Plan and investigate potential technologies, partnerships and funding issues, all <strong>of</strong><br />
which will affect the amount and type <strong>of</strong> disposal capacity required post-2021.<br />
As 2021 approaches, the <strong>City</strong> should begin developing its strategy for future transfer and<br />
disposal methods, locations and partnerships. This process must be well under way no<br />
later than 2016, five years prior to the expiration <strong>of</strong> the current disposal agreement in<br />
order to assure an orderly transition to post-2021 disposal options consistent with the<br />
Zero Waste Strategic Plan.<br />
policy em-15.1 ASSuRe ThAT The CiTY PoSSeSSeS A MiniMuM oF Five<br />
YeARS oF ReFuSe diSPoSAl CAPACiTY AT All TiMeS. (Previously Solid Waste<br />
Policy 3.2D.1)
enviRonmental manaGement — solid waste Chapter 7<br />
n EM-15.1a When available disposal capacity equals 10 years or less, initiate actions<br />
to arrange for sufficient capacity to accommodate present and projected <strong>City</strong> needs.<br />
(Previously Solid Waste Action Statement 3.2D.1b)<br />
policy em-15.2 ReduCe The AMounT oF ReFuSe being diSPoSed,<br />
geneRATe ReCYCling RevenueS, And MiniMize TRuCk TRAvel To The<br />
diSPoSAl SiTe ThRough uSe oF The SunnYvAle MATeRiAlS ReCoveRY<br />
And TRAnSFeR (SMART) STATion. (Previously Solid Waste Policy 3.2D.2)<br />
7–41
appendix a<br />
implementation<br />
plans<br />
A series <strong>of</strong> programs, ordinances, plans and requirements implement<br />
the goals and policies <strong>of</strong> the General Plan. Implementation plans can be<br />
categorized broadly as:<br />
n <strong>City</strong> regulations such as ordinances, specific plans and<br />
subdivision requirements.<br />
n Capital projects<br />
n Building and Housing codes<br />
n Transportation System Management<br />
n Funding mechanisms, including preferential property tax<br />
assessments, bonds, mitigation fees and other methods.<br />
Implementation programs are divided into <strong>City</strong>wide Programs and<br />
programs that are specific to a topic. In certain cases, a brief explanation is<br />
provided describing the implementation plan.
<strong>City</strong> <strong>of</strong> Sunnyvale GeneRal plan – July <strong>2011</strong><br />
the Web version <strong>of</strong> this plan<br />
provides hyperlinks with all<br />
italicized resources.<br />
A–2<br />
<strong>City</strong>Wide iMpleMentation proGraMS<br />
Annual Budget<br />
Appropriating funds to achieve policy objectives and service delivery<br />
<strong>City</strong> Operating Procedures<br />
Staff training<br />
Provision <strong>of</strong> appropriate work areas and equipment for job duties<br />
Coordination with other departments in providing efficient and effective services<br />
Timely review and monitoring <strong>of</strong> data measuring job efficiency and effectiveness<br />
Provision <strong>of</strong> <strong>City</strong> services<br />
Enforcement <strong>of</strong> all applicable regulations and laws<br />
Capital Improvement Program<br />
Grant funding<br />
Apply for grants as appropriate<br />
Work with other agencies or public/private partnerships to receive and implement<br />
grant funds<br />
Public Education and Outreach<br />
Appropriate and effective notification<br />
Provide written materials or presentations to the community on topics <strong>of</strong> interest<br />
Keep all printed and web materials updated<br />
Provide helpful and efficient customer service<br />
Provide opportunities for community involvement where appropriate<br />
Public/Private Partnerships<br />
Coordinate with and/or provide assistance to private entities to achieve <strong>City</strong> goals<br />
and policies or achieve compliance with federal, state and local laws<br />
Intergovernmental Coordination and/or Advocacy<br />
Monitoring federal and state legislation<br />
Agreements or policy coordination with federal, state or local agencies to effectively<br />
address issues affecting the <strong>City</strong>.<br />
Advocacy and/or partnerships with local, regional, state or federal agencies on<br />
affected issues.<br />
Development Review<br />
Review <strong>of</strong> development proposals for compliance with General Plan goals and policies<br />
and applicable regulations and design guidelines.<br />
Environmental analysis in compliance with CEQA<br />
Associated public hearings and opportunities for public comment<br />
Construction and subdivision permitting with review for all applicable standards<br />
and laws.
Chapters 1 And 2 — Introduction and Community Vision<br />
None<br />
Chapter 3 — Land Use And Transportation<br />
Land Use<br />
Community Development Strategy, 2003<br />
Title 19 Zoning Ordinance<br />
Title 18 Subdivision Ordinance<br />
Specific/Precise Plans<br />
M<strong>of</strong>fett Park Specific Plan<br />
El Camino Real Precise Plan<br />
Downtown Specific Plan<br />
Lakeside Specific Plan<br />
Southern Pacific Corridor Site Specific Plan<br />
Lockheed Master Use Permit<br />
Arques Site Specific Plan<br />
Transportation<br />
Bicycle Plan and Bicycle Capital Improvements Program<br />
Pedestrian Safety and Opportunities Study<br />
Congestion Management Program (CMP) run by the Valley Transportation Agency<br />
Transportation Strategic Plan (funded by Transportation Impact Fees required by<br />
SMC 3.5)<br />
<strong>City</strong>wide Deficiency Plan<br />
Title 10 Vehicles and Traffic Ordinance<br />
Title 13 Streets and Sidewalk Ordinance<br />
Open Space<br />
Parks <strong>of</strong> the Future<br />
Park Design and Development Guidelines (Adopted by Council July 2009)<br />
Joint Use <strong>of</strong> School Open Space (Council Policy)<br />
Park Dedication Ordinances in Title 19 (Rental) and Title 18 (Ownership).<br />
implementation plans appendix a<br />
A–3
<strong>City</strong> <strong>of</strong> Sunnyvale GeneRal plan – July <strong>2011</strong><br />
A–4<br />
Chapter 4 — Community Character<br />
Design<br />
Art<br />
Chapter 19.52 Artwork in Private Development<br />
Council Policy 6.4.4 Art in Public Construction Projects<br />
Trees, Landscaping and Buffers<br />
Section 13.16 <strong>City</strong> Tree Ordinance<br />
Urban Forestry Management Plan (in process, Council review May <strong>2011</strong><br />
Chapter 19.94 Tree Preservation<br />
Chapter 19.37 Landscaping, Irrigation and Useable Open Space<br />
Downtown<br />
Downtown Specific Plan<br />
Overhead Utilities, Fences and Signs<br />
Section 19.44 Signs<br />
Section 19.48 Fences<br />
Section 19.38.090 Undergrounding Utilities<br />
Design Guidelines and Screening<br />
<strong>City</strong>-Wide Design Guidelines<br />
Industrial Design Guidelines<br />
Single Family Home Design Techniques<br />
Eichler Design Guidelines<br />
Section 19.38.020 Screening <strong>of</strong> Equipment<br />
heritage Preservation<br />
SMC 19.96 Heritage Preservation<br />
Taaffe Frances Heritage Neighborhood Design Guidelines<br />
Murphy Avenue Design Guidelines<br />
Use <strong>of</strong> Sidewalk on 100 Block <strong>of</strong> South Murphy Avenue (Council Policy)<br />
Library<br />
Library <strong>of</strong> the Future<br />
Chapter 5 — housing Element<br />
Housing Element<br />
Consolidated Plan (for Community Services and Housing) 2010-2015<br />
Community Development Strategy (economic policies)<br />
SMC 19.22 Housing Mitigation Fees<br />
Housing Programs
Chapter 6 — Safety And health/Noise<br />
hazards And Disaster Preparedness And Response<br />
Emergency Plans<br />
<strong>City</strong> Emergency Plan<br />
Local Annex to the ABAG Hazard Mitigation Plan (approved by FEMA)<br />
Emergency Volunteer Plan<br />
Project ARK<br />
Safe Construction<br />
Title 16 Buildings and Construction Ordinance<br />
2007 California Building, Mechanical, Plumbing, Electrical and Fire Codes<br />
2006 international Property Maintenance Code<br />
Flood Insurance Study and Flood Insurance Rate Map, <strong>City</strong> <strong>of</strong> Sunnyvale California<br />
(2009)<br />
Flood Plain Management Practices set forth by FEMA and Army Corps <strong>of</strong> Engineers.<br />
Hazardous Materials<br />
Title 20 Hazardous Material Ordinance<br />
Section 16.53 Toxic Gas Ordinance<br />
Household Hazardous Material Element (Solid Waste Division)<br />
Title 8 Health and Sanitation Ordinance<br />
Police, fire and Emergency Services<br />
Title 9 Public Peace, Safety or Welfare Ordinance<br />
Noise<br />
State <strong>of</strong> California Noise Insulation Requirements (Title 24)<br />
California Penal Code, Section 415(2) — Disturbance noise<br />
Section 9.40.160(c) Facilities and Operation Requirements<br />
Title 9 Public Peace, Safety or Welfare Ordinance<br />
Section 16.08.030 Hours <strong>of</strong> construction — Time and noise limitations<br />
Section 6.16.015(c) Nuisances by Animals<br />
State Vehicle Code — motor vehicle noise regulations<br />
Section 19.42.030 Noise or Sound Level<br />
Section 19.54.050 Operation and Maintenance Standards (Telecommunications)<br />
Chapter 9.48 Loudspeakers<br />
implementation plans appendix a<br />
A–5
<strong>City</strong> <strong>of</strong> Sunnyvale GeneRal plan – July <strong>2011</strong><br />
A–6<br />
Chapter 7 — Environmental Management<br />
Water Supply<br />
Title 12 Water and Sewers Ordinance<br />
Sunnyvale Urban Water Management Plan (UWMP, state-mandated)<br />
Recycled Water Master Plan (<strong>2011</strong>)<br />
Sunnyvale Water Conservation Plan<br />
Wastewater and Urban Run<strong>of</strong>f<br />
Strategic Infrastructure Plan (SIP) for the Water Pollution Control Plant<br />
South Bay Salt Pond Restoration Project<br />
San Francisco Bay Conservation District — SF Bay Plan<br />
Santa Clara Valley Urban Run<strong>of</strong>f Pollution Prevention (SCVURPP)<br />
NPDES Stormwater Discharge Permits<br />
Title 12 Water and Sewers Ordinance<br />
Solid Waste<br />
Section 19.38.030 Recycling and Solid Waste Enclosures<br />
Chapter 8.16 (Solid Waste Management and Recycling)<br />
Non-Disposal Facility Element (County)<br />
Zero-Waste Plan (<strong>City</strong>wide — in process) / Council Policy 3.2.4 Zero Waste<br />
SRRE/HHWE (Source Reduction and Recycling Element and Household Hazardous<br />
Waste Element state-mandated by AB 939)
appendix b<br />
GlossaRy
<strong>City</strong> <strong>of</strong> Sunnyvale GeneRal plan – July <strong>2011</strong><br />
B–2<br />
Affiliated volunteers: attached to a recognized voluntary organization and are trained<br />
for specific disaster response activities. Their relationship with the organization precedes<br />
the immediate disaster, and they are invited by that organization to become involved<br />
in a particular aspect <strong>of</strong> emergency management. An example <strong>of</strong> affiliated volunteers<br />
is Sunnyvale Amateur Radio Emergency Services (SARES). (See also Unaffiliated<br />
Volunteers)<br />
Ambient Noise: a relatively steady background noise which is an accumulation <strong>of</strong><br />
different noise sources near and far. Most ambient noise in Sunnyvale is related to<br />
transportation. Other ambient noise sources include wind and chirping birds.<br />
Articulation: Variations in the depth <strong>of</strong> building plane which break up monotonous<br />
walls and create interesting patterns <strong>of</strong> light and shadow.<br />
Beneficial Uses: The uses <strong>of</strong> water <strong>of</strong> the State <strong>of</strong> California that are protected against<br />
degradation. Examples <strong>of</strong> beneficial uses include, but are not limited to: domestic,<br />
municipal, agricultural and industrial water supply; power generation; recreation;<br />
aesthetic enjoyment; navigation; and preservation <strong>of</strong> fish and wildlife and other aquatic<br />
resources or preserves.<br />
Below Market Rate housing Unit: Any housing specifically priced to be sold or rented<br />
to low or moderate-income households for less than the fair-market value <strong>of</strong> the unit.<br />
Includes financing <strong>of</strong> housing at less than prevailing interest rates. See also Low-income<br />
Household, Moderate-income Household, and Very-low income Household.<br />
Character: Special physical characteristics <strong>of</strong> a structure or rarea that set it apart from<br />
its surrounding and contribute to its individuality.<br />
Certified Unified Program Agency (CUPA): A certification awarded by the California<br />
Environmental Protection Agency that allows the <strong>City</strong> to implement several important<br />
State environmental programs locally<br />
Congestion Management Program (CMP): A state-mandated program that requires<br />
each county to prepare a plan to relieve congestion and air pollution.<br />
Design Guidelines: Design guidelines are more limited and would generally not affect<br />
land use or building regulations.<br />
Density Bonus: The allocation <strong>of</strong> development rights that allow a parcel to accommodate<br />
additional square footage or additional residential units beyond the maximum for<br />
which the parcel is zoned, usually in exchange fro the provision or preservation <strong>of</strong> an<br />
amenity at the same site or at another location.
Districts: special areas within a city which have a unique and unified character. Most<br />
districts share a predominantly homogenous form <strong>of</strong> horizontal structures and relatively<br />
similar building styles.<br />
freeboard: a vertical distance, or clearance, from a 1 percent flood incident. Standards<br />
set by the FEMA and the Army Corp <strong>of</strong> Engineers call for a minimum three foot<br />
freeboard.<br />
Gateways: Gateways are specific places along a boundary where people enter and leave<br />
the <strong>City</strong>.<br />
heritage Resource: A natural or human-made object <strong>of</strong> scientific, aesthetic,<br />
educational, political, social, cultural, architectural or historical significance to the<br />
citizens <strong>of</strong> the city, the Santa Clara Valley region, the state, or the nation, which are<br />
designated and determined to be appropriate for preservation by the city council. See<br />
SMC Title 19 for a complete definition.<br />
heritage housing District: A zoning overlay which can be added to a residential<br />
zoning district to inform the community <strong>of</strong> the presence <strong>of</strong> a Heritage Housing District<br />
Inundation: Flooding caused by water topping a dam or water released by a dam,<br />
reservoir, levee or other break.<br />
Infrastructure: Public services and facilities, including schools, roads, communications<br />
systems, utilities, etc. (See also Lifelines)<br />
Impervious Surfaces: Constructed or modified surfaces that do not effectively allow<br />
infiltration <strong>of</strong> rainfall into the soil below. Impervious surfaces include, but are not<br />
limited to building ro<strong>of</strong>tops, asphalt or concrete pavement, sidewalks, and driveways<br />
where such surfaces are not constructed with pervious materials. (See also Pervious<br />
Surface)<br />
Land Use Operational Noise: a continuous or frequent noise related to the basic use<br />
<strong>of</strong> property. Examples include air conditioners, pool pumps, restaurant loudspeakers<br />
and industrial machinery<br />
Lifelines: Essential services that are necessary for the continued functioning <strong>of</strong> the<br />
community following a disaster. They include utilities (gas, electricity, water, sewer, and<br />
communications), <strong>City</strong> streets, major highways, bridges and railways lines. Information<br />
on age, service, condition and location help emergency preparedness planners assess the<br />
likelihood <strong>of</strong> failure.<br />
GlossaRy appendix B<br />
B–3
<strong>City</strong> <strong>of</strong> Sunnyvale GeneRal plan – July <strong>2011</strong><br />
B–4<br />
Local Landmark: A heritage resource which is significant in that the resource materially<br />
benefits the historical character <strong>of</strong> a neighborhood or area, or the resource in its location<br />
represents an established and familiar visual feature <strong>of</strong> the community or city, and has<br />
been designated and determined to be appropriate for preservation by the city council.<br />
See SMC Title 19 for a complete definition.<br />
Low-income household: a household with an annual income usually not greater than<br />
80 percent <strong>of</strong> the area median income for a household <strong>of</strong> four persons.<br />
Maximum Extent Practicable: A standard for implementation <strong>of</strong> stormwater<br />
management programs under the Clean Water Act to reduce the level <strong>of</strong> the pollutants<br />
in stormwater run<strong>of</strong>f to the maximum extent possible, taking into account equitable<br />
considerations and competing facts including, but not limited to the seriousness <strong>of</strong> the<br />
problem, public health risks, environmental benefits, pollutant removal effectiveness,<br />
regulatory compliance, cost, and technical feasibility.<br />
Moderate-income household: A household with an annual income between the<br />
lower income eligibility limits (usually 80 percent <strong>of</strong> the area median family income)<br />
and 120 percent <strong>of</strong> the area median family income.<br />
Nodes: Junctions where roadways or other pathways intersect and there is a crossing or<br />
convergence <strong>of</strong> paths.<br />
Noise: Unwanted sound. See also Land Use Operational Noise, Single-Event Noise, and<br />
Ambient Noise.<br />
One Percent flood: Also known as a 100 year flood, has a one percent probability to<br />
being equaled or exceeded in any given year.<br />
Pervious Surfaces: May include natural or designed landscapes or specially constructed<br />
paving materials (e.g. pervious paving) that allow stormwater to infiltrate into subsurface<br />
soils.<br />
Scale: the relative relationship in size <strong>of</strong> buildings and other objects to one another.<br />
Seiche: wave generated in an enclosed body <strong>of</strong> water<br />
Sensitive Receptors: Sensitive populations such as children, athletes, elderly and the<br />
sick that are more susceptible to the effects <strong>of</strong> air pollution than the population at large.<br />
Single-Event Noise: An unusual, occasional or temporary noise. Examples include<br />
barking dogs, construction work, deliveries, and organized athletic, musical or other<br />
group events.
Specific Plans: Has development standards like a Zoning District, but also includes<br />
design features which strengthen the district identity. Specific plans can identify<br />
appropriate uses, set regulations for building height, setbacks or floor area ratios and<br />
establish landscaping standards, architectural design standards, unique street lighting,<br />
public plazas and special signage.<br />
Sphere <strong>of</strong> Influence: The probable ultimate physical boundaries and service area <strong>of</strong> a<br />
local agency (city or district) as determined by the Local Agency Formation Commission<br />
<strong>of</strong> the County.<br />
Subsidence: Subsidence is the motion <strong>of</strong> a surface (usually, the Earth’s surface) as it<br />
shifts downward relative to a fixed point such as sea-level. The opposite <strong>of</strong> subsidence is<br />
uplift, which results in an increase in elevation. Subsidence can occur when too much<br />
groundwater is pumped out, causing the land above to sink.<br />
Tsunami: A series <strong>of</strong> waves caused by the sudden shift or subsidence <strong>of</strong> the sea floor<br />
which accompanies some earthquakes. They are characterized by great speed and may<br />
cause considerable damage along an exposed coast thousands <strong>of</strong> miles from the source.<br />
Transportation Demand Management (TDM): Strategies that reduce travel demand<br />
such as telecommuting, teleshopping, flextime, carpooling, increased use <strong>of</strong> public<br />
transit, and other strategies to reduce the number <strong>of</strong> trips made in single-occupant<br />
vehicles.<br />
Unaffiliated volunteers: Not part <strong>of</strong> a recognized voluntary agency and <strong>of</strong>ten have<br />
no formal training in emergency response. They are not <strong>of</strong>ficially invited to become<br />
involved but are motivated by a sudden desire to help others in times <strong>of</strong> trouble. They<br />
come with a variety <strong>of</strong> skills. They may come from within the affected area or from<br />
outside the area. (See also Affiliated Volunteers)<br />
Visual Landmarks: Visually prominent and outstanding structures or natural features<br />
that function as points <strong>of</strong> orientation and identification for individuals and areas <strong>of</strong> the<br />
<strong>City</strong>.<br />
Very-Low Income household: A household with an annual income usually no greater<br />
than 50 percent <strong>of</strong> the area median family income. (See also Low and Moderate Income<br />
Households)<br />
Zoning: The division <strong>of</strong> a city or county by legislative regulations into areas, or zones,<br />
which specify allowable uses for real property and size restrictions for buildings within<br />
these areas. It is a program that implements the General Plan.<br />
GlossaRy appendix B<br />
B–5
<strong>City</strong> <strong>of</strong> Sunnyvale GeneRal plan – July <strong>2011</strong><br />
B–6
appendix c<br />
index
<strong>City</strong> <strong>of</strong> Sunnyvale GeneRal plan – July <strong>2011</strong><br />
c–2<br />
a<br />
affordable housing 2–19, 2–28, 2–32, 2–37, 5–3,<br />
5–4, 5–5, 5–6, 5–7, 5–9, 5–10, 5–18.<br />
airports 2–17, 6–40.<br />
Air quality 2–26.<br />
architecture 2–12, 2–36, 3–14, 4–3, 4–13.<br />
art 2–24, 2–41, 4–1, 4–3, 4–8, 4–9, 4–25, 4–26,<br />
4–27, 4–29, 6–24.<br />
aviation 3–7, 6–3, 6–13, 6–40.<br />
B<br />
Balanced Growth Pr<strong>of</strong>ile iv, 2–45, 2–47, 2–48.<br />
baylands 2–17.<br />
bike 2–21, 2–22, 3–34, 4–30, 5–21.<br />
c<br />
child care 3–18, 6–36.<br />
circulation 1-3, 3–14.<br />
community design 2–45, 7–28.<br />
Crime iv, 2–23, 6–10, 6–19, 6–22. See Police.<br />
D<br />
Dams 6–6.<br />
day care 3–17, 3–18, 6–17. See child care.<br />
demographics 2–5.<br />
design guidelines 3–10, 3–14, 4–5, 4–12, 4–13,<br />
A–2.<br />
Disaster Preparedness And Response A–5.<br />
Downtown 2–15, 2–22, 2–28, 2–32, 2–34,<br />
2–35, 2–38, 2–44, 2–45, 3–8, 3–17, 3–23, 3–33,<br />
3–34, 4–5, 4–13, 5–11, 5–14, 5–15, 5–16, 6–41,<br />
A–3, A–4.<br />
e<br />
earthquakes 6–3, 6–8, 6–9, 6–10, B–5.<br />
economic development 2–35, 2–45, 3–22, 3–23,<br />
4–13, 4–18.<br />
Emergency Services ii, 1-4, 6–15, 6–16, 6–18,<br />
A–5, B–2.<br />
Employment iv, 2–7, 2–11, 2–14, 2–30.<br />
Ethnicity iv, 2–9, 2–10.<br />
f<br />
Fire Services 6–12, 6–23, 6–24, 6–25, 6–26, D–2.<br />
flooding 2–26, 6–4, 6–6, 6–8, 6–9, 6–16,<br />
7–20, 7–21.<br />
G<br />
global warming 6–9, 6–10.<br />
growth projections 2–45, 7–15.<br />
H<br />
hazardous materials 6–3, 6–11, 6–12,<br />
6–25, 7–36.<br />
Hazardous Waste 7–34, 7–36, 7–39, A–6.<br />
Hazards ii, 1-4, 6–1, 6–3, 6–4, 6–5, 6–7, 6–9,<br />
6–10, 6–11, 6–12, 6–13, 6–14, 6–15, 6–16, 6–17,<br />
6–23, 6–25, 7–8, A–5.<br />
Heritage Preservation ii, ii, 1-4, 4–1, 4–17, 4–18,<br />
4–19, 4–20, 4–21, 4–22, A–4, D–2.<br />
Heritage Resources 4–17, 4–19.<br />
Historic Preservation. See Heritage Preservation.<br />
history 1-3, 2–4, 2–10, 2–49, 4–21, 7–35.<br />
housing 1-3, 1-5, 2–4, 2–7, 2–12, 2–17, 2–18,<br />
2–19, 2–21, 2–28, 2–30, 2–31, 2–32, 2–34, 2–35,<br />
2–37, 2–40, 2–44, 3–3, 3–4, 3–6, 3–11, 3–12,<br />
3–13, 3–23, 3–24, 3–25, 3–33, 5–2, 5–3, 5–4,<br />
5–5, 5–6, 5–7, 5–8, 5–9, 5–10, 5–11, 5–12,<br />
5–13, 5–14, 5–15, 5–16, 5–17, 5–18, 5–19, 5–20,<br />
5–21, 6–3, 6–23, 6–33, 7–29, 7–30, B–2.<br />
i<br />
industrial uses 2–4, 3–16, 3–25, 6–37, 7–29.<br />
J<br />
jobs 2–4, 2–6, 2–8, 2–11, 2–12, 2–14, 2–21, 2–28,<br />
2–29, 2–30, 2–31, 2–35, 2–38, 2–44, 2–47, 3–6,<br />
3–13, 3–23, 3–24, 5–21, 7–29.<br />
l<br />
landscaping 3–16, 3–35, 4–4, 4–5, 4–10, 4–11,<br />
4–12, 4–13, 4–18, 5–12, 5–20, 6–35, 7–6, 7–11,<br />
7–21, B–5.<br />
land use 1-3, 1-5, 2–17, 2–29, 2–35, 2–37, 3–1,<br />
3–3, 3–4, 3–5, 3–6, 3–10, 3–11, 3–13, 3–19,<br />
3–22, 3–23, 3–24, 4–5, 5–3, 5–10, 5–11, 5–13,<br />
5–21, 6–1, 6–3, 6–13, 6–28, 6–32, 6–33, 6–35,<br />
6–36, 6–38, 7–1, 7–15, 7–18, 7–21, 7–27, 7–28,<br />
7–29, 7–30, B–2.<br />
law enforcement. See Police.<br />
levee 6–4, 6–6, 6–8, 6–14, B–3.<br />
Library ii, ii, 1-4, 2–24, 2–25, 2–38, 4–1, 4–3,<br />
4–14, 4–22, 4–23, 4–24, 6–4, A–4, D–2.<br />
local landmarks 4–17.<br />
m<br />
mass transit 2–39, 3–6, 4–10, 5–15. See transportation.<br />
mixed use 2–35, 3–10, 3–19, 5–13, 5–15, 5–16.<br />
mobile home parks 5–9, 5–10, 6–41.<br />
n<br />
neighborhoods 2–22, 2–28, 2–29, 2–35, 2–45,<br />
3–7, 3–10, 3–12, 3–13, 3–14, 3–15, 3–17, 4–3,<br />
4–5, 4–7, 4–11, 4–19, 4–21, 4–29, 5–8, 5–9,<br />
5–15, 5–16, 5–19, 5–20, 5–21, 6–10, 6–15, 6–19,<br />
6–22, 6–35, 6–37, 7–32.<br />
noise 1-3, 3–7, 4–11, 6–1, 6–3, 6–5, 6–7, 6–9,<br />
6–11, 6–12, 6–13, 6–15, 6–17, 6–19, 6–21, 6–23,<br />
6–25, 6–27, 6–28, 6–29, 6–30, 6–31, 6–32, 6–33,<br />
6–34, 6–35, 6–36, 6–37, 6–38, 6–39, 6–40,<br />
6–41, 6–42, 6–43, 7–32, A–5, B–2, B–3, B–4.
o<br />
open space 1-3, 2–24, 2–36, 3–1, 3–10, 3–18,<br />
3–27, 3–29, 3–31, 3–33, 3–34, 3–35, 3–36, 3–37,<br />
3–38, 3–39, 4–28, 4–30, 4–32, 4–33, 4–34,<br />
5–12, 5–19, 5–20, 7–38.<br />
p<br />
parking 2–22, 2–27, 3–17, 3–19, 3–20, 4–13,<br />
4–18, 5–11, 5–12, 5–13, 5–20, 6–35, 7–21, 7–31.<br />
Parks. See open space.<br />
pedestrian 2–21, 2–22, 2–24, 2–26, 2–34, 3–14,<br />
3–15, 3–17, 3–19, 3–20, 3–21, 3–37, 4–10, 4–16,<br />
5–15, 5–21, 7–31.<br />
Police ii, 1-4, 6–1, 6–18, 6–19, 6–21, 6–22, 6–23,<br />
6–25, 6–27, A–5.<br />
police services 4–7, 6–21, 6–22, 6–23.<br />
population 1-5, 2–3, 2–4, 2–5, 2–6, 2–8, 2–9,<br />
2–10, 2–28, 2–29, 2–30, 2–31, 2–33, 2–34, 2–35,<br />
2–37, 2–38, 2–39, 2–41, 2–45, 2–47, 2–48,<br />
2–49, 3–12, 3–29, 3–31, 3–35, 4–21, 4–24,<br />
4–28, 5–11, 6–19, 6–27, 6–28, 7–28, 7–30, 7–34,<br />
B–4.<br />
public facilities 2–35, 3–25, 4–1, 4–14, 4–16.<br />
r<br />
recreation 2–24, 2–25, 2–26, 2–32, 2–36, 2–38,<br />
3–17, 3–27, 3–33, 3–34, 3–35, 3–37, 3–39, 4–1,<br />
4–14, 4–28, 4–29, 4–30, 4–31, 4–33, 4–34,<br />
6–32, 7–23, 7–38, B–2.<br />
recycled water 2–26, 2–27, 2–32, 7–3, 7–5, 7–6,<br />
7–8, 7–9, 7–10, 7–12, 7–16, 7–18, 7–20.<br />
recycling 2–27, 2–36, 7–1, 7–8, 7–16, 7–34, 7–35,<br />
7–37, 7–38, 7–39, 7–41.<br />
Residential uses. See housing.<br />
retail uses 2–31, 4–18.<br />
run<strong>of</strong>f. See Urban Run<strong>of</strong>f.<br />
s<br />
San Francisco Bay v, 2–3, 2–17, 2–22, 2–24,<br />
2–26, 2–27, 4–4, 4–5, 6–3, 6–4, 6–5, 6–6, 6–10,<br />
7–14, 7–15, 7–16, 7–20, 7–21, 7–22, 7–23, A–6.<br />
See also baylands.<br />
schools 2–4, 2–23, 2–24, 2–37, 2–47, 3–18, 3–29,<br />
4–22, 4–32, 4–33, 4–34, 6–10, 6–15, 6–17,<br />
6–19, 6–22, 6–23, 7–27, 7–32, B–3.<br />
sea level rise 6–9.<br />
Sewer. See wastewater treatment.<br />
Shopping Centers iv, 2–16.<br />
signs 2–27, 4–3, 4–5, 4–11, 4–12, 4–14, 4–16,<br />
4–24, 5–8, 6–15.<br />
SMaRT Station 2–26, 4–9, 4–14, 7–33, 7–34,<br />
7–35, 7–39, 7–40.<br />
solid waste 2–26, 2–27, 2–39, 4–7, 7–32, 7–33,<br />
7–34, 7–35, 7–36, 7–37, 7–39, 7–40.<br />
specific plans 1-7, 3–23, A–1.<br />
sphere <strong>of</strong> influence 1-5, 1-6, 3–7, 6–36.<br />
storm drains 6–4, 6–6, 7–15, 7–22, 7–26.<br />
street trees. See trees.<br />
Surface run<strong>of</strong>f. See Urban Run<strong>of</strong>f.<br />
t<br />
traffic. See transportation.<br />
transit. See transportation.<br />
transportation 1-3, 1-4, 1-5, 2–3, 2–17, 2–21,<br />
2–28, 2–31, 2–34, 2–35, 2–36, 2–39, 2–48, 3–1,<br />
3–3, 3–4, 3–5, 3–6, 3–10, 3–13, 3–14, 3–16,<br />
3–18, 3–19, 3–20, 3–21, 3–22, 3–23, 3–24,<br />
4–10, 5–19, 5–20, 5–21, 6–1, 6–3, 6–14, 6–28,<br />
6–29, 6–35, 6–36, 6–37, 6–42, 7–1, 7–28, 7–29,<br />
7–30, 7–31, B–2.<br />
trees 2–36, 3–36, 4–10, 4–17, 4–18, 4–19.<br />
Tsunamis 6–8.<br />
U<br />
undergrounding 4–11, 6–14.<br />
Urban Run<strong>of</strong>f iii, 1-4, 7–1, 7–20, 7–21, 7–22,<br />
7–23, 7–25, 7–27, A–6.<br />
utilities 1-3, 1-4, 2–31, 2–47, 4–10, 4–11, 6–13,<br />
6–14, 7–11, B–3.<br />
v<br />
Visual Landmarks B–5.<br />
W<br />
Wastewater Collection and Treatment iii, 1-4,<br />
7–1, 7–14.<br />
wastewater treatment 3–6, 7–16, 7–18.<br />
water conservation 2–27, 2–32, 7–1, 7–3, 7–9,<br />
7–10, 7–11.<br />
water distribution 2–39, 5–12, 7–11.<br />
Water Pollution Control Plant iii, 2–26, 2–32,<br />
4–14, 6–13, 6–14, 7–1, 7–3, 7–6, 7–14, 7–15,<br />
7–16, 7–17, 7–18, 7–19, A–6.<br />
water quality 2–26, 7–1, 7–6, 7–8, 7–12, 7–13,<br />
7–18, 7–20, 7–21, 7–22.<br />
water supply 2–17, 2–32, 6–6, 7–3, 7–5, 7–6,<br />
7–8, 7–9, 7–11, 7–23, B–2.<br />
wetlands. See baylands.<br />
WPCP. See Water Pollution Control Plant.<br />
Z<br />
Zero-Waste. See recycling.<br />
zoning 2–19, 3–12, 3–23, 4–5, 4–12, 4–18,<br />
4–19, 5–4, 5–9, 5–10, 5–11, 5–13, 5–14, 5–15,<br />
5–16, B–3.<br />
index appendix C<br />
c–3
<strong>City</strong> <strong>of</strong> Sunnyvale GeneRal plan – July <strong>2011</strong><br />
c–4
appendix d<br />
list <strong>of</strong> adoptinG<br />
Resolutions
<strong>City</strong> <strong>of</strong> Sunnyvale GeneRal plan – July <strong>2011</strong><br />
d–2<br />
<strong>2011</strong> adoptinG reSolution
Resolution no. 492-11 appendix d<br />
d–3
<strong>City</strong> <strong>of</strong> Sunnyvale GeneRal plan – July <strong>2011</strong><br />
d–4<br />
<strong>GENERAL</strong> <strong>PLAN</strong> — LIST Of ORIG<strong>IN</strong>AL ADOPT<strong>IN</strong>G RESOLUTIONS<br />
Sub-Elements Resolution Number Date Adopted<br />
Air Quality 166-93 1993<br />
Arts 193-95 1995<br />
Community design 223-90 1990<br />
Community engagement 299-07 2007<br />
Community vision 273-07 2007<br />
Fire Services 132-95 1995<br />
heritage Preservation 233-95 1995<br />
housing & Community Revitalization 402-09 2009<br />
land use & Transportation 181-97 1997<br />
law enforcement 105-95 1995<br />
library 110-03 2003<br />
noise 119-97 1997<br />
open Space & Recreation 201-06 2006<br />
Safety & Seismic Safety 327-08 2008<br />
Socio-economic none 1989<br />
Solid waste Management 139-96 1996<br />
Support Services 129-88 1988<br />
Surface Run<strong>of</strong>f 115-93 1993<br />
wastewater Management 220-01 2001<br />
water Resources 359-08 2008
appendix e, f, G and h<br />
Available on the Web at GeneralPlan.inSunnyvale.com or at <strong>City</strong> Hall,<br />
Community Development Department at 456 W. Olive Avenue.
<strong>City</strong> <strong>of</strong> Sunnyvale GeneRal plan – July <strong>2011</strong><br />
d–6