
You also want an ePaper? Increase the reach of your titles
YUMPU automatically turns print PDFs into web optimized ePapers that Google loves.
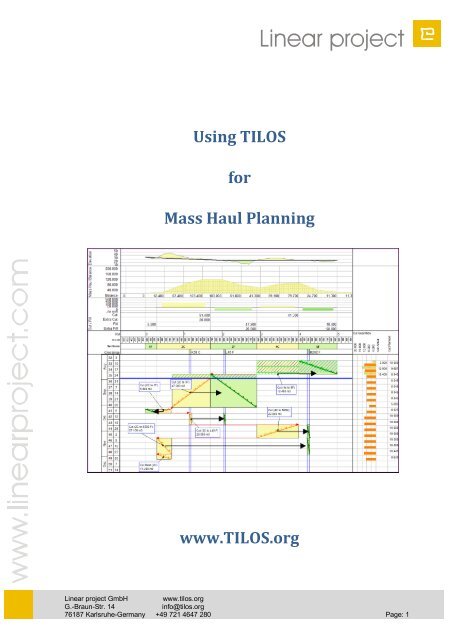
Using TILOS<br />
for<br />
<strong>Mass</strong> <strong>Haul</strong> <strong>Planning</strong><br />
www.TILOS.org<br />
<strong>Linear</strong> <strong>project</strong> <strong>GmbH</strong> www.tilos.org<br />
G.-Braun-Str. 14 info@tilos.org<br />
76187 Karlsruhe-Germany +49 721 4647 280 Page: 1
Table of content<br />
1 Overview ............................................................................................................ 3<br />
2 <strong>Mass</strong> <strong>Haul</strong> Analysis ............................................................................................ 3<br />
2.1 Quantities ........................................................................................................... 3<br />
2.2 Annotating the distance axis ............................................................................... 4<br />
2.3 Cut and fill sections ............................................................................................ 5<br />
2.4 Land and Road Profile Diagram .......................................................................... 5<br />
2.5 <strong>Mass</strong> <strong>Haul</strong> Balance Curve .................................................................................. 6<br />
2.6 Cut and fill diagram............................................................................................. 6<br />
3 <strong>Planning</strong> <strong>Mass</strong> <strong>Haul</strong> transportation ..................................................................... 7<br />
3.1 <strong>Planning</strong> Cut and Fill .......................................................................................... 7<br />
3.2 <strong>Planning</strong> Work Rate and Performance ................................................................ 9<br />
3.3 Resource planning............................................................................................ 10<br />
4 Progress and Performance ............................................................................... 11<br />
4.1 Saving planning data (Creating a Baseline) ...................................................... 11<br />
4.2 Example 1: Report progress (15.08.2010)......................................................... 11<br />
4.3 Example 2: Progress Report date (29.08.2010) ................................................ 12<br />
5 Summary .......................................................................................................... 13<br />
<strong>Linear</strong> <strong>project</strong> <strong>GmbH</strong> www.tilos.org<br />
G.-Braun-Str. 14 info@tilos.org<br />
76187 Karlsruhe-Germany +49 721 4647 280 Page: 2
1 Overview<br />
The objective of the mass haul approach is to develop an understanding of the mass balance<br />
(cut and fill quantities) of material along a <strong>project</strong> ROW (right-of-way).<br />
The results of the engineering providing elevation of land and quantities a mass haul plan can<br />
be developed for effective <strong>project</strong> execution.<br />
This paper describes a method to monitor, plan and control soil movements on a sample road<br />
construction site using TILOS. The methodology is presented with detailed diagrams to<br />
illustrate, how the mass haul planning can be much simpler. The application of actual<br />
progress data against baseline and rescheduling results is also presented.<br />
2 <strong>Mass</strong> <strong>Haul</strong> Analysis<br />
2.1 Quantities<br />
It is assumed that the quantity data is available in an Excel table with the following fields:<br />
Station point The distance coordinate of each point along the road allowance.<br />
Land Elevation of Land at given point<br />
Road Elevation of the road at given point<br />
Cut Cut quantities on the main line of the road from previous station point to<br />
this station point.<br />
Cut Extra Cut in side areas (Crossing)<br />
Fill Fill quantities on the main line of the road from previous points to this<br />
point.<br />
Fill Extra Fill in side areas (Crossing)<br />
As a first step of planning, this table is imported into TILOS. The TILOS import algorithm is<br />
very flexible and provides the user with up to 10 user-defined fields for different mass haul<br />
quantities.<br />
The import can be done by copying the data to the clipboard from any application, assuming<br />
that each line contains the data for one station and the fields are separated by tab character.<br />
A mapping table allows the user to control the import but also the display inside TILOS with<br />
user defined names taken from the column Header of the import.<br />
<strong>Linear</strong> <strong>project</strong> <strong>GmbH</strong> www.tilos.org<br />
G.-Braun-Str. 14 info@tilos.org<br />
76187 Karlsruhe-Germany +49 721 4647 280 Page: 3
2.2 Annotating the distance axis<br />
For a better understanding of a time distance diagram, a site plan is always added on top or<br />
on the bottom of the plan. This can be created inside TILOS using symbols from the symbol<br />
library or a by importing a graphic file.<br />
Our <strong>project</strong> is a road <strong>project</strong> from station 0 to station 5000 (total length of 5 km) and has 3<br />
crossings. The drawing is constructed by using the internal drawing features of TILOS with<br />
predefined symbols. This allows a better scaling and clipping then using just a picture.<br />
<strong>Linear</strong> <strong>project</strong> <strong>GmbH</strong> www.tilos.org<br />
G.-Braun-Str. 14 info@tilos.org<br />
76187 Karlsruhe-Germany +49 721 4647 280 Page: 4
2.3 Cut and fill sections<br />
In the distance scale there are 2 additional scales to show the cut and fill sections with the<br />
appropriate annotation showing the section numbers.<br />
The upper displays the sections on the main line. This table will be used later to define the<br />
graphs and to generate section based quantities. This can be imported as well, but also edited<br />
in TILOS directly.<br />
The lower scale displays the special locations for cut and fill.<br />
2.4 Land and Road Profile Diagram<br />
Using the imported data, an elevation diagram can be generated, showing the land height and<br />
the road height.<br />
Using the option “fill between the lines”, cut and fill areas can be highlighted.<br />
<strong>Linear</strong> <strong>project</strong> <strong>GmbH</strong> www.tilos.org<br />
G.-Braun-Str. 14 info@tilos.org<br />
76187 Karlsruhe-Germany +49 721 4647 280 Page: 5
2.5 <strong>Mass</strong> <strong>Haul</strong> Balance Curve<br />
This graph displays the quantities for all 4 imported values (Cut main, Cut Extra, Fill main, Fill<br />
Extra) summed from left to right. In the last value column the totals can be seen.<br />
Grouping this data we can get a balance curve for the mass haul which is the difference<br />
between cut and fill.<br />
The following diagram displays the mass balance curve for this <strong>project</strong>.<br />
This mass balance diagram, based on 500 m segments, displays the balance between cut and<br />
fill. In total, there is 11 300 m3 more cut than fill. Greater resolution can be realised by defining<br />
smaller segments for analysis in TILOS.<br />
2.6 Cut and fill diagram<br />
This diagram displays the cut and the fill values as a histogram. From the import these values<br />
are defined for every 100 m section. Here they get sliced by the free defined cut and fill<br />
section table. Cut is shown as a stacked histogram: the yellow part is showing the values<br />
along the ROW, the gold is showing the quantities in side areas. Fill is displayed under the<br />
zero-line. This allows an easy identification of cut and fill.<br />
<strong>Linear</strong> <strong>project</strong> <strong>GmbH</strong> www.tilos.org<br />
G.-Braun-Str. 14 info@tilos.org<br />
76187 Karlsruhe-Germany +49 721 4647 280 Page: 6
3 <strong>Planning</strong> <strong>Mass</strong> <strong>Haul</strong> transportation<br />
3.1 <strong>Planning</strong> Cut and Fill<br />
The mass haul is always planned by creating 2 tasks: a cut and a fill task.<br />
The cut task is represented by a rectangle around the main task line. The annotation displays<br />
the quantity that is planned. The annotation is user defined, so further values can be added<br />
like work rates and resource values.<br />
Preformatted tasks with colors and annotation can be stored in the library, so creating a new<br />
task is simply drawing this on screen and entering the quantity. If the whole quantity is planned<br />
for removal in a section, then whole profile value can be applied directly. This means:<br />
Changing the tasks coordinates also changes the quantity for the task - as the calculation<br />
takes all quantities from the profile between the start and end point.<br />
The fill task is created in the same way, but then defined as a hammock task. This has two<br />
advantages: The cut quantity is delivered to the fill task and also the time is synchronized.<br />
To assist the planner, two further diagrams can be generated:<br />
The cut planned diagram is showing the quantity for the cut areas, which is already planned.<br />
While all previously described diagrams are generated from the profiles, this diagram is<br />
generated from tasks. The task quantity value is analyzed and a filter has been set, to show<br />
only evaluate only cut tasks. (This diagram is not shown in the following picture).<br />
The remaining cut diagram is displaying the amount of cut, which has not been planned yet in<br />
each section. This is defined as difference between the total quantity from the profiles and the<br />
cut planned diagram.<br />
The following picture displays the remaining quantity in cut and fill, which still needs to be<br />
planned after planning the first activity.<br />
<strong>Linear</strong> <strong>project</strong> <strong>GmbH</strong> www.tilos.org<br />
G.-Braun-Str. 14 info@tilos.org<br />
76187 Karlsruhe-Germany +49 721 4647 280 Page: 7
From the 114 400 m3 in zone 2 (300 to 1700), 47 200 have already been planned, so the<br />
graph displays remaining 64 200.<br />
Total Quantities<br />
Remaining Quantities<br />
Not planned<br />
As more tasks are planned, the remaining quantity in each section is reduced until 0. After the<br />
last tasks have been planned, the quantity in the remaining diagram should be 0.<br />
All quantities planned<br />
<strong>Linear</strong> <strong>project</strong> <strong>GmbH</strong> www.tilos.org<br />
G.-Braun-Str. 14 info@tilos.org<br />
76187 Karlsruhe-Germany +49 721 4647 280 Page: 8
3.2 <strong>Planning</strong> Work Rate and Performance<br />
One of the excellences of TILOS is the task calculation. For each task the quantity sets the<br />
amount of work. The work rate describes the performance: how many units can be done in a<br />
time unit. The duration of a task is calculated by Quantity / Work rate.<br />
The quantity can be entered by the user directly, but also calculated based on site parameters<br />
or other tasks. In our case, we can link the quantity to profile and TILOS calculates the<br />
quantity automatically: It considers the start and end location of the tasks and takes the<br />
quantity from the profile between this 2 values. If the task is moved or the length is changed,<br />
then the quantity is updated and the duration as well.<br />
The work rate can be entered by the user, but also be taken from the resources assigned to<br />
this task as driving resources. If in a cut task, the driving resource is the excavator, then<br />
TILOS can calculate the number of truck needed to transport the material to the fill area.<br />
Based on the work rate of the exactor, the number of trucks is updated.<br />
The histogram on the right side displays the cut quantities on a weekly base, but also as an S-<br />
Curve.<br />
<strong>Linear</strong> <strong>project</strong> <strong>GmbH</strong> www.tilos.org<br />
G.-Braun-Str. 14 info@tilos.org<br />
76187 Karlsruhe-Germany +49 721 4647 280 Page: 9
3.3 Resource planning<br />
In TILOS, each task can have one or more resources (with cost) assigned. There are different<br />
types of resources: Permanent resources to model labor and machines, consumable<br />
resources to model material or complex resources, which can be a collection of consumable<br />
and permanent resources (e.g. an excavator can have already an operator, fuel consumption<br />
or special buckets assigned).<br />
Based on the allocation of resources to each task the resource, special diagrams and lists can<br />
be generated.<br />
The most important diagram for permanent resources is the Resource Usage Bar Chart. It<br />
enables the user to show the number of needed resources. Each resource represents one bar<br />
line and the colors indicate the number of units needed.<br />
<strong>Linear</strong> <strong>project</strong> <strong>GmbH</strong> www.tilos.org<br />
G.-Braun-Str. 14 info@tilos.org<br />
76187 Karlsruhe-Germany +49 721 4647 280 Page: 10
4 Progress and Performance<br />
4.1 Saving planning data (Creating a Baseline)<br />
TILOS provides the flexibility to create as many baselines as required for the <strong>project</strong>. To<br />
create a baseline in TILOS simply select the baseline tab in the sub<strong>project</strong> definition area and<br />
add a new baseline. TILOS provides an option to add all tasks or a subset of the tasks to a<br />
baseline. When you create a baseline the start date, end date and quantities of each task is<br />
stored (histogram data is converted to a time profile and stored as the planned quantity per<br />
week). Once you have defined a baseline you can then measure progress against the plan,<br />
essential for <strong>project</strong> control and EVM (Earned Value Management).<br />
Each diagram prepared as time or distance based diagram can be stored inside TILOS as<br />
well. Just export this data to the clipboard, create a new time profile and import the data from<br />
clipboard.<br />
4.2 Example 1: Report progress (15.08.2010)<br />
The following chapter describes the work performed until the 15.08.2010.<br />
The blue horizontal line in the following diagram is the data date or the report date (the date of<br />
the most recent progress). The weekly actual quantities for the cut activities are entered for<br />
each task as reported from the site.<br />
In the following sample a progress of 3 000 m3 has been achieved in the first week. The task<br />
is selected and the progress is entered. As the fill task in section 5F is a hammock, this is also<br />
progressed by the same amount automatically.<br />
Progress: 3000 m3<br />
In the following diagram the quantity histogram has been enhanced to show the planned<br />
versus actual quantities per week.<br />
<strong>Linear</strong> <strong>project</strong> <strong>GmbH</strong> www.tilos.org<br />
G.-Braun-Str. 14 info@tilos.org<br />
76187 Karlsruhe-Germany +49 721 4647 280 Page: 11
The situation: The actual productivity (work rate) has been well below the planned. The<br />
planned quantity was 10 000 m 3 while only 3 000 m 3 have been achieved. The planned work<br />
rate was 2000 m 3 /day while the actual was 600 m 3 /day.<br />
In the following week, 12 000 m 3 of material is moved.<br />
4.3 Example 2: Progress Report date (29.08.2010)<br />
In week 3 there was work on 2 tasks and in total 10 400 m 3 were achieved.<br />
The remaining 3 400 m 3 in section 4c and 7 000 in section 2C were moved.<br />
Planned progress versus<br />
actual progress per time<br />
In Total there has been 27 100 planned and 25 400 achieved. This is displayed by the Scurves.<br />
Total quantity versus<br />
performed quantity<br />
The distance diagrams has been enhanced and display the quantity planned against the<br />
quantity performed for each location section, for cut and fill.<br />
<strong>Linear</strong> <strong>project</strong> <strong>GmbH</strong> www.tilos.org<br />
G.-Braun-Str. 14 info@tilos.org<br />
76187 Karlsruhe-Germany +49 721 4647 280 Page: 12
5 Summary<br />
Using the quantities from the Excel import provides more precision when planning <strong>Mass</strong> <strong>Haul</strong><br />
and enables a straight forward planning without any side calculations.<br />
TILOS displays how much material (either in yd 3 or m 3 ) has to be moved and where the cut<br />
and fill areas are located. During planning the quantity histograms automatically reflect the<br />
changes when adding new tasks.<br />
<strong>Mass</strong> haul planning is easier in TILOS with cut and fill set up as twin tasks. Only the cut needs<br />
to be planned as the correct fill quantities are calculated automatically.<br />
During the execution of the <strong>project</strong>, the achieved quantities are surveyed – this is leading to a<br />
direct comparison of planned and performed figures. This comparison is essential for good<br />
<strong>project</strong> control and EVM.<br />
<strong>Linear</strong> <strong>project</strong> <strong>GmbH</strong> www.tilos.org<br />
G.-Braun-Str. 14 info@tilos.org<br />
76187 Karlsruhe-Germany +49 721 4647 280 Page: 13