Download this pdf file - Linear project GmbH
Download this pdf file - Linear project GmbH
Download this pdf file - Linear project GmbH

You also want an ePaper? Increase the reach of your titles
YUMPU automatically turns print PDFs into web optimized ePapers that Google loves.
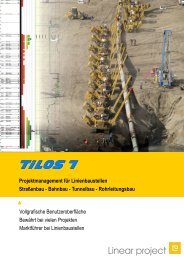
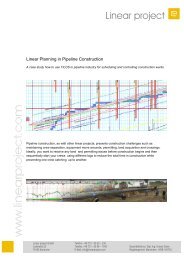
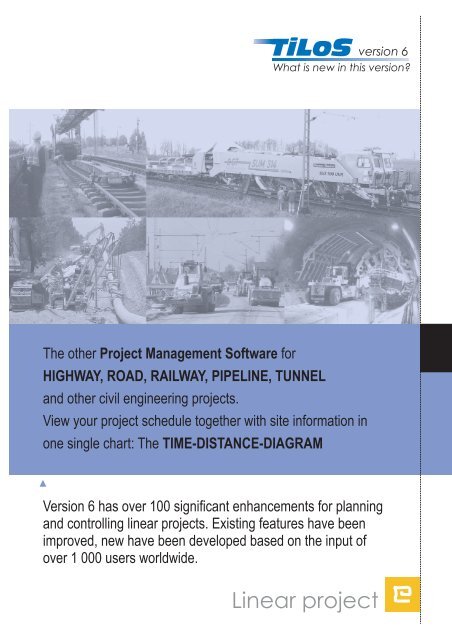
The other Project Management Software for<br />
HIGHWAY, ROAD, RAILWAY, PIPELINE, TUNNEL<br />
and other civil engineering <strong>project</strong>s.<br />
version 6<br />
What is new in <strong>this</strong> version?<br />
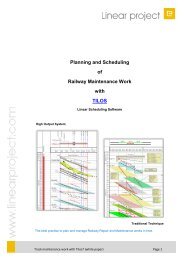
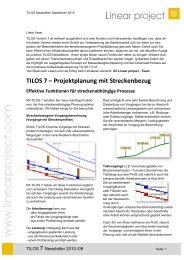
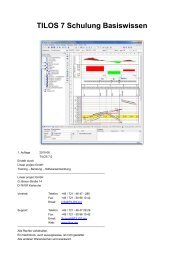
View your <strong>project</strong> schedule together with site information in<br />
one single chart: The<br />
TIME-DISTANCE-DIAGRAM<br />
Version 6 has over 100 significant enhancements for planning<br />
and controlling linear <strong>project</strong>s. Existing features have been<br />
improved, new have been developed based on the input of<br />
over 1 000 users worldwide.<br />
<strong>Linear</strong> <strong>project</strong>
Free formatting of each tasks independent from<br />
library data supports direct planning on screen:<br />
Ready formatted tasks or task groups can be<br />
saved as template for re-usage.<br />
Enhanced copy and batch edit functions reduce<br />
your effort for creating and updating plans.<br />
Enhance user interface, such as task tool-tips,<br />
the context sensitive online-help or the new<br />
explorer interface ease the start up of TILOS in<br />
your organisation significant.<br />
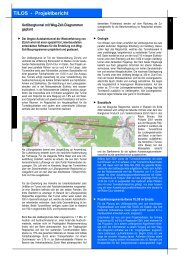
Distance pro<strong>file</strong>s<br />
Pro<strong>file</strong>s reduce the number of tasks needed your schedule<br />
extremely, as with a single task you can reflect changing<br />
conditions in the field and parallel work can be<br />
synchronised.<br />
version 6<br />
What is new in <strong>this</strong> version?<br />
Easier to use and yet more powerful<br />
Main focus on development was concentrated on<br />
the user interface in order to reduce the learning<br />
curve for getting started but also for returning to<br />
TILOS after longer work break.<br />
Distance pro<strong>file</strong> are used to describe the site based on<br />
stations numbers with associated texts or numeric data: list of<br />
crossing streets or rivers, altitude or slope pro<strong>file</strong>s, mass haul<br />
quantities, rock classes.<br />
Distance scale: You can generate individual scales showing<br />
and describing important station points.<br />
Grids: You can generate multiple grids based on the station<br />
points including description.<br />
Speed pro<strong>file</strong>: You can modell non linear productivity rates in<br />
different sections of the <strong>project</strong> (slope areas, wetlands, heavy<br />
rock areas or simply a learning curve).<br />
Graphs: You can generate distance related graphs, such as<br />
altitude, slope diagrams or mass haul pro<strong>file</strong>s showing cut and fill<br />
sections. This is ideal base to optimize your schedule, e.g.<br />
regarding transportation costs.<br />
You can use the quantities stored inside the pro<strong>file</strong>s directly in<br />
the task calculation. Thus linear activities get enhanced to curves<br />
showing exactly the progress in the field.<br />
Data import based on Clipboard or via XML data exchange.
Project data can be shown and edited in a new<br />
cell type: The Gantt Chart Cell. The direction of<br />
time axis can be horizontal or vertical, if bar chart<br />
should be printed along with time distance cell.<br />
Free definable filter and sort options individually<br />
for each cell allow to create flexible views to your<br />
<strong>project</strong>.<br />
Grouping allows to order you plan in a free way,<br />
even with multiple bars on the same bar line to<br />
show e.g. repetitive work in different area.<br />
Enhanced progress models<br />
show the as build situation<br />
The new progress model shows exactly the as build<br />
situation to compare it against the original contracted plan.<br />
Changes can easily be identified and used for claim defence.<br />
version 6<br />
What is new in <strong>this</strong> version?<br />
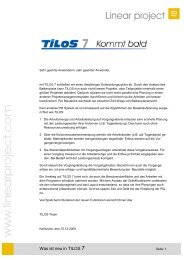
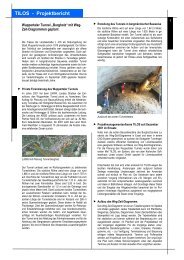
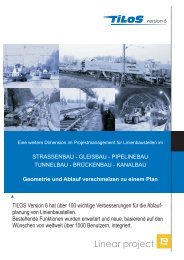
Bar charts and Time distance<br />
diagramm in one view<br />
The entire <strong>project</strong> can now be printed as time<br />
distance diagram, as bar chart or as a combination<br />
of both in a single view. Non linear work or<br />
support services can now be monitored within the<br />
same plan.<br />
Different progress modells have been implemented in order to<br />
have for each way of working the correct methods implemented:<br />
External mode: This method was implemented for working in<br />
combination with other <strong>project</strong> management systems: TILOS<br />
imports actual start dates and progress values. The schedule gets<br />
updated to the actual values and the task lines gets shaded until<br />
progress point. No task splitt is done.<br />
Internal mode: If you report progress directly inside TILOS, <strong>this</strong><br />
can be done in a much more flexible way. It covers changed<br />
working directions, working with multiple crews in different<br />
sections and work breaks. Progress information can be given in<br />
distance data, which part has been worked out and which not.<br />
Analysing progress, TILOS chops tasks based on given<br />
progress in performed and not performed tasks, those gets<br />
analysed in reschedule to calculate the expected <strong>project</strong> end<br />
date.<br />
For the rest work, several assumption are done: Set new work<br />
rates based on past situation, change working direction from past<br />
situation and relink CPM network.<br />
Actuals collected in daily on site work reports can be collected<br />
and analysed for the whole progress period to make a new plan<br />
for the upcoming period.
You can show mass haul quantities as cut and fill<br />
imported from CAD Systems and compare them with<br />
planned or actual values to see progress and what is<br />
left to do (sliced graphs).<br />
You can show graphs with altitude or slope<br />
pro<strong>file</strong>s, speed diagrams, rock classes or whatever<br />
you needed express in your <strong>project</strong> (station point<br />
base graphs).<br />
With resource usage pro<strong>file</strong>s (filtered on finished<br />
tasks) you show what has already been finished in<br />
the <strong>project</strong> and what is left to do. It also shows, which<br />
resources are needed in which section of the <strong>project</strong><br />
(special machines).<br />
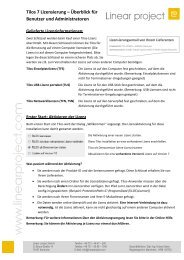
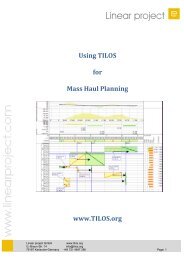
Time based diagrams<br />
Time related diagrams monitor exactly what resources are<br />
used inside the <strong>project</strong> and what is the cost impacts of<br />
these. TILOS is no longer just a scheduling tools, it is a real<br />
production planning software for linear <strong>project</strong>s.<br />
version 6<br />
What is new in <strong>this</strong> version?<br />
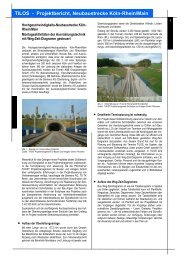
Distance based diagrams<br />
show site information<br />
Distance based diagrams can be generated either form<br />
schedule or from pro<strong>file</strong> data. They can now be generated<br />
directly inside TILOS without the need to import them as<br />
ready pictures. As they update on flight, they support you<br />
during planning phase significantly.<br />
TILOS chart can now contain many single charts. This reduces<br />
the number of cells needed to set up. A chart can be a scale, a<br />
histogram as bar or line chart or a resource usage chart.<br />
Stacking allows to put one value on top of the others to show<br />
total consumption, still separated by colors defined for each<br />
graph.<br />
Grouping allows to compare e.g. expenditure against income<br />
or cut against fill for mass haul tasks. Values can be shown side<br />
by side or balanced.<br />
Text line with values can directly be calculated and printed<br />
along the time axis. Y-xxis scales free, but can be set by user as<br />
well.<br />
Data source can be cost data and resource data from planning<br />
state or from actual data, but also existing pro<strong>file</strong>s can be used.<br />
Individual filters can be assigned to any graph line, showing<br />
specific data from one or many sub <strong>project</strong>s.<br />
Graph data can be exported for further usage into others<br />
software. Export is done to clipboard for direct integration into<br />
Excel.<br />
Graphs can be generated free, but also connected with timedistance<br />
diagrams or bar charts.
Calendar<br />
New calendar interface showing a whole year. Exceptions can<br />
easy be set just by clicking on the day and select the propriate<br />
day type.<br />
Graphic support<br />
Enhanced editor for symbols allows more precise defintion of<br />
symbols, that can also include text annotaions in same way as<br />
for activities containing tokens.<br />
Generate symbols in distance cells based on station point<br />
tables with names of symbols, and distance coordinate, where<br />
the symbol should be placed.<br />
JPG <strong>file</strong>s to import can now be imported, to show pictures or<br />
scans. This will reduce <strong>file</strong> size extremely.<br />
Distance axis definition<br />
Free definition of distance units support both, metric and<br />
imperial formats in the same <strong>project</strong>.<br />
Equations support non linear distance axis definition, like gaps<br />
in the distance axis. Also bypasses can be handled without<br />
renumbering of station points.<br />
version 6<br />
What is new in <strong>this</strong> version?<br />
View<br />
The scale printed on top of the view shows the size of the<br />
output. Sliders allow an easier change of the size of the rows and<br />
the columns. The enhanced view organisation supports now<br />
show and hide columns.<br />
The improved cell management enables you to set cell<br />
content and <strong>project</strong> data in a single tab.<br />
The new view based text fields can be included in plan stamp,<br />
so view independent borders can be created.<br />
The new legend can be setup more flexible and allows also<br />
free entries to make you own symbol legend.<br />
Layer<br />
Layers are now defined on <strong>file</strong> level, but you can switch them<br />
on and off for each call or view individually.<br />
Links assigned to a specific layer can be excluded from<br />
reschedule.<br />
Activities assigned to a specific layer can get their colours<br />
from Layer definition.<br />
Task functions<br />
Duration can now be monitored in free definable working units<br />
with decimals but also calendar based duration calculation is<br />
available.<br />
After you have created a task, you can direct edit the display<br />
attributes to set shape type, colour and line styles.<br />
You can copy attributes from other tasks, such as codes,<br />
annotation and resource data.<br />
For easier data input, a list of station points can be used to<br />
select start and end coordinate for a task.<br />
To document all decision and events related to a task, you can<br />
enter notes for each task and view them in wider <strong>project</strong> context<br />
to get an overview, what happened in the <strong>project</strong>.<br />
Resource planning<br />
You can create now accounts or cost centres in the library and<br />
for assigning them to the task cost and resources records.<br />
For permanent resources you can assign sub resources in the<br />
library, that get also assigned with the main resource. The sub<br />
resource are controlled by the master resource (e.g. Excavator,<br />
gets extra assignment for operator and fuel consumption).<br />
<strong>Linear</strong> <strong>project</strong> <strong>GmbH</strong><br />
G.-Braun-Str. 14 D-76187 Karlsruhe<br />
info@TILOS.org www.TILOS.org