

ANNUAL REPORT - ChartNexus
ANNUAL REPORT - ChartNexus
ANNUAL REPORT - ChartNexus

You also want an ePaper? Increase the reach of your titles
YUMPU automatically turns print PDFs into web optimized ePapers that Google loves.
28<br />
MALAYSIAN AIRLINE SYSTEM BERHAD (10601-W)<br />
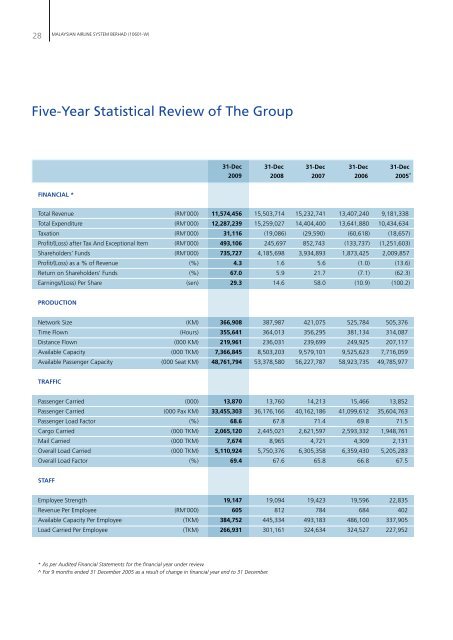
Five-Year Statistical Review of The Group<br />
FINANCIAL *<br />
Total Revenue (RM’000) 11,574,456 15,503,714 15,232,741 13,407,240 9,181,338<br />
Total Expenditure (RM’000) 12,287,239 15,259,027 14,404,400 13,641,880 10,434,634<br />
Taxation (RM’000) 31,116 (19,086) (29,590) (60,618) (18,657)<br />
Profit/(Loss) after Tax And Exceptional Item (RM’000) 493,106 245,697 852,743 (133,737) (1,251,603)<br />
Shareholders’ Funds (RM’000) 735,727 4,185,698 3,934,893 1,873,425 2,009,857<br />
Profit/(Loss) as a % of Revenue (%) 4.3 1.6 5.6 (1.0) (13.6)<br />
Return on Shareholders’ Funds (%) 67.0 5.9 21.7 (7.1) (62.3)<br />
Earnings/(Loss) Per Share (sen) 29.3 14.6 58.0 (10.9) (100.2)<br />
PRODUCTION<br />
Network Size (KM) 366,908 387,987 421,075 525,784 505,376<br />
Time Flown (Hours) 355,641 364,013 356,295 381,134 314,087<br />
Distance Flown (000 KM) 219,961 236,031 239,699 249,925 207,117<br />
Available Capacity (000 TKM) 7,366,845 8,503,203 9,579,101 9,525,623 7,716,059<br />
Available Passenger Capacity (000 Seat KM) 48,761,794 53,378,580 56,227,787 58,923,735 49,785,977<br />
TRAFFIC<br />
Passenger Carried (000) 13,870 13,760 14,213 15,466 13,852<br />
Passenger Carried (000 Pax KM) 33,455,303 36,176,166 40,162,186 41,099,612 35,604,763<br />
Passenger Load Factor (%) 68.6 67.8 71.4 69.8 71.5<br />
Cargo Carried (000 TKM) 2,065,120 2,445,021 2,621,597 2,593,332 1,948,761<br />
Mail Carried (000 TKM) 7,674 8,965 4,721 4,309 2,131<br />
Overall Load Carried (000 TKM) 5,110,924 5,750,376 6,305,358 6,359,430 5,205,283<br />
Overall Load Factor (%) 69.4 67.6 65.8 66.8 67.5<br />
STAFF<br />
31-Dec<br />
Employee Strength 19,147 19,094 19,423 19,596 22,835<br />
Revenue Per Employee (RM’000) 605 812 784 684 402<br />
Available Capacity Per Employee (TKM) 384,752 445,334 493,183 486,100 337,905<br />
Load Carried Per Employee (TKM) 266,931 301,161 324,634 324,527 227,952<br />
2009<br />
* As per Audited Financial Statements for the financial year under review.<br />
^ For 9 months ended 31 December 2005 as a result of change in financial year end to 31 December.<br />
31-Dec<br />
2008<br />
31-Dec<br />
2007<br />
31-Dec<br />
2006<br />
31-Dec<br />
2005 ^


