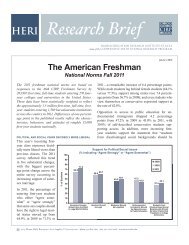
North Dakota University System - Higher Education Research Institute
North Dakota University System - Higher Education Research Institute
North Dakota University System - Higher Education Research Institute

You also want an ePaper? Increase the reach of your titles
YUMPU automatically turns print PDFs into web optimized ePapers that Google loves.
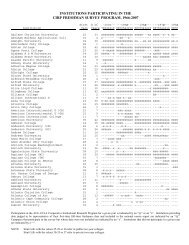
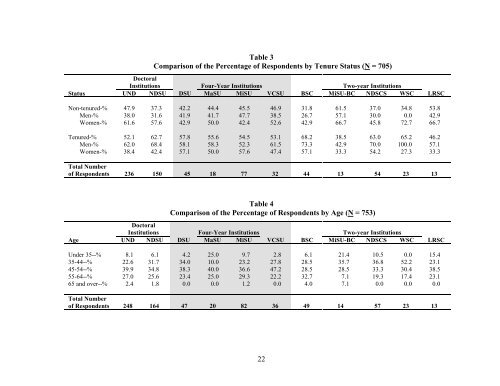
Table 3<br />
Comparison of the Percentage of Respondents by Tenure Status (N = 705)<br />
Doctoral<br />
Institutions Four-Year Institutions Two-year Institutions<br />
Status UND NDSU DSU MaSU MiSU VCSU BSC MiSU-BC NDSCS WSC LRSC<br />
Non-tenured-% 47.9 37.3 42.2 44.4 45.5 46.9 31.8 61.5 37.0 34.8 53.8<br />
Men-% 38.0 31.6 41.9 41.7 47.7 38.5 26.7 57.1 30.0 0.0 42.9<br />
Women-% 61.6 57.6 42.9 50.0 42.4 52.6 42.9 66.7 45.8 72.7 66.7<br />
Tenured-% 52.1 62.7 57.8 55.6 54.5 53.1 68.2 38.5 63.0 65.2 46.2<br />
Men-% 62.0 68.4 58.1 58.3 52.3 61.5 73.3 42.9 70.0 100.0 57.1<br />
Women-% 38.4 42.4 57.1 50.0 57.6 47.4 57.1 33.3 54.2 27.3 33.3<br />
Total Number<br />
of Respondents 236 150 45 18 77 32 44 13 54 23 13<br />
Table 4<br />
Comparison of the Percentage of Respondents by Age (N = 753)<br />
Doctoral<br />
Institutions Four-Year Institutions Two-year Institutions<br />
Age UND NDSU DSU MaSU MiSU VCSU BSC MiSU-BC NDSCS WSC LRSC<br />
Under 35--% 8.1 6.1 4.2 25.0 9.7 2.8 6.1 21.4 10.5 0.0 15.4<br />
35-44--% 22.6 31.7 34.0 10.0 23.2 27.8 28.5 35.7 36.8 52.2 23.1<br />
45-54--% 39.9 34.8 38.3 40.0 36.6 47.2 28.5 28.5 33.3 30.4 38.5<br />
55-64--% 27.0 25.6 23.4 25.0 29.3 22.2 32.7 7.1 19.3 17.4 23.1<br />
65 and over--% 2.4 1.8 0.0 0.0 1.2 0.0 4.0 7.1 0.0 0.0 0.0<br />
Total Number<br />
of Respondents 248 164 47 20 82 36 49 14 57 23 13<br />
22