North Dakota University System - Higher Education Research Institute
North Dakota University System - Higher Education Research Institute
North Dakota University System - Higher Education Research Institute

Create successful ePaper yourself
Turn your PDF publications into a flip-book with our unique Google optimized e-Paper software.
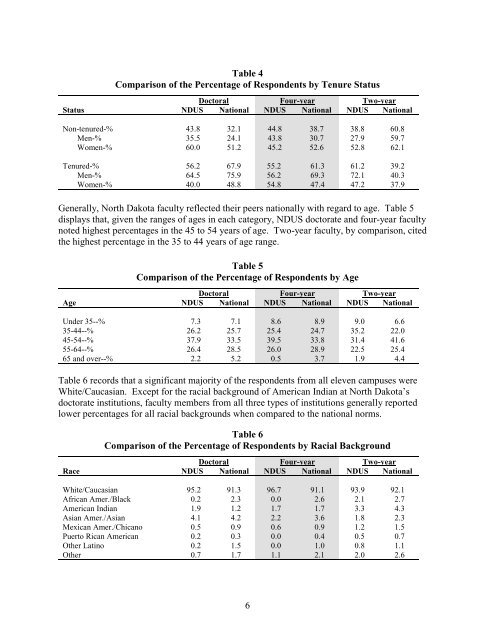
Table 4<br />
Comparison of the Percentage of Respondents by Tenure Status<br />
Doctoral Four-year Two-year<br />
Status NDUS National NDUS National NDUS National<br />
Non-tenured-% 43.8 32.1 44.8 38.7 38.8 60.8<br />
Men-% 35.5 24.1 43.8 30.7 27.9 59.7<br />
Women-% 60.0 51.2 45.2 52.6 52.8 62.1<br />
Tenured-% 56.2 67.9 55.2 61.3 61.2 39.2<br />
Men-% 64.5 75.9 56.2 69.3 72.1 40.3<br />
Women-% 40.0 48.8 54.8 47.4 47.2 37.9<br />
Generally, <strong>North</strong> <strong>Dakota</strong> faculty reflected their peers nationally with regard to age. Table 5<br />
displays that, given the ranges of ages in each category, NDUS doctorate and four-year faculty<br />
noted highest percentages in the 45 to 54 years of age. Two-year faculty, by comparison, cited<br />
the highest percentage in the 35 to 44 years of age range.<br />
Table 5<br />
Comparison of the Percentage of Respondents by Age<br />
Doctoral Four-year Two-year<br />
Age NDUS National NDUS National NDUS National<br />
Under 35--% 7.3 7.1 8.6 8.9 9.0 6.6<br />
35-44--% 26.2 25.7 25.4 24.7 35.2 22.0<br />
45-54--% 37.9 33.5 39.5 33.8 31.4 41.6<br />
55-64--% 26.4 28.5 26.0 28.9 22.5 25.4<br />
65 and over--% 2.2 5.2 0.5 3.7 1.9 4.4<br />
Table 6 records that a significant majority of the respondents from all eleven campuses were<br />
White/Caucasian. Except for the racial background of American Indian at <strong>North</strong> <strong>Dakota</strong>’s<br />
doctorate institutions, faculty members from all three types of institutions generally reported<br />
lower percentages for all racial backgrounds when compared to the national norms.<br />
Table 6<br />
Comparison of the Percentage of Respondents by Racial Background<br />
Doctoral Four-year Two-year<br />
Race NDUS National NDUS National NDUS National<br />
White/Caucasian 95.2 91.3 96.7 91.1 93.9 92.1<br />
African Amer./Black 0.2 2.3 0.0 2.6 2.1 2.7<br />
American Indian 1.9 1.2 1.7 1.7 3.3 4.3<br />
Asian Amer./Asian 4.1 4.2 2.2 3.6 1.8 2.3<br />
Mexican Amer./Chicano 0.5 0.9 0.6 0.9 1.2 1.5<br />
Puerto Rican American 0.2 0.3 0.0 0.4 0.5 0.7<br />
Other Latino 0.2 1.5 0.0 1.0 0.8 1.1<br />
Other 0.7 1.7 1.1 2.1 2.0 2.6<br />
6