North Dakota University System - Higher Education Research Institute
North Dakota University System - Higher Education Research Institute
North Dakota University System - Higher Education Research Institute

You also want an ePaper? Increase the reach of your titles
YUMPU automatically turns print PDFs into web optimized ePapers that Google loves.
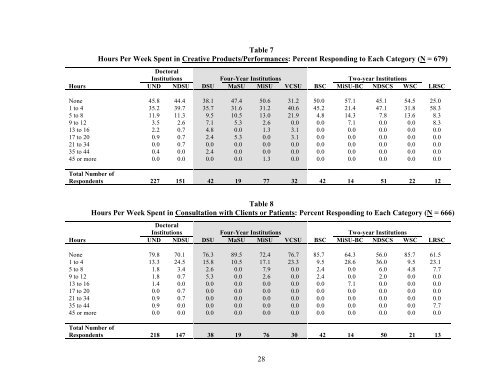
Table 7<br />
Hours Per Week Spent in Creative Products/Performances: Percent Responding to Each Category (N = 679)<br />
Doctoral<br />
Institutions Four-Year Institutions Two-year Institutions<br />
Hours UND NDSU DSU MaSU MiSU VCSU BSC MiSU-BC NDSCS WSC LRSC<br />
None 45.8 44.4 38.1 47.4 50.6 31.2 50.0 57.1 45.1 54.5 25.0<br />
1 to 4 35.2 39.7 35.7 31.6 31.2 40.6 45.2 21.4 47.1 31.8 58.3<br />
5 to 8 11.9 11.3 9.5 10.5 13.0 21.9 4.8 14.3 7.8 13.6 8.3<br />
9 to 12 3.5 2.6 7.1 5.3 2.6 0.0 0.0 7.1 0.0 0.0 8.3<br />
13 to 16 2.2 0.7 4.8 0.0 1.3 3.1 0.0 0.0 0.0 0.0 0.0<br />
17 to 20 0.9 0.7 2.4 5.3 0.0 3.1 0.0 0.0 0.0 0.0 0.0<br />
21 to 34 0.0 0.7 0.0 0.0 0.0 0.0 0.0 0.0 0.0 0.0 0.0<br />
35 to 44 0.4 0.0 2.4 0.0 0.0 0.0 0.0 0.0 0.0 0.0 0.0<br />
45 or more 0.0 0.0 0.0 0.0 1.3 0.0 0.0 0.0 0.0 0.0 0.0<br />
Total Number of<br />
Respondents 227 151 42 19 77 32 42 14 51 22 12<br />
Table 8<br />
Hours Per Week Spent in Consultation with Clients or Patients: Percent Responding to Each Category (N = 666)<br />
Doctoral<br />
Institutions Four-Year Institutions Two-year Institutions<br />
Hours UND NDSU DSU MaSU MiSU VCSU BSC MiSU-BC NDSCS WSC LRSC<br />
None 79.8 70.1 76.3 89.5 72.4 76.7 85.7 64.3 56.0 85.7 61.5<br />
1 to 4 13.3 24.5 15.8 10.5 17.1 23.3 9.5 28.6 36.0 9.5 23.1<br />
5 to 8 1.8 3.4 2.6 0.0 7.9 0.0 2.4 0.0 6.0 4.8 7.7<br />
9 to 12 1.8 0.7 5.3 0.0 2.6 0.0 2.4 0.0 2.0 0.0 0.0<br />
13 to 16 1.4 0.0 0.0 0.0 0.0 0.0 0.0 7.1 0.0 0.0 0.0<br />
17 to 20 0.0 0.7 0.0 0.0 0.0 0.0 0.0 0.0 0.0 0.0 0.0<br />
21 to 34 0.9 0.7 0.0 0.0 0.0 0.0 0.0 0.0 0.0 0.0 0.0<br />
35 to 44 0.9 0.0 0.0 0.0 0.0 0.0 0.0 0.0 0.0 0.0 7.7<br />
45 or more 0.0 0.0 0.0 0.0 0.0 0.0 0.0 0.0 0.0 0.0 0.0<br />
Total Number of<br />
Respondents 218 147 38 19 76 30 42 14 50 21 13<br />
28