UNICEF KENYA COUNTRY OFFICE SUMMARY TABLE ON ...
UNICEF KENYA COUNTRY OFFICE SUMMARY TABLE ON ...
UNICEF KENYA COUNTRY OFFICE SUMMARY TABLE ON ...

Create successful ePaper yourself
Turn your PDF publications into a flip-book with our unique Google optimized e-Paper software.
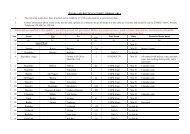
<strong>UNICEF</strong> <strong>KENYA</strong> <strong>COUNTRY</strong> <strong>OFFICE</strong><br />
<strong>SUMMARY</strong> <strong>TABLE</strong> <strong>ON</strong> NUTRITI<strong>ON</strong> SURVEYS<br />
13 December, 2000<br />
Please find below a table summarizing information on nutrition surveys that has been made available to <strong>UNICEF</strong> Health and<br />
Nutrition – Emergency Unit. The table indicates the methodology for survey sampling. The Health and Nutrition sub-unit is striving<br />
towards standardization of methodology within and across districts. To this end there is a guide for training on nutrition surveys<br />
available at <strong>UNICEF</strong> as well as a health and nutrition questionnaire which can be used by any interested agency.<br />
Please note that this table is complied from data available currently to <strong>UNICEF</strong> - we would welcome comments and inputs from<br />
partners in updating the information herein.<br />
DISTRICT DATE ORGANI<br />
ZA-<br />
TI<strong>ON</strong><br />
Turkana March<br />
2000<br />
June<br />
2000<br />
August<br />
2000<br />
LOCATI<strong>ON</strong>S METHOD NO.<br />
SURVEY<br />
-ED<br />
Oxfam Lokituang subdistrict<br />
ANP/UNI<br />
CEF<br />
<strong>UNICEF</strong><br />
and 6<br />
NGOs<br />
2 stage 30x30<br />
cluster sampling<br />
Kerio 1 10 clusters of 30<br />
households to yield<br />
300 households per<br />
division; criteria for<br />
inclusion of a<br />
household – at least<br />
1 child 6-59 months<br />
in the household<br />
Lokichokio<br />
Kakuma &<br />
Oropoi<br />
Two-stage cluster<br />
sampling; 25%<br />
prevalence of<br />
INDICATOR<br />
GLOBAL<br />
MALNUTRITI<br />
<strong>ON</strong> RATE<br />
900 wt/ht 21.3 (z- score) 4.6<br />
422 wt/ht<br />
MUAC<br />
37.2 (z-score)<br />
27.9<br />
599 wt/ht 27.13 (Z-score)<br />
1 This division was chosen for the survey as it was considered, by the District Steering Group, to be the worst-affected.<br />
SEVERE<br />
MALN. RATE<br />
8.5<br />
8.32<br />
1
Marsabit June<br />
2000<br />
June<br />
2000<br />
July<br />
2000<br />
<strong>UNICEF</strong>/<br />
ANP<br />
Lokituang subdistrict<br />
malnutrition<br />
assumed; eroor risk<br />
5%, precision 5%<br />
sample size required<br />
576; 30 clusters<br />
with 20 children in<br />
each<br />
As above 597 Wt/ht 31.37 6.06<br />
Katilu, Kainuk As above 593 Wt/ht 30.50 9.26<br />
Central, Kalokol As above 596 Wt/ht 24.88 4.37<br />
Lokichar, Lokori<br />
& Lomello<br />
Loima,<br />
Turkwell 2<br />
As above 598 Wt/ht 34.46 8.36<br />
As above 498 Wt/ht 46.80 19.47<br />
Loyengalani 3 10 clusters of 30<br />
households to yield<br />
300 households per<br />
division; criteria for<br />
inclusion of a<br />
household – at least<br />
1 child 6-59 months<br />
in the household<br />
Medair North Horr 2 stage 30x30<br />
cluster sampling<br />
Tearfund Maikona central<br />
and Kalacha<br />
Central division<br />
divided into 6 zones<br />
358 Wt/ht<br />
Muac<br />
35.2 (z-score)<br />
35.8<br />
6.7<br />
924 wt/ht 43.5 (z-score) 6.2<br />
836 wt/ht 28.2 (z-score) 3.4<br />
2<br />
The malnutrition levels are extremely high. It is to be noted that the survey was carried out soon after a measles outbreak and there were an unusual number of<br />
sick and malnourished children there at that point.<br />
3<br />
This division was chosen as it was considered, by the District Steering Group, to be the worst affected<br />
2
July/A<br />
ug<br />
Oct.<br />
2000<br />
Oct.<br />
2000<br />
Nov.<br />
2000<br />
Nov.<br />
2000<br />
Moyale June<br />
2000<br />
July<br />
2000<br />
Nov.<br />
2000<br />
+ Kalacha children<br />
assembled in central<br />
place and assessed;<br />
1-day assessment<br />
MoH Laisamis 310 wt/ht 40.0 ?<br />
Medair North Horr 2 stage 30x30<br />
cluster sampling<br />
Medair Loyengalani 2 stage 30x30<br />
cluster sampling<br />
Maikona Tearfund 2 stage 30x30<br />
cluster sampling<br />
924 Wt/ht 30.7 (z-score)<br />
4.9<br />
905 Wt/ht 29.0 3.8<br />
900 Wt/ht (zscores)<br />
FHI/MoH Laisamis Planned survey<br />
<strong>UNICEF</strong>/<br />
ANP<br />
Obbu 4 10 clusters of 30<br />
households to yield<br />
300 households per<br />
division; criteria for<br />
inclusion of a<br />
household – at least<br />
1 child 6-59 months<br />
in the household<br />
374 wt/ht<br />
muac<br />
25.1 3.9<br />
18.7 (z-score)<br />
14.2<br />
Tearfund Sololo 350 wt/ht 17.1 2.3<br />
<strong>UNICEF</strong>/<br />
MoH/<br />
Worl d<br />
Vision<br />
Moyale Two-stage cluster<br />
sampling; 20%<br />
prevalence of<br />
malnutrition<br />
4 This division was chosen as it was considered, by the district steering group, to be the worst affected.<br />
958 Wt/ht (zscores)<br />
5.8<br />
8.1 1.5<br />
3
Mandera Dec<br />
1999<br />
June<br />
2000<br />
June<br />
2000<br />
August<br />
2000<br />
MSF/S Mandera town<br />
and outskirts<br />
MSF/S Mandera town<br />
and outskirts<br />
<strong>UNICEF</strong>/<br />
ANP<br />
Shimbre<br />
Fatuma 5<br />
MDM/F All divisions<br />
listed below –<br />
overall results<br />
assumed; precision<br />
5%, error risk 5%;<br />
sample size required<br />
768; 30 clusters<br />
with 32 sampled to<br />
account for data<br />
rejection during<br />
analysis<br />
10 clusters of 30<br />
households to yield<br />
300 households per<br />
division; criteria for<br />
inclusion of a<br />
household – at least<br />
1 child 6-59 months<br />
in the household<br />
2 stage cluster<br />
sampling for the<br />
five divisions<br />
combined;<br />
prevalence of<br />
malnutriton assumed<br />
21.7%; precision 4%;<br />
however data also<br />
912 Wt/ht 27.0 (z-score) 2.1<br />
918 Wt/ht 20.3 (z-score) 2.2<br />
539 Wt/ht<br />
Muac<br />
5 This division was chosen as it was considered, by the District Steering Group, to be the worst affected.<br />
29.3 (z-score)<br />
23.7<br />
8.6<br />
777 Wt/ht 26.1 (Z-score) 7.1<br />
4
Sept.<br />
2000<br />
Wajir Dec.<br />
1999<br />
<strong>UNICEF</strong>,<br />
MoH and<br />
partners<br />
analyzed per division<br />
Rhamu See above 251 29.1 8.8<br />
Rhamu-Dimtu See above 49 38.8 8.2<br />
El Wak See above 268 22.3 5.6<br />
Ashabito See above 110 23.6 7.3<br />
Lafey See above 98 25.5 6.1<br />
Banisa Two-stage cluster<br />
sampling; 25%<br />
prevalence of<br />
malnutrition<br />
assumed; precision<br />
4%, error risk 5% ;<br />
sample size required<br />
576; 30 clusters<br />
with 20 children in<br />
each<br />
606 Wt/ht 6<br />
26.8 (z-score) 4.6 7<br />
Takaba As above 613 28.3 (z-score) 4.7<br />
Malkamari As above 597 19.93 (z-score) 10.39<br />
Fino As above 557 17.2 (z-score) 3.5<br />
Warankara As above 627 39.6 (z-score) 12.1<br />
Oxfam Wajir town Two stage 30x30<br />
cluster sampling<br />
917 wt/ht 20.0 (z-score) 3.5<br />
July <strong>UNICEF</strong>/ Griftu 8 10 clusters of 30 459 Wt/ht 32.6 (z-score) 7.6<br />
6 In general the malnutrition rates data from Mandera are very high. It is possible that genetically the Somali populations are leaner and thus comparing them to<br />
the NCHS reference standards may not give the ‘true’ picture of malnutrition in these areas. There may an over-estimation of malnutrition. However, the data<br />
from the CBS/<strong>UNICEF</strong> 5 th nutrition survey in 1994 found the GAM (
1999 ANP households to yield<br />
300 households per<br />
division; criteria for<br />
inclusion of a<br />
household – at least<br />
1 child 6-59 months<br />
in the household<br />
Sept.<br />
2000<br />
Oct.<br />
2000<br />
Garissa July<br />
2000<br />
SCF (UK) Wajir central Two stage cluster<br />
sampling;<br />
malnutrition<br />
prevalence assumed<br />
at 24%; 3%<br />
precision; 5% error<br />
risk; required<br />
sample 1560 9<br />
<strong>UNICEF</strong>/<br />
ANP<br />
North/West Two-stage 30X30<br />
cluster sampling<br />
Mogadashe 11 10 clusters of 30<br />
households to yield<br />
300 households per<br />
division; criteria for<br />
inclusion of a<br />
household – at least<br />
1 child 6-59 months<br />
in the household<br />
Muac 19.7<br />
1,553 Wt/ht 22.5 (z-score) 5.0<br />
746 10 Wt/ht<br />
8 This division was chosen as it was considered, by the District Steering Group, to be the worst affected.<br />
9 A total of 25 clusters were completed. Due to insecurity the team could not collect additional data.<br />
10 The survey could not be completed due to insecurity. Data from 25 clusters were collected.<br />
11 This division was chosen as it was considered, by the District Steering Group, to be the worst affected.<br />
21.2 (z-score) 5.8<br />
410 Wt/ht 27.2 (z-score) 6.6<br />
6
Sept.<br />
2000<br />
Baringo July<br />
2000<br />
Sept.<br />
2000<br />
Oct.<br />
2000<br />
Samburu August<br />
2000<br />
CARE/<br />
MoH and<br />
partners<br />
World<br />
Vision<br />
All Garissa –<br />
combined<br />
results<br />
2 stage cluster<br />
sampling;expected<br />
prevalence 27%;<br />
precision 5%; 602<br />
children required<br />
from each zone<br />
1675 12 Wt/ht (zscores)<br />
21.1 8.4<br />
Northern As above 465 Wt/ht 22.7 (z-score) 9.3<br />
Central As above 427 20.7 (z-score) 10.0<br />
Southern<br />
(Ijara)<br />
As above 420 20.8 (z-score) 7.5<br />
6 divisions<br />
chosen to<br />
represent all<br />
agro-ecological<br />
zones<br />
WV Lowland dry<br />
areas<br />
WV Highland areas Two stage cluster<br />
sampling; expected<br />
prevalence 20%,<br />
error risk 5%,<br />
precision 4%;<br />
30clusters with 26<br />
children – sample<br />
size 768 - needed<br />
MSF/F Baragoi Rapid MUAC<br />
assessment<br />
240 wt/ht<br />
33.3 8.0<br />
1011 wt/ht 23.4 (z-score) 5.4<br />
755 Wt/ht (zscore)<br />
8.1 3.1<br />
4,097 MUAC 21.2 1.7<br />
12 Data collection in some parts of Dadaab, Hulugho and Jarajilla was not possible due to inaccessibility, insecurity and movement of nomads. As a result data for<br />
104 children could not be collected. Data was collected on 1702 as opposed to be required 1806 children; analysis included 1675 children.<br />
7
Oct/N<br />
ov<br />
2000<br />
Laikipia Nov.<br />
2000<br />
Makueni July<br />
2000<br />
Kajiado Octob<br />
er<br />
2000<br />
IMC /<br />
MoH and<br />
partners<br />
World<br />
Vision<br />
El Nyiro As above 1,768 MUAC 9.8 0.7<br />
Baragoi and El<br />
Nyiro<br />
Lokorri and<br />
Kirissia<br />
Wamba and<br />
Waso<br />
Mukodogo and<br />
Central<br />
divisions 13<br />
AMREF Greater<br />
Kibwezi area<br />
OCI and<br />
partners,<br />
AMREF<br />
(<strong>UNICEF</strong>)<br />
Msz – kenyasurveys 12/13/00 6:08 PM<br />
Two stage 30x30<br />
cluster sampling<br />
909 Wt/ht (zscores)<br />
As above 909 Wt/ht (zscores)<br />
As above 913 Wt/ht (zscores)<br />
Cluster sampling<br />
method; expected<br />
prevalence 25%,<br />
error risk 5%,<br />
precision 4%; 900<br />
children required;<br />
27 clusters with 24<br />
children in each<br />
surveyed<br />
District-wide Two stage 30x30<br />
cluster sampling<br />
method<br />
903 Wt/ht (zscores)<br />
? ? wt/age 21.1<br />
911 Wt/ht (zscores)<br />
18.3 1.9<br />
27.6 3.7<br />
24.2 3<br />
20.3 6.8<br />
19.6 7.9<br />
13 These divisions were chosen as they are the areas where World Vision has developmental programmes and are distributing general food ration (EMOP).<br />
8