Modelling of Pollutant Transport in the Atmosphere - MANHAZ
Modelling of Pollutant Transport in the Atmosphere - MANHAZ
Modelling of Pollutant Transport in the Atmosphere - MANHAZ

Create successful ePaper yourself
Turn your PDF publications into a flip-book with our unique Google optimized e-Paper software.
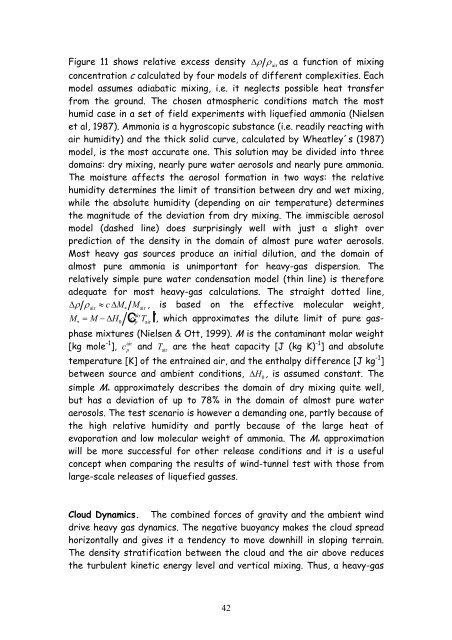
Figure 11 shows relative excess density ∆ρ ρ air as a function <strong>of</strong> mix<strong>in</strong>g<br />
concentration c calculated by four models <strong>of</strong> different complexities. Each<br />
model assumes adiabatic mix<strong>in</strong>g, i.e. it neglects possible heat transfer<br />
from <strong>the</strong> ground. The chosen atmospheric conditions match <strong>the</strong> most<br />
humid case <strong>in</strong> a set <strong>of</strong> field experiments with liquefied ammonia (Nielsen<br />
et al, 1987). Ammonia is a hygroscopic substance (i.e. readily react<strong>in</strong>g with<br />
air humidity) and <strong>the</strong> thick solid curve, calculated by Wheatley´s (1987)<br />
model, is <strong>the</strong> most accurate one. This solution may be divided <strong>in</strong>to three<br />
doma<strong>in</strong>s: dry mix<strong>in</strong>g, nearly pure water aerosols and nearly pure ammonia.<br />
The moisture affects <strong>the</strong> aerosol formation <strong>in</strong> two ways: <strong>the</strong> relative<br />
humidity determ<strong>in</strong>es <strong>the</strong> limit <strong>of</strong> transition between dry and wet mix<strong>in</strong>g,<br />
while <strong>the</strong> absolute humidity (depend<strong>in</strong>g on air temperature) determ<strong>in</strong>es<br />
<strong>the</strong> magnitude <strong>of</strong> <strong>the</strong> deviation from dry mix<strong>in</strong>g. The immiscible aerosol<br />
model (dashed l<strong>in</strong>e) does surpris<strong>in</strong>gly well with just a slight over<br />
prediction <strong>of</strong> <strong>the</strong> density <strong>in</strong> <strong>the</strong> doma<strong>in</strong> <strong>of</strong> almost pure water aerosols.<br />
Most heavy gas sources produce an <strong>in</strong>itial dilution, and <strong>the</strong> doma<strong>in</strong> <strong>of</strong><br />
almost pure ammonia is unimportant for heavy-gas dispersion. The<br />
relatively simple pure water condensation model (th<strong>in</strong> l<strong>in</strong>e) is <strong>the</strong>refore<br />
adequate for most heavy-gas calculations. The straight dotted l<strong>in</strong>e,<br />
∆ρρair ≈ c ∆M∗M<br />
air , is based on <strong>the</strong> effective molecular weight,<br />
air<br />
M∗ = M−∆H0c c p Tairh, which approximates <strong>the</strong> dilute limit <strong>of</strong> pure gasphase<br />
mixtures (Nielsen & Ott, 1999). M is <strong>the</strong> contam<strong>in</strong>ant molar weight<br />
[kg mole -1 air<br />
], cp and<br />
T air are <strong>the</strong> heat capacity [J (kg K) -1 ] and absolute<br />
temperature [K] <strong>of</strong> <strong>the</strong> entra<strong>in</strong>ed air, and <strong>the</strong> enthalpy difference [J kg -1 ]<br />
between source and ambient conditions, ∆H 0 , is assumed constant. The<br />
simple M∗ approximately describes <strong>the</strong> doma<strong>in</strong> <strong>of</strong> dry mix<strong>in</strong>g quite well,<br />
but has a deviation <strong>of</strong> up to 78% <strong>in</strong> <strong>the</strong> doma<strong>in</strong> <strong>of</strong> almost pure water<br />
aerosols. The test scenario is however a demand<strong>in</strong>g one, partly because <strong>of</strong><br />
<strong>the</strong> high relative humidity and partly because <strong>of</strong> <strong>the</strong> large heat <strong>of</strong><br />
evaporation and low molecular weight <strong>of</strong> ammonia. The M∗ approximation<br />
will be more successful for o<strong>the</strong>r release conditions and it is a useful<br />
concept when compar<strong>in</strong>g <strong>the</strong> results <strong>of</strong> w<strong>in</strong>d-tunnel test with those from<br />
large-scale releases <strong>of</strong> liquefied gasses.<br />
Cloud Dynamics. The comb<strong>in</strong>ed forces <strong>of</strong> gravity and <strong>the</strong> ambient w<strong>in</strong>d<br />
drive heavy gas dynamics. The negative buoyancy makes <strong>the</strong> cloud spread<br />
horizontally and gives it a tendency to move downhill <strong>in</strong> slop<strong>in</strong>g terra<strong>in</strong>.<br />
The density stratification between <strong>the</strong> cloud and <strong>the</strong> air above reduces<br />
<strong>the</strong> turbulent k<strong>in</strong>etic energy level and vertical mix<strong>in</strong>g. Thus, a heavy-gas<br />
42