Modelling of Pollutant Transport in the Atmosphere - MANHAZ
Modelling of Pollutant Transport in the Atmosphere - MANHAZ
Modelling of Pollutant Transport in the Atmosphere - MANHAZ

You also want an ePaper? Increase the reach of your titles
YUMPU automatically turns print PDFs into web optimized ePapers that Google loves.
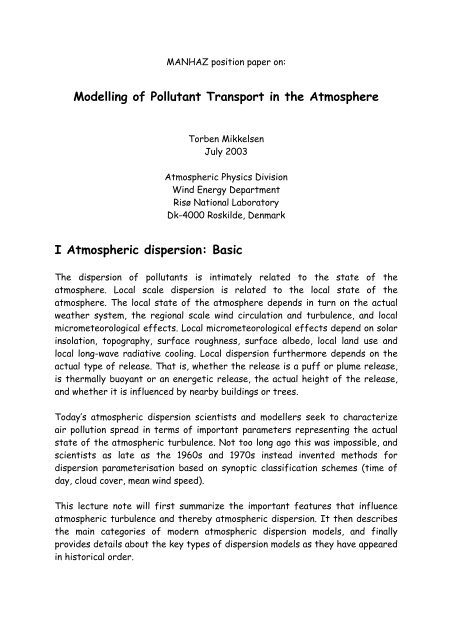
<strong>MANHAZ</strong> position paper on:<br />
<strong>Modell<strong>in</strong>g</strong> <strong>of</strong> <strong>Pollutant</strong> <strong>Transport</strong> <strong>in</strong> <strong>the</strong> <strong>Atmosphere</strong><br />
Torben Mikkelsen<br />
July 2003<br />
Atmospheric Physics Division<br />
W<strong>in</strong>d Energy Department<br />
Risø National Laboratory<br />
Dk-4000 Roskilde, Denmark<br />
I Atmospheric dispersion: Basic<br />
The dispersion <strong>of</strong> pollutants is <strong>in</strong>timately related to <strong>the</strong> state <strong>of</strong> <strong>the</strong><br />
atmosphere. Local scale dispersion is related to <strong>the</strong> local state <strong>of</strong> <strong>the</strong><br />
atmosphere. The local state <strong>of</strong> <strong>the</strong> atmosphere depends <strong>in</strong> turn on <strong>the</strong> actual<br />
wea<strong>the</strong>r system, <strong>the</strong> regional scale w<strong>in</strong>d circulation and turbulence, and local<br />
micrometeorological effects. Local micrometeorological effects depend on solar<br />
<strong>in</strong>solation, topography, surface roughness, surface albedo, local land use and<br />
local long-wave radiative cool<strong>in</strong>g. Local dispersion fur<strong>the</strong>rmore depends on <strong>the</strong><br />
actual type <strong>of</strong> release. That is, whe<strong>the</strong>r <strong>the</strong> release is a puff or plume release,<br />
is <strong>the</strong>rmally buoyant or an energetic release, <strong>the</strong> actual height <strong>of</strong> <strong>the</strong> release,<br />
and whe<strong>the</strong>r it is <strong>in</strong>fluenced by nearby build<strong>in</strong>gs or trees.<br />
Today’s atmospheric dispersion scientists and modellers seek to characterize<br />
air pollution spread <strong>in</strong> terms <strong>of</strong> important parameters represent<strong>in</strong>g <strong>the</strong> actual<br />
state <strong>of</strong> <strong>the</strong> atmospheric turbulence. Not too long ago this was impossible, and<br />
scientists as late as <strong>the</strong> 1960s and 1970s <strong>in</strong>stead <strong>in</strong>vented methods for<br />
dispersion parameterisation based on synoptic classification schemes (time <strong>of</strong><br />
day, cloud cover, mean w<strong>in</strong>d speed).<br />
This lecture note will first summarize <strong>the</strong> important features that <strong>in</strong>fluence<br />
atmospheric turbulence and <strong>the</strong>reby atmospheric dispersion. It <strong>the</strong>n describes<br />
<strong>the</strong> ma<strong>in</strong> categories <strong>of</strong> modern atmospheric dispersion models, and f<strong>in</strong>ally<br />
provides details about <strong>the</strong> key types <strong>of</strong> dispersion models as <strong>the</strong>y have appeared<br />
<strong>in</strong> historical order.
Key Factors Influenc<strong>in</strong>g Atmospheric Dispersion<br />
Introduction<br />
Local heat flux depends on position with respect to <strong>the</strong> sun (season, hour <strong>of</strong> day,<br />
latitude and topography) and <strong>the</strong> local composition <strong>of</strong> <strong>the</strong> atmosphere (clouds).<br />
The temperature depends on <strong>the</strong> heat transfer and heat capacity<br />
characteristics <strong>of</strong> <strong>the</strong> surface (sea, soil, desert, forest, and urban area). The<br />
flows <strong>of</strong> air masses happen <strong>in</strong> contact with a surface that has a heterogeneous<br />
aerodynamic roughness, creat<strong>in</strong>g small-scale turbulence (see Atmospheric<br />
dispersion: Complex terra<strong>in</strong>). Each secondary motion leads to smaller eddies,<br />
ultimately transform<strong>in</strong>g <strong>the</strong> mechanical energy to heat. The result is that at a<br />
given po<strong>in</strong>t, w<strong>in</strong>ds, and turbulence for that matter, result as <strong>the</strong> comb<strong>in</strong>ed<br />
effect due to a series <strong>of</strong> circulations, with dist<strong>in</strong>ct time-scales rang<strong>in</strong>g from<br />
days (general circulation) to seconds (turbulence) (see Figure 1). An additional<br />
complication is <strong>the</strong> rotation <strong>of</strong> <strong>the</strong> earth. A coord<strong>in</strong>ate system, referred to a<br />
fixed po<strong>in</strong>t on earth, rotates with <strong>the</strong> earth dur<strong>in</strong>g <strong>the</strong> transport <strong>of</strong><br />
<strong>the</strong> air masses. The wea<strong>the</strong>rmen on television show daily movies <strong>of</strong> satellite<br />
observations <strong>of</strong> large-scale w<strong>in</strong>d systems and cloud belts that (<strong>in</strong> <strong>the</strong> Nor<strong>the</strong>rn<br />
Hemisphere) are mov<strong>in</strong>g counter-clockwise around <strong>the</strong> low-pressure centres and<br />
clockwise around <strong>the</strong> high-pressure centres (and <strong>the</strong> opposite <strong>in</strong> <strong>the</strong> Sou<strong>the</strong>rn<br />
Hemisphere; see Global circulation).<br />
The Structure <strong>of</strong> <strong>the</strong> <strong>Atmosphere</strong><br />
Approach<strong>in</strong>g <strong>the</strong> earth from outer space one would first enter <strong>the</strong><br />
stratosphere, which extends approximately60 km al<strong>of</strong>t, <strong>the</strong>n, at about 15 km<br />
height; one would reach <strong>the</strong> denser troposphere. The lowest (about 1 km) and<br />
usually most turbulent part <strong>of</strong> <strong>the</strong> troposphere is called <strong>the</strong> atmospheric<br />
boundary layer (ABL). The lowest 100 m approximately <strong>of</strong> <strong>the</strong> boundary layer is<br />
called <strong>the</strong> planetary surface layer<br />
(PSL), and is characterized by its more or less constant exchange fluxes <strong>of</strong> heat<br />
and momentum between <strong>the</strong> earth’s surface and <strong>the</strong> atmosphere.<br />
Stratosphere. From about 15 km height and up <strong>the</strong> air temperature always<br />
<strong>in</strong>creases significantly with height (at a rate <strong>of</strong> approximately +0.5 K per 100<br />
m). This part <strong>of</strong> <strong>the</strong> atmosphere is called <strong>the</strong> stratosphere (because it is stably<br />
stratified), and is extremely stable with hardly any turbulence.<br />
2
Troposphere. Trapped between <strong>the</strong> stratosphere and <strong>the</strong> earth’s surface is<br />
a less stable but denser layer called <strong>the</strong> troposphere. The troposphere extends<br />
from <strong>the</strong> earth’s surface up to about 10–15 km above <strong>the</strong> ground. The<br />
<strong>in</strong>tersection between <strong>the</strong> stratosphere and <strong>the</strong> troposphere is called <strong>the</strong><br />
tropopause. As commonly experienced dur<strong>in</strong>g air flights, <strong>the</strong> part <strong>of</strong> <strong>the</strong><br />
troposphere from 1 to 10 km above ground is usually slightly stably stratified<br />
and <strong>the</strong>refore conta<strong>in</strong>s little or no (small-scale) turbulence. Some 80% <strong>of</strong> <strong>the</strong><br />
earth’s air mass is conta<strong>in</strong>ed with<strong>in</strong> <strong>the</strong> troposphere. Nearer <strong>the</strong> Earth's<br />
surface, however, (say with<strong>in</strong> <strong>the</strong> lowest 1 km <strong>of</strong> <strong>the</strong> atmosphere) <strong>the</strong> usually<br />
stable stratification <strong>of</strong> <strong>the</strong> Troposphere is disturbed by heat and momentum<br />
exchanges exchange with <strong>the</strong> surface <strong>of</strong> <strong>the</strong> Earth. This lowest ~ 1 kilometre <strong>of</strong><br />
<strong>the</strong> Troposphere is called <strong>the</strong> Atmospheric Boundary Layer (ABL)- and is <strong>the</strong><br />
most turbulent, but also most variable part <strong>of</strong> <strong>the</strong> atmosphere. It is <strong>in</strong> this layer<br />
most <strong>of</strong> our daily activities unfold, and it is here most pollutant are emitted and<br />
dispersed.<br />
Figure 1.<br />
Spatial and temporal characteristics <strong>of</strong> <strong>the</strong> atmosphere (after Atk<strong>in</strong>son, 1995)<br />
3
Atmospheric Boundary Layer (ABL)<br />
The ABL characterizes <strong>the</strong> part <strong>of</strong> <strong>the</strong> atmosphere which is <strong>in</strong> direct contact<br />
with <strong>the</strong> Earth's surface, and is <strong>the</strong>refore <strong>of</strong>ten <strong>in</strong> a highly turbulent state. The<br />
depth and character <strong>of</strong> <strong>the</strong> ABL is governed by exchange - via turbulent fluxes -<br />
<strong>of</strong>: 1) heat, 2) moisture and 3) sheer-stress, all three orig<strong>in</strong>at<strong>in</strong>g from <strong>the</strong> air<br />
masses contact with <strong>the</strong> earth's surface. The vertical extent <strong>of</strong> <strong>the</strong>se fluxes<br />
depend on <strong>the</strong> nature <strong>of</strong> <strong>the</strong> surface and <strong>the</strong>refore on <strong>the</strong> type <strong>of</strong> surface<br />
(forest, open land, urban, lake, ocean, etc), time <strong>of</strong> day as well as on <strong>the</strong> history<br />
<strong>of</strong> <strong>the</strong> air.<br />
The depth <strong>of</strong> <strong>the</strong> ABL is <strong>the</strong>refore governed by <strong>the</strong> energy and scales <strong>of</strong> <strong>the</strong><br />
turbulent eddies which can vary <strong>in</strong> size from a few tens <strong>of</strong> meters at night to<br />
one to three kilometres dur<strong>in</strong>g warm sunny afternoons.<br />
The factor that dist<strong>in</strong>guishes <strong>the</strong> ABL from <strong>the</strong> rest <strong>of</strong> <strong>the</strong> atmosphere is<br />
turbulence. Turbulence is markedly more efficient at mix<strong>in</strong>g pollutants than is<br />
<strong>the</strong> generally lam<strong>in</strong>ar-like flow <strong>of</strong> <strong>the</strong> "free atmosphere" above it.<br />
The ma<strong>in</strong> two sources <strong>of</strong> energy that generates turbulence are "friction" or<br />
"drag" <strong>of</strong> <strong>the</strong> air with <strong>the</strong> ground, and heat. Friction results <strong>in</strong> so-called shearstress<br />
<strong>in</strong>duced turbulence while heat (given <strong>of</strong>f at day time or taken from <strong>the</strong><br />
ground at night time) generates vertical motion <strong>in</strong> <strong>the</strong> air through buoyant<br />
forces- warm air rises, cold air descends.<br />
Surface Layer (SL)<br />
The planetary “Surface Layer" (SL) refers to <strong>the</strong> lowest ~100 meters part <strong>of</strong><br />
<strong>the</strong> ABL previously def<strong>in</strong>ed. The Planetary Boundary Layer is <strong>the</strong> more turbulent<br />
part <strong>of</strong> <strong>the</strong> ABL. It is characterized by support<strong>in</strong>g approximately constant<br />
vertical fluxes <strong>of</strong> heat and momentum between <strong>the</strong> Earth's surface and <strong>the</strong> ABL<br />
above it. The PSL extends, accord<strong>in</strong>g to its def<strong>in</strong>ition <strong>of</strong> approximately constant<br />
fluxes, vertically from <strong>the</strong> surface and up to maybe one hundred meters <strong>in</strong> <strong>the</strong><br />
atmosphere.<br />
Most emissions, transports and transformation <strong>of</strong> pollutants tales place with<strong>in</strong><br />
<strong>the</strong> ABL. Its w<strong>in</strong>d and turbulence fields are <strong>the</strong>refore important for<br />
understand<strong>in</strong>g nature and mechanisms beh<strong>in</strong>d <strong>the</strong> dispersion <strong>of</strong> pollutants.<br />
4
The importance <strong>of</strong> <strong>the</strong> local w<strong>in</strong>d field<br />
The most important meteorological parameter that controls <strong>the</strong> spread<strong>in</strong>g <strong>of</strong><br />
pollutants is <strong>the</strong> mean w<strong>in</strong>d (speed and its direction). It is <strong>the</strong> w<strong>in</strong>d speed and<br />
direction that provides <strong>the</strong> basis for address<strong>in</strong>g <strong>the</strong> "WHERE" (does <strong>the</strong> plume<br />
go) question, and "WHEN" (does <strong>the</strong> plume arrive) questions.<br />
Of second importance is <strong>the</strong> degree <strong>of</strong> mix<strong>in</strong>g (level <strong>of</strong> turbulence) <strong>in</strong> <strong>the</strong><br />
atmosphere. This quantity provides <strong>the</strong> basis for answer<strong>in</strong>g <strong>the</strong> "HOW MUCH"<br />
questions.<br />
At any given po<strong>in</strong>t on <strong>the</strong> earth's surface, <strong>the</strong> local w<strong>in</strong>d speed and its direction<br />
is <strong>the</strong> comb<strong>in</strong>ed result <strong>of</strong> many different processes act<strong>in</strong>g on different "scales":<br />
On <strong>the</strong> so-called "regional" scale (1000 km and larger) we f<strong>in</strong>d <strong>the</strong> synoptic<br />
wea<strong>the</strong>r patterns with <strong>the</strong>ir pressure gradients that determ<strong>in</strong>e <strong>the</strong> w<strong>in</strong>d speed<br />
and direction. The location <strong>of</strong> <strong>the</strong> Low and High-pressure regions, with<br />
associated wea<strong>the</strong>r fronts, and <strong>the</strong> rotation <strong>of</strong> <strong>the</strong> Earth, determ<strong>in</strong>es <strong>the</strong><br />
regional scale w<strong>in</strong>d speed and direction (Geostrophic balance). As <strong>the</strong>se major<br />
synoptic wea<strong>the</strong>r systems move around <strong>the</strong> globe, <strong>the</strong> regional w<strong>in</strong>ds (<strong>in</strong><br />
particular its direction) vary with an average periodicity <strong>of</strong> about 3-7 days.<br />
Follow<strong>in</strong>g <strong>the</strong> release <strong>of</strong> a potentially hazardous material- whe<strong>the</strong>r it is a gas, an<br />
aerosol, or a cloud <strong>of</strong> f<strong>in</strong>e particles, - it is however <strong>the</strong> local w<strong>in</strong>ds that are<br />
determ<strong>in</strong>ant for where <strong>the</strong> plume is go<strong>in</strong>g and where it will be deposited, and<br />
whe<strong>the</strong>r it will endanger people and <strong>the</strong> environment.<br />
Determ<strong>in</strong>ation <strong>of</strong> <strong>the</strong> local w<strong>in</strong>d field, that is its w<strong>in</strong>d speed and its direction, as<br />
it is experienced by <strong>the</strong> plume or puff <strong>of</strong> emitted material, is far from easy.<br />
Locally, <strong>the</strong> w<strong>in</strong>d may vary <strong>in</strong> a quite complex way with height, with horizontal<br />
position (especially over complex terra<strong>in</strong>) and with time. Most difficult to handle<br />
are conditions associated with light w<strong>in</strong>ds when <strong>the</strong> plume travels slowly, and<br />
when <strong>the</strong> vertical mix<strong>in</strong>g is limited (say on cloudless nights) whereby <strong>the</strong> air<br />
concentration <strong>of</strong> <strong>the</strong> material <strong>in</strong> <strong>the</strong> plume is relatively high.<br />
On more w<strong>in</strong>dy days, however, particular over Nor<strong>the</strong>rn and Western parts <strong>of</strong><br />
Europe, w<strong>in</strong>ds are <strong>of</strong>ten controlled by so-called "synoptic forc<strong>in</strong>g". This means<br />
that <strong>the</strong> movements <strong>of</strong> a plume are controlled by <strong>the</strong> so-called geostrophic<br />
w<strong>in</strong>ds, which aga<strong>in</strong> are determ<strong>in</strong>ed by <strong>the</strong> pressure gradients <strong>of</strong> <strong>the</strong> large-scale<br />
wea<strong>the</strong>r features such as depressions and anticyclones.<br />
5
Due to <strong>the</strong> rotation <strong>of</strong> <strong>the</strong> earth, <strong>the</strong> geostrophic balanced w<strong>in</strong>ds tend to<br />
flow parallel (and not across - as one would <strong>in</strong>tuitively th<strong>in</strong>k) <strong>the</strong> isobars (i.e.,<br />
<strong>the</strong> l<strong>in</strong>es <strong>of</strong> equal pressure). This happens because on <strong>the</strong> regional or "synoptic<br />
scale" (i.e., on horizontal scales <strong>of</strong> <strong>the</strong> order <strong>of</strong> ~1000 km or more) <strong>the</strong>re is a<br />
balance on air movement between <strong>the</strong> pressure gradient force, and <strong>the</strong> Coriolis<br />
force, <strong>the</strong> latter be<strong>in</strong>g associated with <strong>the</strong> rotation-rate <strong>of</strong> <strong>the</strong> Earth. O<strong>the</strong>r<br />
forces, such as <strong>the</strong> sheer<strong>in</strong>g stress caused by <strong>the</strong> drag <strong>of</strong> <strong>the</strong> ground, and air<br />
channel<strong>in</strong>g through valleys and over passes, will result <strong>in</strong> strong local w<strong>in</strong>d<br />
deviations from <strong>the</strong> regional geostrophic w<strong>in</strong>d fields. On <strong>the</strong> local scale, say out<br />
to distances with<strong>in</strong> 10-20 km from <strong>the</strong> release po<strong>in</strong>t, effects <strong>of</strong> <strong>the</strong> underly<strong>in</strong>g<br />
surface with its topographical features also tends to be important for <strong>the</strong> w<strong>in</strong>d<br />
speed and direction, each tree, house and hill exerts drag on <strong>the</strong> air, and heat<br />
and moisture pr<strong>of</strong>iles <strong>of</strong> <strong>the</strong> air becomes important.<br />
The vertical w<strong>in</strong>d pr<strong>of</strong>ile. The "free" geostrophic w<strong>in</strong>d mentioned above<br />
prevails above <strong>the</strong> ABL, i.e. above say above ~1 km up <strong>in</strong> <strong>the</strong> atmosphere. It<br />
flows parallel to <strong>the</strong> isobars. Closer to <strong>the</strong> Earth's surface, that is, with<strong>in</strong> <strong>the</strong><br />
strong turbulent ABL, <strong>the</strong> w<strong>in</strong>d speed is gradually decreas<strong>in</strong>g, due to <strong>the</strong><br />
friction with <strong>the</strong> rough ground surface. Near <strong>the</strong> surface, houses, trees, hills<br />
and forest perturb <strong>the</strong> velocity pr<strong>of</strong>ile.<br />
The local turbulence level depends on <strong>the</strong> local "atmospheric stability" which <strong>in</strong><br />
turn is characterized by 1) <strong>the</strong> magnitude <strong>of</strong> <strong>the</strong> w<strong>in</strong>d speed 2) <strong>the</strong> surface<br />
roughness, and 3) <strong>the</strong> vertical temperature pr<strong>of</strong>ile.<br />
F<strong>in</strong>ally, because <strong>of</strong> <strong>the</strong> drag forces that exercises on air that flows near <strong>the</strong><br />
Earth's' surface, <strong>the</strong> w<strong>in</strong>d direction is <strong>of</strong>ten turned some 20 degrees counterclockwise<br />
(towards <strong>the</strong> centre <strong>of</strong> <strong>the</strong> low pressure) relative to <strong>the</strong> direction <strong>of</strong><br />
<strong>the</strong> geostrophic "free" w<strong>in</strong>ds that blows parallel to <strong>the</strong> isobars near <strong>the</strong> top <strong>of</strong><br />
<strong>the</strong> ABL at ~1 km height. This "veer<strong>in</strong>g <strong>of</strong> <strong>the</strong> w<strong>in</strong>d direction with height" can<br />
easily be observed on a "cumulus cloudy" day, where <strong>the</strong> w<strong>in</strong>d direction near <strong>the</strong><br />
top <strong>of</strong> <strong>the</strong> ABL is marked by <strong>the</strong> motion <strong>of</strong> <strong>the</strong> cumulus clouds, while <strong>the</strong> near<br />
ground w<strong>in</strong>d direction can be read from a nearby flag, a w<strong>in</strong>d turb<strong>in</strong>e or from a<br />
smoke plume.<br />
6
Figure 2.<br />
Typical vertical w<strong>in</strong>d speed and w<strong>in</strong>d direction pr<strong>of</strong>iles as can be observed<br />
from Met-tower data for a) stable, b) neutral, and c) unstable<br />
atmospheric stratification's.<br />
Vertical temperature pr<strong>of</strong>ile<br />
The vertical temperature pr<strong>of</strong>ile gradient is <strong>the</strong> most significant<br />
parameter for dist<strong>in</strong>guish<strong>in</strong>g <strong>the</strong> atmospheric stability- and <strong>the</strong>reby <strong>the</strong><br />
turbulence levels. In addition, turbulence levels are <strong>the</strong> most important<br />
factor controll<strong>in</strong>g <strong>the</strong> diffusion <strong>of</strong> pollutants.<br />
The Temperature Pr<strong>of</strong>ile and Atmospheric Stability<br />
Neutral atmospheric stratification. If, on planet Earth, <strong>the</strong>re were no<br />
heat<strong>in</strong>g nor no cool<strong>in</strong>g from <strong>the</strong> ground, <strong>the</strong> vertical temperature pr<strong>of</strong>ile<br />
(for well mixed dry air <strong>in</strong> <strong>the</strong>rmodynamically equilibrium) would get <strong>in</strong><br />
equilibrium and exhibit a l<strong>in</strong>ear decrease with height, at a rate Γ = -<br />
0.0098 K/m, i.e., <strong>the</strong> temperature would drop <strong>of</strong>f at about 1 degree<br />
Celsius or Kelv<strong>in</strong> for each 100 meters as we walk up a mounta<strong>in</strong>. The<br />
equilibrium temperature pr<strong>of</strong>ile corresponds to a neutrally stratified<br />
atmosphere. When an observed vertical temperature pr<strong>of</strong>ile actually<br />
corresponds to this adiabatic lapse rate, we say that <strong>the</strong> air layer has a<br />
neutral atmospheric stability. In this case, a parcel <strong>of</strong> air (say 1 m 3 ) when<br />
moved adiabatically (without head exchange) from one height to ano<strong>the</strong>r,<br />
will automatically change its pressure, density and temperature <strong>in</strong> such a<br />
way that it would rema<strong>in</strong> <strong>in</strong> <strong>the</strong>rmal equilibrium with its surround<strong>in</strong>g air.<br />
Consequently, no restor<strong>in</strong>g forces on <strong>the</strong> parcel will be created <strong>in</strong> this<br />
case due to pressure, density or temperature differences. The<br />
atmosphere is <strong>the</strong>n neutrally stratified. This means that only shear or<br />
7
gradient driven turbulence will be created <strong>in</strong> this case (usually near <strong>the</strong><br />
surface) - but no heat or buoyancy-driven turbulence is added, nor<br />
destroyed.<br />
Stable atmospheric stratification. Suppose now that an actually<br />
observed temperature gradient is less negative than <strong>the</strong> correspond<strong>in</strong>g to<br />
<strong>the</strong> adiabatic lapse rate, say e.g. that <strong>the</strong> same temperature is observed<br />
at <strong>the</strong> ground and at + 100 meters height. If we <strong>in</strong> this environment aga<strong>in</strong><br />
take a small air parcel from near <strong>the</strong> ground and lift it adiabatically to<br />
<strong>the</strong> +100 meter level, its temperature will aga<strong>in</strong> drop by ~ 1 C because<br />
<strong>the</strong> pressure and density changes. However, now <strong>the</strong> parcel temperature<br />
would be one C colder than surround<strong>in</strong>g air temperature, which rema<strong>in</strong>ed<br />
constant. At 100 meters, height <strong>the</strong> air parcel will consequently be colder<br />
and heavier than its surround<strong>in</strong>g air and <strong>the</strong> parcel will start to fall down<br />
towards its place <strong>of</strong> orig<strong>in</strong>- <strong>in</strong> this case <strong>the</strong> ground. The actual<br />
temperature pr<strong>of</strong>ile tends <strong>in</strong> this case to restore all vertical motions<br />
<strong>in</strong>cluded those caused by turbulence, and we say that <strong>the</strong> layer is<br />
"Stable" stratified.<br />
Unstable atmospheric stratification. Consider next <strong>the</strong> opposite case<br />
where <strong>the</strong> actual observed temperature gradient is more negative than<br />
<strong>the</strong> neutral lapse rate Γ, say e.g. we observe a -2 C o per 100 meters<br />
vertical gradient. As our test parcel <strong>of</strong> air aga<strong>in</strong> is lifted adiabatically up<br />
from <strong>the</strong> ground to 100 meters height, its <strong>in</strong>ternal temperature will as<br />
before cool adiabatically by ~1 C o . But <strong>the</strong> surround<strong>in</strong>g temperature at<br />
100 meters height is <strong>in</strong> this case lowered by 2 degrees, so relative to its<br />
surround<strong>in</strong>gs, <strong>the</strong> adiabatically lifted air parcel is now at + 1 degree C o<br />
relative to its surround<strong>in</strong>gs. The air parcel has become "a hot air balloon"<br />
with a temperature <strong>of</strong> + 1 C o relative to its surround<strong>in</strong>gs. If we let it<br />
cont<strong>in</strong>ue to rise it would at 200 meters height experience a +2 C o <strong>in</strong>crease<br />
<strong>in</strong> temperature relative to its ambient air, suppos<strong>in</strong>g that <strong>the</strong> pr<strong>of</strong>ile<br />
doesn't change. The atmosphere is said to be "Unstable" because all<br />
vertical motion will tend to be amplified.<br />
Surface Friction (Surface Drag) Ano<strong>the</strong>r important source <strong>of</strong><br />
turbulence is caused by friction (drag). The w<strong>in</strong>d speed on <strong>the</strong> ground (<strong>in</strong><br />
practice at 1 mm height, say) must be zero to fulfil <strong>the</strong> no-slip condition<br />
<strong>of</strong> any fluid (<strong>in</strong> this case air) on a boundary. The result<strong>in</strong>g strong gradient<br />
<strong>in</strong> w<strong>in</strong>d speed with height causes "sheer" <strong>in</strong>duced turbulence: <strong>the</strong><br />
stronger <strong>the</strong> w<strong>in</strong>d speed, and <strong>the</strong> closer to <strong>the</strong> ground, <strong>the</strong> stronger is<br />
<strong>the</strong> generation <strong>of</strong> shear-<strong>in</strong>duced or mechanically <strong>in</strong>duced turbulence.<br />
8
Notice that this source <strong>of</strong> turbulence is always positive and <strong>in</strong>dependent<br />
<strong>of</strong> <strong>the</strong> direction (sign) <strong>of</strong> <strong>the</strong> temperature gradient.<br />
Atmospheric stability. Turbulence generated from by temperature<br />
stratification's can sometimes be positive (dur<strong>in</strong>g unstable daytime<br />
conditions with negative vertical temperature gradients, and sometimes<br />
negative (dur<strong>in</strong>g night time with positive vertical temperature gradients).<br />
The result<strong>in</strong>g stability <strong>of</strong> <strong>the</strong> ABL is <strong>the</strong>refore <strong>the</strong> comb<strong>in</strong>ed effect <strong>of</strong><br />
<strong>the</strong>rmal and friction generated turbulence. At daytime both contributions<br />
add to <strong>the</strong> turbulence near <strong>the</strong> ground, while at night time - with low w<strong>in</strong>d<br />
speeds, <strong>the</strong> <strong>the</strong>rmal "suppression" <strong>of</strong>ten "w<strong>in</strong>s" over <strong>the</strong> creation by<br />
friction.<br />
Measures for Turbulence A simple measure for <strong>the</strong> level or strength <strong>of</strong><br />
turbulence is its level <strong>of</strong> <strong>in</strong>tensity i, def<strong>in</strong>ed as:<br />
2 2 2<br />
i = u + v + w U<br />
′ ′ ′ (1)<br />
That is, <strong>the</strong> turbulence <strong>in</strong>tensity, i, is def<strong>in</strong>ed as <strong>the</strong> square root <strong>of</strong> <strong>the</strong><br />
sum <strong>of</strong> <strong>the</strong> variances <strong>of</strong> <strong>the</strong> three velocity components u' (<strong>in</strong> <strong>the</strong><br />
downw<strong>in</strong>d direction), v' (<strong>in</strong> <strong>the</strong> crossw<strong>in</strong>d direction) and w' (<strong>the</strong> vertical<br />
direction), divided by <strong>the</strong> mean w<strong>in</strong>d speed U .<br />
The mean value (designated by an over-bar) is usually obta<strong>in</strong>ed as time<br />
averages over periods rang<strong>in</strong>g from 5 m<strong>in</strong>utes up to 1 hour.<br />
An unstable atmosphere implies a high level <strong>of</strong> turbulence, with<br />
turbulence <strong>in</strong>tensities rang<strong>in</strong>g between 0.2 and 0.4, whereas a stable<br />
atmosphere, with little or almost zero turbulence at all, is characterized<br />
by <strong>in</strong>tensities <strong>in</strong> <strong>the</strong> range 0.05 - 0.01.<br />
Source Types and Source Heights. In addition to w<strong>in</strong>d temperature and<br />
turbulence, also <strong>the</strong> effluents actual source type and source heights are<br />
important factors, which <strong>in</strong>fluences atmospheric dispersion. Air<br />
concentrations highly depend on <strong>the</strong> effective source height. To first<br />
order, ground level air concentrations depend <strong>in</strong>versely proportional on<br />
<strong>the</strong> source height to <strong>the</strong> second power (see below).<br />
The heat and momentum content <strong>of</strong> an effluent also add to <strong>the</strong> effective<br />
source height, and is <strong>the</strong>refore an equally important factor for<br />
9
dispersion. The buoyancy <strong>of</strong> <strong>the</strong> effluent itself can be big importance, if<br />
it’s a cold gas it will fall to <strong>the</strong> ground (see part II: Atmospheric<br />
Dispersion: Heavy gases) or it can be hot or energetic, <strong>in</strong> which case we<br />
need to consider plume and momentum rise.<br />
Inversion height. The <strong>in</strong>version height and its strength is ano<strong>the</strong>r very<br />
important parameter to consider for atmosphere dispersion.<br />
Source types may alter between s<strong>in</strong>gle po<strong>in</strong>t sources and l<strong>in</strong>e sources over<br />
explosive sources with huge heat and momentum content. The Chernobyl<br />
accident was <strong>in</strong> its <strong>in</strong>itial phase characterized by a heat and vapor<br />
explosion, followed by a plume release with significant heat content. On<br />
<strong>the</strong> Ukra<strong>in</strong>ian night <strong>of</strong> April 26 1986, <strong>the</strong> burn<strong>in</strong>g graphite plume rose<br />
some ~1 km al<strong>of</strong>t before it blew north-westwards <strong>in</strong> a strongly stable<br />
stratified atmosphere. It is first today are we about to understand and<br />
model <strong>the</strong> comb<strong>in</strong>ed effects <strong>of</strong> <strong>the</strong> Chernobyl <strong>in</strong>itial stage release and <strong>the</strong><br />
stable stratified atmosphere <strong>in</strong> connection with local <strong>in</strong>version heights<br />
and local w<strong>in</strong>d sheer.<br />
Effluents can also be <strong>of</strong> cont<strong>in</strong>uous type cont<strong>in</strong>uous (plumes) or<br />
<strong>in</strong>stantaneous (puffs). In addition, this affects <strong>the</strong> result<strong>in</strong>g dispersion<br />
pattern.<br />
Atmospheric Dispersion at different scales<br />
Surface layer scal<strong>in</strong>g The planetary Surface Layer (SL) was earlier<br />
def<strong>in</strong>ed as <strong>the</strong> lowest ~100 meters <strong>of</strong> <strong>the</strong> atmosphere. It is<br />
characterized by its approximately constant vertical fluxes <strong>of</strong> heat and<br />
momentum. The magnitudes <strong>of</strong> <strong>the</strong>se fluxes can <strong>the</strong>refore be determ<strong>in</strong>ed<br />
by measurements near <strong>the</strong> surface (typically at 10 meters height). It is<br />
only with<strong>in</strong> <strong>the</strong> PBL, which is with<strong>in</strong> <strong>the</strong> th<strong>in</strong> surface layer <strong>of</strong> <strong>the</strong><br />
atmosphere that <strong>the</strong> surface layer Mon<strong>in</strong>-Obukhov similarity scal<strong>in</strong>g <strong>of</strong><br />
dispersion is applicable.<br />
Mesoscale Meso is Greek for " <strong>in</strong> between" and refers to atmospheric<br />
phenomenon which occurs on horizontal scales large enough that <strong>the</strong><br />
hydrostatic approximation (i.e., that <strong>the</strong> vertical acceleration forces <strong>of</strong><br />
<strong>the</strong> air mass can be neglected compared with <strong>the</strong> hydrostatic pressure<br />
forces) is a valid assumption (usually it is on scales bigger > 2 km); yet<br />
small enough (
dient w<strong>in</strong>ds can approximate <strong>the</strong> regional w<strong>in</strong>d circulation [Pielke (1984)].<br />
Vertically, <strong>the</strong> surface layer extends a few hundred meters whereas <strong>the</strong><br />
mesoscale extends throughout <strong>the</strong> entire troposphere.<br />
Mesoscale models utilize grid spac<strong>in</strong>g rang<strong>in</strong>g between a few meters for<br />
modell<strong>in</strong>g <strong>of</strong> local scale dispersion phenomena and out to 20 km or more <strong>in</strong><br />
numerical wea<strong>the</strong>r forecast models utilized on <strong>the</strong> regional scale. The<br />
correspond<strong>in</strong>g time scales ranges from fractions <strong>of</strong> a second <strong>in</strong> <strong>the</strong> nearsurface<br />
layer concentration fluctuations to tens <strong>of</strong> hours for <strong>the</strong> meso-γ<br />
scale wea<strong>the</strong>r system calculations.<br />
Atmospheric dispersion <strong>of</strong> a puff progresses with different scal<strong>in</strong>g laws<br />
on <strong>the</strong> various scales. In <strong>the</strong> start, with<strong>in</strong> <strong>the</strong> SL, is expands at first<br />
under <strong>in</strong>fluence <strong>of</strong> <strong>the</strong> <strong>in</strong>itial source dimension, <strong>the</strong> heat and momentum<br />
content <strong>of</strong> <strong>the</strong> release, by nearby build<strong>in</strong>g effects, by down-w<strong>in</strong>d changes<br />
<strong>in</strong> roughness and surface heatfluxes (<strong>in</strong> particular by <strong>the</strong> atmospheric<br />
stability).<br />
Then it undergoes diffusion by transition through various time and<br />
spatially chang<strong>in</strong>g boundary layers.<br />
Additional local scale effects <strong>in</strong>clude heterogeneous surfaces, hills, and<br />
roll<strong>in</strong>g and steep complex terra<strong>in</strong>. When a dispers<strong>in</strong>g puff reaches <strong>the</strong><br />
Mesoscale ( say when <strong>the</strong> puff size is comparable to <strong>the</strong> mix<strong>in</strong>g height<br />
(~2 km) , <strong>the</strong> expansion will fur<strong>the</strong>rmore be <strong>in</strong>fluenced by w<strong>in</strong>ds<br />
orig<strong>in</strong>at<strong>in</strong>g from differential heat<strong>in</strong>g such as: sea-and land breezes, up<br />
and down slope w<strong>in</strong>ds, valley circulation's and orographically <strong>in</strong>duced<br />
w<strong>in</strong>ds.<br />
Long Range After a day <strong>of</strong> travel time or so, most plumes and puffs have<br />
diffused to a lateral extent <strong>of</strong> <strong>the</strong> order <strong>of</strong> ~100 km, that is, <strong>the</strong>y have<br />
diffused horizontally to scales where <strong>the</strong> atmosphere for all practical<br />
purposes have become two- dimensional.<br />
Turbulence on this scale also takes on a different form known as largescale<br />
enstrophy cascade. The usual local scale plume or puff conf<strong>in</strong>ed<br />
entity picture soon disappear for two-dimensional turbulence, and <strong>the</strong><br />
usual surface and boundary layer parametric descriptions <strong>of</strong> dispersion is<br />
no longer valid.<br />
11
II Diffusion Theories and associated Atmospheric<br />
Dispersion Models<br />
In <strong>the</strong> follow<strong>in</strong>g a short review is given on <strong>the</strong> diffusion <strong>the</strong>ories and<br />
model categories from which most practical dispersion models used today<br />
are based.<br />
Fixed and mov<strong>in</strong>g frames <strong>of</strong> reference<br />
In this chapter, <strong>the</strong> word "plume" will be used to designate a cont<strong>in</strong>uous<br />
release <strong>of</strong> pollutant from a po<strong>in</strong>t source, while <strong>the</strong> word "puff" will be<br />
used about an <strong>in</strong>stantaneous released quantity <strong>of</strong> pollutant. So while <strong>the</strong><br />
different segments <strong>of</strong> pollutants belong<strong>in</strong>g to a plume all have different<br />
travel times s<strong>in</strong>ce <strong>the</strong>ir release from <strong>the</strong> source po<strong>in</strong>t, all pollutants<br />
belong<strong>in</strong>g to a s<strong>in</strong>gle puff have one, and only one age s<strong>in</strong>ce <strong>the</strong>ir start <strong>of</strong><br />
release, namely <strong>the</strong> puffs travel time t.<br />
Two fundamental different types <strong>of</strong> atmospheric dispersion must be<br />
discrim<strong>in</strong>ated:<br />
1. Fixed frame concentrations<br />
2. Mov<strong>in</strong>g frame concentrations<br />
The fixed frame averaged concentration is measured at, or is referred<br />
to, at fixed po<strong>in</strong>ts (on <strong>the</strong> ground), while <strong>the</strong> <strong>in</strong>stantaneous concentration<br />
refers to a mov<strong>in</strong>g frame <strong>of</strong> reference, which follows with <strong>the</strong> cloud or<br />
puff's centre <strong>of</strong> mass. For this reason, averaged (whe<strong>the</strong>r time averaged<br />
or ensemble-averaged), dispersion is <strong>of</strong>ten referred to as " fixed frame"<br />
dispersion or absolute dispersion- while <strong>in</strong>stantaneous dispersion <strong>of</strong>ten is<br />
referred to as "mov<strong>in</strong>g frame dispersion, or "relative dispersion". The<br />
physical mechanisms beh<strong>in</strong>d <strong>the</strong> two types <strong>of</strong> dispersion are quite<br />
different: While <strong>the</strong> averaged mean concentration and its associated<br />
dispersion, process phenomenologically can be described by s<strong>in</strong>gle and<br />
<strong>in</strong>dependent fluid particle's trajectory ensemble statistics; <strong>the</strong><br />
<strong>in</strong>stantaneous puff dispersion process <strong>in</strong>volves at least <strong>the</strong> jo<strong>in</strong>t statistics<br />
<strong>of</strong> two fluid particles or more at <strong>the</strong> same time.<br />
Much fundamental research and <strong>the</strong>oretical formation has dur<strong>in</strong>g <strong>the</strong><br />
past century been devoted to model and describe <strong>the</strong> turbulent diffusion<br />
process with<strong>in</strong> <strong>the</strong> atmosphere The field has <strong>in</strong> particular been dom<strong>in</strong>ated<br />
12
y Russian and British researchers <strong>the</strong> Twentieth century. A short review<br />
is given next:<br />
The classical dist<strong>in</strong>ctions among diffusion <strong>the</strong>ories as used <strong>in</strong> <strong>the</strong><br />
atmosphere have traditional been (<strong>in</strong> historical order):<br />
1. diffusion equation methods (stability classes)<br />
2. statistical methods (Random walk models – K<strong>in</strong>ematic simulation<br />
methods);<br />
3. Lagrangian similarity scal<strong>in</strong>g<br />
Ad. 1 Diffusion equation methods (stability classes)<br />
Anomalous Diffusion The classical approach to describe <strong>the</strong> atmospheric<br />
diffusion process was based on a generalization <strong>of</strong> <strong>the</strong> heat diffusion<br />
process known from solid-state physics, and <strong>the</strong> molecular diffusion<br />
process known from gas diffusion. In <strong>the</strong> beg<strong>in</strong>n<strong>in</strong>g <strong>of</strong> last century,<br />
atmospheric physicists such as Prandl referred to <strong>the</strong> atmospheric<br />
diffusion process as "anomalous" diffusion, because it was much faster<br />
than <strong>the</strong> hi<strong>the</strong>rto known "nomalous" (molecular) Brownian diffusion.<br />
The Diffusion Equation The classical diffusion equation emerges as a<br />
direct and simple consequence <strong>of</strong> <strong>the</strong> conservation <strong>of</strong> mass pr<strong>in</strong>cipia<br />
(dc/dt =0), that is, <strong>the</strong> rate (d /dt) <strong>of</strong> chang<strong>in</strong>g <strong>the</strong> total mass c with<strong>in</strong> a<br />
closed system is zero. In Cartesian coord<strong>in</strong>ates, where <strong>the</strong> concentration<br />
c is locally distributed, c(xi,t) can change locally as function <strong>of</strong> both<br />
space coord<strong>in</strong>ates xi (i = 1,2,3), and time t. This conservation pr<strong>in</strong>ciple<br />
implies that <strong>the</strong> conservation equation now reads, neglect<strong>in</strong>g a small term<br />
due to molecular diffusivity<br />
dc<br />
ct<br />
c<br />
u<br />
dt<br />
dc<br />
= i<br />
dx<br />
∂ + = 0 (2)<br />
i<br />
where ui is <strong>the</strong> <strong>in</strong>stantaneous, mass advect<strong>in</strong>g w<strong>in</strong>d speed. By here<br />
<strong>in</strong>troduc<strong>in</strong>g mean and fluctuations parts<br />
c = c + c′ ; ui = ui + ui′<br />
def<strong>in</strong>ed <strong>in</strong> such a way that <strong>the</strong> fluctuat<strong>in</strong>g parts averages to zero<br />
c′= 0 ;<br />
u′ i = 0<br />
13<br />
(3)<br />
(4)
<strong>the</strong> diffusion equation results<br />
dc<br />
dt<br />
=<br />
u<br />
i<br />
∂c<br />
= −<br />
dt x<br />
∂<br />
∂<br />
i<br />
' ' euc i j + " sour ces" − " si nks" (5)<br />
Gradient transport: K-closure. Analogous to what is known from<br />
molecular transport, also turbulence transport can be assumed or<br />
modelled proportional to <strong>the</strong> mean gradient <strong>in</strong> <strong>the</strong> concentration field.<br />
This is called first order closure, and implies:<br />
u c K c ∂<br />
′ i ′ =−<br />
(6)<br />
i<br />
dx<br />
That is, <strong>the</strong> turbulent transport flux u′ i c′<br />
is assumed proportional to<br />
∂ c<br />
diffusivity, Ki , multiplied by <strong>the</strong> mean gradient .<br />
dx<br />
Analytical solutions to <strong>the</strong> diffusion equation. In <strong>the</strong> simplest possible<br />
case with only one dimension (<strong>in</strong> <strong>the</strong> z direction <strong>in</strong> this case), and with a<br />
constant vertical diffusivity (Kz) and constant mean w<strong>in</strong>d speed u = x / t<br />
<strong>in</strong> <strong>the</strong> downw<strong>in</strong>d (x) direction, <strong>the</strong>n <strong>the</strong> solution to <strong>the</strong> diffusion equation<br />
for mean concentrations becomes <strong>the</strong> classical Gaussian plume model<br />
equation, namely:<br />
czt (,) =<br />
Q<br />
e<br />
2π<br />
u σ<br />
i<br />
z<br />
i<br />
1 z 2<br />
− ( )<br />
2 σ z<br />
Here, Q is <strong>the</strong> source strength and σz, <strong>the</strong> plumes standard deviation,<br />
characterizes <strong>the</strong> plume size as function <strong>of</strong> diffusion time t, or<br />
alternatively downw<strong>in</strong>d distance x = ut . The derivative <strong>of</strong> <strong>the</strong> standard<br />
deviation squared is related to <strong>the</strong> diffusivity K through<br />
σ z<br />
2<br />
½ d<br />
dt<br />
(7)<br />
≡ K<br />
(8)<br />
So <strong>the</strong> plume spread, or more precisely <strong>the</strong> square <strong>of</strong> <strong>the</strong> standard<br />
deviation, can be calculated from <strong>the</strong> follow<strong>in</strong>g equation:<br />
14<br />
z
σ () t = 2K t + σ () 0<br />
2 2<br />
z z z<br />
where σz(0) is <strong>the</strong> plume or puffs <strong>in</strong>itial size at time t = 0. Analytical<br />
solutions for <strong>the</strong> spread can sometimes be found when Kz is given as<br />
known functions <strong>of</strong> height z or time t. It is seen that <strong>the</strong> Gaussian plume<br />
model results as solutions to <strong>the</strong> diffusion equation. The Gaussian plume<br />
model was <strong>the</strong> model foundation for <strong>the</strong> Pasquill-Gifford-Turner<br />
atmospheric dispersion parameter system based on stability classes.<br />
The Pasquill stability class dispersion parameter system. PASQUILL,<br />
F. (1961), <strong>in</strong> collaboration with <strong>the</strong> American scientists F. Gifford, and B.<br />
Turner, developed <strong>the</strong> well-known Pasquill-Gifford-Turner (PGT) stability<br />
categories [A, B, C, D, E, F] with correspond<strong>in</strong>g σy (lateral plume size) and<br />
σz (vertical plume size) curves for time averaged (type 1) plume diffusion.<br />
The sigma curves were fitted to plume spread obta<strong>in</strong>ed from empirical<br />
plume diffusion data for each stability category.<br />
σy and σz classification schemes. The PGT diffusion scheme and its<br />
associated dispersion parameters have been among <strong>the</strong> most frequently<br />
applied dispersion schemes all over <strong>the</strong> World. The PGT categories are<br />
determ<strong>in</strong>ed from w<strong>in</strong>d speed (at 10 m height above ground) and <strong>in</strong>com<strong>in</strong>g<br />
<strong>in</strong>solation (time <strong>of</strong> day-cloud cover) as govern<strong>in</strong>g parameters. A is <strong>the</strong><br />
most unstable case, D corresponds to neutral case, and F is <strong>the</strong> most<br />
stable dispersion class. The PGT stability class method is limited,<br />
however, to conditions (with respect to range and type <strong>of</strong> land use)<br />
similar to <strong>the</strong> conditions under which <strong>the</strong> diffusion experiments were<br />
orig<strong>in</strong>ally extracted, i.e. diffusion from near-ground releases, and over<br />
terra<strong>in</strong> with low surface roughness (rural areas).<br />
Today however, <strong>the</strong> correspond<strong>in</strong>g formula's or nomogrammes (look up<br />
schemes) are progressively be<strong>in</strong>g implemented on computers - or, as is <strong>in</strong><br />
particular <strong>the</strong> case for real-time dispersion assessments, are be<strong>in</strong>g<br />
replaced by so-called "second-generation" dispersion schemes, based on<br />
micro-meteorological similarity scal<strong>in</strong>g parameters, see e.g. Olesen and<br />
Mikkelsen, (1992).<br />
15<br />
(9)
Insolation Cloud cover<br />
Day: Strong Insolation<br />
Moderate<br />
Slight<br />
Night: Cloud cover ∃4/8<br />
Cloud cover < 4/8<br />
Surface1 W<strong>in</strong>d speed U [m/s]<br />
< 2 2-3 3-5 5-6<br />
> 6<br />
A<br />
A-B<br />
B<br />
A-B<br />
B<br />
C<br />
Table 1: Def<strong>in</strong>ition <strong>of</strong> <strong>the</strong> Pasquill stability classes A-F:<br />
F<br />
F<br />
E<br />
F<br />
B<br />
B-C<br />
C<br />
D<br />
E<br />
C<br />
C-D<br />
D<br />
Table.2 The Pasquill stability Classes and <strong>the</strong>ir correspond<strong>in</strong>g<br />
turbulence levels, here given <strong>in</strong> terms <strong>of</strong> standard deviations as measured<br />
<strong>in</strong> <strong>the</strong> horizontal w<strong>in</strong>d direction fluctuations<br />
Pasquil StabilityCategory σθ<br />
A. Extremely unstable conditions 25.0Ε<br />
B. Moderate unstable conditions 20.0 Ε<br />
C. Slightly unstable conditions 15.0 Ε<br />
D. Neutral conditions 10.0Ε<br />
E. Slightly stable 5.0Ε<br />
F. Stable conditions 2.5Ε<br />
1 Usually, surface w<strong>in</strong>d speed is measured at 10 meters height.<br />
16<br />
D<br />
D<br />
C<br />
D<br />
D<br />
D<br />
D
Figure 3<br />
Pasquill stability classification schemes for mean plume standard<br />
deviations. Left: horizontal diffusion, (right) vertical diffusion<br />
coefficients.<br />
Ad 2: Statistical Methods:<br />
Statistical methods for access<strong>in</strong>g atmospheric diffusion dist<strong>in</strong>guishes 1)<br />
Random walk methods (also called Statistical Simulation methods), and 2)<br />
K<strong>in</strong>ematic Simulation.<br />
A fundamental statistical description <strong>of</strong> dispersion based on "s<strong>in</strong>gle fluid<br />
particles" was presented by Sir G. I. Taylor's <strong>the</strong>ory on "Diffusion by<br />
cont<strong>in</strong>uous movements" already <strong>in</strong> 1921 (Taylor's formula, G. I. Taylor,<br />
1921). Taylor's method can be used for calculation <strong>of</strong> <strong>the</strong> crossw<strong>in</strong>d plume<br />
standard deviation σy, based on observed w<strong>in</strong>d statistics at <strong>the</strong> source<br />
po<strong>in</strong>t.<br />
The work <strong>of</strong> G. I. Taylor demonstrated that it is <strong>the</strong> Lagrangian ra<strong>the</strong>r<br />
than <strong>the</strong> Eulerian properties <strong>of</strong> <strong>the</strong> turbulence that are responsible for<br />
dispersion. Lagrangian statistics means that <strong>the</strong> turbulent quantities<br />
(velocity) have to be assessed along <strong>the</strong> mov<strong>in</strong>g fluid particle's trajectory<br />
17
(e.g. by follow<strong>in</strong>g a small neutrally buoyant balloon), while Eulerian<br />
properties imply that e.g. w<strong>in</strong>d statistics that can be obta<strong>in</strong>ed from<br />
simpler measurements at a fixed po<strong>in</strong>ts (e.g. at <strong>the</strong> release po<strong>in</strong>t or from<br />
a Met tower).<br />
Five years later F. L. Richardson (1926) presented results from his<br />
observations on "relative atmospheric diffusion". He showed, on a<br />
distance-neighbor graph, that two-particle's relative separation on<br />
average scaled with <strong>the</strong> particles <strong>in</strong>stantaneous separation. This<br />
observation later led him to formulate his famous “Diffusivity for<br />
relative dispersion α l 4/3 power law ” , where l is <strong>the</strong> two particles'<br />
<strong>in</strong>stantaneous separation.<br />
Ano<strong>the</strong>r British scientist, G. K. Batchelor (1952), related relative<br />
dispersion directly to scal<strong>in</strong>g parameters for <strong>the</strong> turbulence itself, which<br />
has meanwhile been discovered by Russian scientists (an example <strong>of</strong> a<br />
turbulence scal<strong>in</strong>g parameter is for <strong>in</strong>stance <strong>the</strong> Kolmogorov's <strong>in</strong>ertial<br />
subrange dissipation rate ε). In his famous article "Diffusion <strong>in</strong> <strong>the</strong> Field<br />
<strong>of</strong> Homogeneous Turbulence, II. The relative motion <strong>of</strong> particles" G. K.<br />
Batchelor relates <strong>the</strong> standard deviation for a puff to <strong>the</strong> dissipation<br />
rate ε for homogeneous 3-dimensional <strong>in</strong>ertial subrange turbulence (σ 2 y α<br />
εT 3 ).<br />
Ad 3. Lagrangian Similarity Theory (Scal<strong>in</strong>g)<br />
The Lagrangian similarity approach. Similarities scal<strong>in</strong>g <strong>of</strong> turbulence<br />
means that <strong>the</strong> vertical pr<strong>of</strong>iles <strong>of</strong> <strong>the</strong> state quantities (such as<br />
temperature, w<strong>in</strong>d speed, humidity, pollutants etc) are uniquely<br />
determ<strong>in</strong>ed by <strong>the</strong> so-called scal<strong>in</strong>g parameters, which are: height z above<br />
<strong>the</strong> ground, air density ρ, buoyancy parameter g/T, surface shear stress<br />
u*, and <strong>the</strong> vertical flux <strong>of</strong> heat H/cpρ. The prerequisites for similarity<br />
scal<strong>in</strong>g to apply is that <strong>the</strong> turbulence is homogeneous and stationary, and<br />
that <strong>the</strong> vertical fluxes <strong>of</strong> momentum - ρu*<br />
2 and heat H/cpρ are constant<br />
<strong>in</strong>dependent <strong>of</strong> height. These assumptions can <strong>of</strong>ten be fulfilled <strong>in</strong> <strong>the</strong><br />
Planetary Surface Layer (PSL). The orig<strong>in</strong>s <strong>of</strong> similarity scal<strong>in</strong>g for <strong>the</strong><br />
atmospheric surface layer turbulence has roots <strong>in</strong> early work by Russian<br />
academicians Mon<strong>in</strong> and Obukhov, who formed <strong>the</strong> similarity based Mon<strong>in</strong>-<br />
Obukhov stability parameter "L", see below.<br />
18
Mon<strong>in</strong>-Obukhov similarity scal<strong>in</strong>g (z/L), applied to mean pr<strong>of</strong>iles <strong>of</strong> w<strong>in</strong>d<br />
speed, temperature and humidity over a homogeneous terra<strong>in</strong>, were<br />
validated experimentally dur<strong>in</strong>g <strong>the</strong> now famous 1968 <strong>in</strong>ternational Kansas<br />
field experiment (Busch, 1973).<br />
Lagrangian similarity <strong>the</strong>ory as nowadays applied to atmospheric<br />
dispersion orig<strong>in</strong>s from <strong>the</strong> Russian scientist Mon<strong>in</strong> (1959), but was<br />
fur<strong>the</strong>r crystallized and fur<strong>the</strong>r elaborated upon by Batchelor (1959,<br />
1964).<br />
The application <strong>of</strong> "Lagrangian Similarity Scal<strong>in</strong>g" <strong>of</strong> turbulent<br />
atmospheric dispersion emerged <strong>in</strong> <strong>the</strong> 1990'ties with<strong>in</strong> many practical<br />
"new generation" atmospheric dispersion models for regulat<strong>in</strong>g <strong>in</strong>dustries<br />
<strong>in</strong> accordance with National Environmental Protection laws. Also<br />
contemporary real-time dispersion modes for emergency management and<br />
decision support nowadays utilize Lagrangian similarity scal<strong>in</strong>g for<br />
detailed dispersion parameterisation <strong>in</strong> stead <strong>of</strong> <strong>the</strong> previous Pasquill-<br />
Gifford-Turner stability classification schemes (A, B, C…F).<br />
As <strong>in</strong> <strong>the</strong> case above where similarity <strong>the</strong>ory is used to describe <strong>the</strong><br />
turbulent mean pr<strong>of</strong>iles <strong>in</strong> terms <strong>of</strong> constant scal<strong>in</strong>g parameters,<br />
Lagrangian Similarity Theory applies also to dispersion and assumes that<br />
also <strong>the</strong> Lagrangian frame properties <strong>of</strong> dispers<strong>in</strong>g plumes and puffs,<br />
<strong>in</strong>clud<strong>in</strong>g <strong>the</strong>ir key parameters (such as mean height, standard deviation<br />
etc) are governed by <strong>the</strong> set <strong>of</strong> scal<strong>in</strong>g parameters that also controls <strong>the</strong><br />
mean pr<strong>of</strong>iles with<strong>in</strong> <strong>the</strong> surface layer, <strong>in</strong> addition to <strong>the</strong> diffusion time t<br />
itself. Aga<strong>in</strong>, scal<strong>in</strong>g parameters are quantities derived from flow<br />
properties and fluxes that are (approximately) constant <strong>in</strong> a given flow<br />
regime or range <strong>of</strong> scale. For <strong>in</strong>stance is shear stress velocity u* an<br />
important scal<strong>in</strong>g parameter for a near neutral Surface Layer.<br />
Lagrangian similarity <strong>the</strong>ory applied to particles dispersion <strong>in</strong> <strong>the</strong> surface<br />
layer implies that both mean height , and <strong>the</strong> dispersion <strong>of</strong> a surface<br />
released puff <strong>in</strong> neutral stratified atmosphere, "scales" with, or is a<br />
function <strong>of</strong> (u*, t). The simplest form is (σy, σz) ∝ u* t. British-based P.C.<br />
Chatw<strong>in</strong>, (1968) was among <strong>the</strong> first to explore <strong>the</strong> implications <strong>of</strong><br />
Lagrangian similarity scal<strong>in</strong>g <strong>in</strong> his work on "The dispersion <strong>of</strong> a puff <strong>of</strong><br />
passive contam<strong>in</strong>ant <strong>in</strong> <strong>the</strong> constant stress region".<br />
Recently, Danish experimentalists (Mikkelsen et al., 2002) showed that<br />
Lagrangian similarity <strong>the</strong>ory also expla<strong>in</strong>s an exponential observed form<br />
19
<strong>of</strong> <strong>the</strong> two-particle distance-neighbour function 2 <strong>in</strong> surface released<br />
smoke plumes <strong>the</strong>y measured dur<strong>in</strong>g <strong>the</strong> comprehensive MADONA surface<br />
layer diffusion experiment (Cionco et al, 1999).<br />
Some common and a few new similarity-scal<strong>in</strong>g laws for common<br />
atmospheric turbulence and dispersion subrange follows next:<br />
Example 1. Inertia-subrange "ε":<br />
For 3-dimensional isotropic turbulence, as can be encountered <strong>in</strong> <strong>the</strong> ABL<br />
above <strong>the</strong> surface layer, <strong>the</strong> only relevant constant scal<strong>in</strong>g parameter for<br />
turbulence is <strong>the</strong> dissipation rate <strong>of</strong> k<strong>in</strong>etic energy ε [m 2 s -3 ].<br />
Consequently, as is evident from dimensional reasons, <strong>the</strong> correspond<strong>in</strong>g<br />
velocity spectra S(k) (for all three components u, v, w) must take on <strong>the</strong><br />
form:<br />
where k is <strong>the</strong> wave number.<br />
Sk ( ) ∝ ε k<br />
23 / −53<br />
/<br />
20<br />
(10)<br />
An <strong>in</strong>stantaneous released puff will, accord<strong>in</strong>g to Lagrangian Similarity<br />
<strong>the</strong>ory, expand <strong>in</strong> this turbulent fields <strong>in</strong>ertia subrange, accord<strong>in</strong>g to<br />
(Batchelor, 1952):<br />
σ ∝ ε t<br />
2 3<br />
puff<br />
(11)<br />
where σPuff is <strong>the</strong> standard deviation (root-mean square) <strong>of</strong> <strong>the</strong> puff's<br />
particle distribution or simply " size", at diffusion time t.<br />
A "K" diffusivity for <strong>the</strong> for <strong>the</strong> puff particles distance-neighbor<br />
function, based on <strong>the</strong> dissipation parameter ε, was already predicted by<br />
Richardson (1926), as<br />
DN ∝ ε 13 4/ 3<br />
/<br />
K y<br />
2 Distance-neighbor function is a measure <strong>of</strong> <strong>the</strong> structure function for <strong>the</strong> puff particles def<strong>in</strong>ed as:<br />
z∞<br />
−∞<br />
)<br />
' ' '<br />
qy ( ) = 〈 cy ( ) cy ( + y) 〉 dy , where < > denotes averag<strong>in</strong>g over all particle pairs <strong>in</strong> <strong>the</strong> puff.<br />
(12)
With Richardson's diffusivity KDN <strong>in</strong> <strong>the</strong> diffusion equation above, a<br />
correspond<strong>in</strong>g Distance-Neighbor function could already <strong>in</strong> 1926 be<br />
predicted to be <strong>of</strong> <strong>the</strong> form<br />
c h 23<br />
)<br />
/<br />
q ∝ exp − y σ<br />
(13)<br />
This hypo<strong>the</strong>sis has only recently been confirmed experimentally, <strong>in</strong> <strong>the</strong><br />
water tank particle-track<strong>in</strong>g experiment performed by Ott and Mann<br />
(2000).<br />
Similar scal<strong>in</strong>g arguments can now be used to predict also <strong>the</strong> puff 's<br />
mean concentration pr<strong>of</strong>iles. While <strong>the</strong> diffusivity KC for <strong>the</strong> mean<br />
Puff<br />
puff concentration pr<strong>of</strong>ile, aga<strong>in</strong> for dimensional reasons, must be<br />
expected to take on <strong>the</strong> form (Mikkelsen et al., 2002):<br />
K C Puff<br />
∝<br />
R<br />
S|<br />
13 / 43 /<br />
ε σ<br />
T| ε13 / y 43 / for y ≥ σ<br />
σ Puff<br />
21<br />
u t<br />
∝ *<br />
for y ≤ σ<br />
C Puff ( y )<br />
<strong>the</strong> correspond<strong>in</strong>g puff mean concentration pr<strong>of</strong>ile becomes<br />
2/ 3<br />
Gaussian <strong>in</strong> <strong>the</strong> centre part cy<br />
σ ≤ 1h,<br />
and <strong>of</strong> <strong>the</strong> form exp<br />
−c y σh<br />
<strong>in</strong> <strong>the</strong> tails .<br />
cy<br />
σ ≥ 1h<br />
(14)<br />
However, <strong>the</strong>se new predictions for <strong>the</strong> puffs mean concentration pr<strong>of</strong>ile<br />
for <strong>the</strong> <strong>in</strong>ertial subrange still has to be evaluated experimentally.<br />
Example 2. Surface layer scal<strong>in</strong>g "u*” Lagrangian Similarity scal<strong>in</strong>g also<br />
applies to puff dispersion with<strong>in</strong> <strong>the</strong> atmosphere surface layer (SL). In<br />
<strong>the</strong> SL close to <strong>the</strong> ground (z < 100 meters), <strong>the</strong> proper similarity scal<strong>in</strong>g<br />
parameter for is <strong>the</strong> approximately constant shear stress velocity scale<br />
u* [m/s]. (Note that <strong>the</strong> dissipation rate ε [m 2 s -3 ] <strong>in</strong> <strong>the</strong> SL is a strong<br />
function <strong>of</strong> height z and <strong>the</strong>refore is <strong>in</strong>appropriate as SL scal<strong>in</strong>g<br />
2 −1<br />
Suv , ( k) ∝ u* k<br />
parameter. Near <strong>the</strong> ground, where u* is dom<strong>in</strong>ant (and constant), <strong>the</strong><br />
horizontal turbulent velocity spectra S u,v (k) must for dimensional<br />
reasons, have a subrange <strong>of</strong> <strong>the</strong> form (Tchen , 1959, Kadar et al., 1989):<br />
(15)<br />
An <strong>in</strong>stantaneous puff, released from <strong>the</strong> ground <strong>in</strong> this layer must<br />
consequently, accord<strong>in</strong>g to Lagrangian Similarity <strong>the</strong>ory, expand <strong>in</strong> <strong>the</strong>
surface layer, that is, at a l<strong>in</strong>ear expansion rate, as function <strong>of</strong> diffusion<br />
time t. This was predicted by P.G. Chatw<strong>in</strong> already <strong>in</strong> (1968).<br />
(16)<br />
Also a "K" diffusivity, based on <strong>the</strong> surface scal<strong>in</strong>g parameter u* , can be<br />
formed for <strong>the</strong> distance-neighbor function for a surface released puff,<br />
(Mikkelsen, Jørgensen, Nielsen and Ott, 2000):<br />
K u<br />
DN ∝ * y<br />
22<br />
(17)<br />
where y denotes <strong>the</strong> <strong>in</strong>stantaneous separation <strong>of</strong> any two-particles <strong>in</strong><br />
<strong>the</strong> puff.<br />
Aga<strong>in</strong> by use <strong>of</strong> <strong>the</strong> diffusion equation <strong>the</strong> predicted form <strong>of</strong> <strong>the</strong> twoparticle<br />
Distance-Neighbour function for a surface released puffs<br />
becomes<br />
)<br />
q ∝ − y<br />
c u th<br />
exp *<br />
(18)<br />
This exponential and self-similar form for <strong>the</strong> distance-neighbour<br />
function for surface released puffs has recently been confirmed<br />
experimentally (Mikkelsen et al 2002) from analysis <strong>of</strong> <strong>the</strong> MADONA<br />
surface layer smoke plume diffusion experiments (Cionco et al., 1999).<br />
Example 3. Enstrophy cascade subrange "Tc"<br />
As earlier mentioned, two-dimensional enstrophy cascade characterizes<br />
<strong>the</strong> atmospheres motion at <strong>the</strong> 1000- 10000 km scale. A s<strong>in</strong>gle<br />
characteristic time scale Tc [s] can be associated with cascade <strong>of</strong> eddy<br />
enstrophy (mean squared vorticity). Horizontal turbulent velocity<br />
spectra can both be predicted and measured to have <strong>the</strong> form (The GAP<br />
experiment; Nastrom and Gage, 1985)<br />
S k 1 T k<br />
uv , c ( ) ∝<br />
2 −3<br />
2 2 −<br />
K ∝ σ / T m s 1<br />
C Puff<br />
c<br />
(19)<br />
With<strong>in</strong> this global scale atmospheric subrange, puff's can be predicted to<br />
grow accord<strong>in</strong>g to an eddy diffusivity formed from <strong>the</strong> parameters:<br />
<strong>in</strong>stantaneous puff size σ and <strong>the</strong> enstrophy cascade time scale Tc , that<br />
is :<br />
(20)
The correspond<strong>in</strong>g predicted puff growth becomes<br />
exponential: σ ∝ exp(<br />
tT).<br />
Large scale cloud size observations (Gifford,<br />
Puff c<br />
, 1988) and numerical wea<strong>the</strong>r prediction embedded global multi-particle<br />
model results (Maryon and Buckland, 1995) give experimental and<br />
numerical support to this predicted exponential growth rate for puffs<br />
diffus<strong>in</strong>g with<strong>in</strong> <strong>the</strong> atmosphere's large scale enstrophy subrange.<br />
Similarity scal<strong>in</strong>g <strong>of</strong> σ parameters <strong>in</strong> Gaussian plume models.<br />
Table 3. Def<strong>in</strong>itions <strong>of</strong> common micro-meteorological scal<strong>in</strong>g<br />
quantities, based on similarity <strong>the</strong>ory. In addition to <strong>the</strong> def<strong>in</strong>itions given,<br />
ρ is density <strong>of</strong> standard air (~ 1 kg/ m 3) , cp (~1200 Joule/ Kg) is <strong>the</strong> airs<br />
specific heat at constant pressure, κ (~0.4) is <strong>the</strong> Von Karman constant,<br />
g is <strong>the</strong> gravity ( ~9.8 m/s 2 ), and T is <strong>the</strong> air temperature (~ 300 K).<br />
SIMILARITY SCALING PARAMETERS<br />
z : Puff height<br />
zi : Boundary layer height<br />
H0 : Surface heat flux [ ≡ ρ cw p 'θ'] u* : Surface sheer stress[ ≡ − uw ' ']<br />
LMO :<br />
3<br />
κT<br />
u*<br />
Mon<strong>in</strong>-Obukhov length [ ≡ − ]<br />
g w′<br />
θ′<br />
w * :<br />
g<br />
Free Convection velocity [ ≡ ( ′<br />
T<br />
′ ) zw i<br />
θ 1 3 ]<br />
The similarity scal<strong>in</strong>g concept is to base <strong>the</strong> calculations <strong>of</strong> plume spread<br />
on, <strong>in</strong> addition to <strong>the</strong> diffusion time t itself, <strong>the</strong> physical scal<strong>in</strong>g<br />
parameters that also govern <strong>the</strong> SL and ABL mean and turbulence<br />
pr<strong>of</strong>iles. In addition to <strong>the</strong> previously mentioned shear stress velocity<br />
scal<strong>in</strong>g parameters u* and <strong>the</strong> Mon<strong>in</strong> Obukhov stability parameter L, also<br />
<strong>the</strong> convective velocity scal<strong>in</strong>g parameter [w * g<br />
≡ ( ′ ′ ) ], and <strong>the</strong><br />
T<br />
boundary layer height zi becomes important scal<strong>in</strong>g parameters for<br />
diffusion, see Table 3. Physically <strong>in</strong>terpreted, L is <strong>the</strong> height above<br />
ground where <strong>the</strong> contribution from mechanically generated turbulence<br />
(by w<strong>in</strong>d sheer) <strong>in</strong> magnitude equals <strong>the</strong> contribution (or dra<strong>in</strong>) by<br />
zw i θ 1 3<br />
buoyancy generated (by heat transfer) turbulence.<br />
23
With <strong>the</strong> <strong>in</strong>troduction <strong>of</strong> Similarity scal<strong>in</strong>g <strong>in</strong> dispersion meteorology <strong>in</strong><br />
<strong>the</strong> 1980ties, <strong>the</strong> former (from about 1960 to <strong>the</strong> early 1980) stability<br />
class categories (A, B, C, D, E and F) are nowadays be<strong>in</strong>g progressively<br />
replaced by <strong>the</strong> cont<strong>in</strong>uous non-dimensional stability parameter: "z/L",<br />
where z is <strong>the</strong> height above <strong>the</strong> ground (release height). The well-known<br />
nomogrammes for <strong>the</strong> dispersion parameters reproduced <strong>in</strong> Fig. 3a ( for<br />
<strong>the</strong> lateral diffusion coefficients σy) and Figure 3 b(for <strong>the</strong> vertical<br />
diffusion coefficient σz) have subsequently be<strong>in</strong>g replaced by formulabased,<br />
similarity scal<strong>in</strong>g us<strong>in</strong>g <strong>the</strong> parameters (u*, L, zi, w*), <strong>of</strong> <strong>the</strong> form:<br />
σ x, y= σ u, vutFx, y( u* , w* , L, zi, z)<br />
σ = σ utF ( u , w , L, z , z)<br />
z w z * * i<br />
(21)<br />
(22)<br />
As an example, a similarity <strong>the</strong>ory based formula for <strong>the</strong> plume's vertical<br />
standard deviation dur<strong>in</strong>g unstable atmosphere from a ground level<br />
release is calculated as (Brandt et al., 1996a, 1996b) ):<br />
Inversion height and <strong>the</strong> daily stability cycle:<br />
σz 2 = 0.33 w* 2 t 2 + 1.2 u* 2 t 2 (23)<br />
Figure 4. Mix<strong>in</strong>g-height and mix<strong>in</strong>g-layer air pollution dur<strong>in</strong>g two<br />
consecutive days. The effect <strong>of</strong> <strong>the</strong> diurnal mix<strong>in</strong>g height cycle is<br />
affect<strong>in</strong>g <strong>the</strong> air pollution concentration (shad<strong>in</strong>g). (From ApSimon, 1980).<br />
24
The cyclic variation <strong>of</strong> <strong>the</strong> stability near <strong>the</strong> surface also causes a cyclic<br />
variation <strong>of</strong> <strong>the</strong> height <strong>of</strong> <strong>the</strong> <strong>in</strong>version height zi, i.e. <strong>the</strong> top <strong>of</strong> <strong>the</strong> ABL.<br />
Here, at zi <strong>the</strong>re is <strong>of</strong>ten observed <strong>in</strong> <strong>the</strong> summer time at least a strong<br />
temperature jump or <strong>in</strong>version layer, which marks <strong>the</strong> top <strong>of</strong> <strong>the</strong> ABL, and<br />
which pollutants cannot penetrate (because <strong>the</strong>re is no only little<br />
turbulence <strong>in</strong> <strong>the</strong> Troposphere above it, cf. <strong>the</strong> <strong>in</strong>troduction).<br />
Figure 4 (From ApSimon et al., 1980) shows that pollutants released at<br />
night time are diluted by <strong>the</strong> expansion <strong>of</strong> <strong>the</strong> mix<strong>in</strong>g height as <strong>the</strong> sun<br />
rises. At sunset, some <strong>of</strong> <strong>the</strong>se pollutants can rema<strong>in</strong> above <strong>the</strong> mix<strong>in</strong>g<br />
height, where <strong>the</strong>y will travel at high speed without practically any<br />
diffusion, as this layer is stable stratified. The next morn<strong>in</strong>g <strong>the</strong>se<br />
pollutants may aga<strong>in</strong> be entra<strong>in</strong>ed <strong>in</strong>to <strong>the</strong> mix<strong>in</strong>g layer and <strong>the</strong>reby<br />
contribute to <strong>the</strong> pollutant concentration at ground level somewhere else.<br />
Table 4. Typical values for <strong>the</strong> mix<strong>in</strong>g height as function <strong>of</strong> Pasquill class<br />
stability.<br />
Stability<br />
Zi [meters]<br />
A<br />
1300<br />
B<br />
900<br />
Table 4 shows <strong>the</strong> earlier simple scheme for estimation <strong>of</strong> <strong>the</strong> mix<strong>in</strong>g<br />
height <strong>in</strong> terms <strong>of</strong> Pasquill categories. In today's computerized dispersion<br />
modell<strong>in</strong>g systems, zi is easily accessible <strong>in</strong> real time from <strong>in</strong>vestigation <strong>of</strong><br />
<strong>the</strong> vertical temperature pr<strong>of</strong>iles <strong>in</strong> numerical wea<strong>the</strong>r prediction models<br />
used operationally to forecasts <strong>of</strong> w<strong>in</strong>d, temperature and precipitation<br />
around <strong>the</strong> clock at many national and <strong>in</strong>ternational meteorological<br />
services and wea<strong>the</strong>r research <strong>in</strong>stitutes. Alternatively, zi can be<br />
estimated locally from prognostic mix<strong>in</strong>g height algorithms based on local<br />
surface heat flux and upper air lapse rate measurements (Γupper), see e.g.<br />
(Batchvarova and Gryn<strong>in</strong>g , 1991).<br />
25<br />
C<br />
850<br />
D<br />
800<br />
E<br />
400<br />
F<br />
100
III Atmospheric Dispersion Models - Applications:<br />
<strong>Modell<strong>in</strong>g</strong> atmospheric dispersion is a large scientific, technological and<br />
eng<strong>in</strong>eer<strong>in</strong>g subject whose results depend on <strong>the</strong> different space and<br />
time scales <strong>in</strong> <strong>the</strong> atmosphere. As evident from <strong>the</strong> previous discussions<br />
<strong>of</strong> <strong>the</strong> many different scales <strong>in</strong> <strong>the</strong> atmosphere, dispersion <strong>of</strong> pollutants<br />
behaves differently on <strong>the</strong> various scales and is <strong>in</strong>fluenced by <strong>the</strong> <strong>in</strong>itial<br />
source dimension, <strong>the</strong> heat and momentum content <strong>of</strong> <strong>the</strong> release itself,<br />
by nearby build<strong>in</strong>gs, by down-w<strong>in</strong>d changes <strong>in</strong> surface roughness and<br />
surface heat fluxes (i.e. <strong>the</strong> atmospheric stability) and by transition through<br />
time and spatially chang<strong>in</strong>g layers. Additional effects <strong>of</strong> <strong>the</strong> terra<strong>in</strong><br />
<strong>in</strong>clude heterogeneous surfaces, hills, and even complex terra<strong>in</strong>.<br />
Atmospheric dispersion is <strong>in</strong> addition <strong>in</strong>fluenced by larger-scale differential<br />
heat<strong>in</strong>g (sea-and land breezes, up and down slope valley circulation's)<br />
and orographically <strong>in</strong>duced w<strong>in</strong>ds (such as Ch<strong>in</strong>ook w<strong>in</strong>ds, Santa Anna<br />
w<strong>in</strong>ds, Le Mistral, Cirocco w<strong>in</strong>ds etc)<br />
For practical applications modell<strong>in</strong>g, modellers <strong>of</strong>ten categorize<br />
atmospheric dispersion models accord<strong>in</strong>g to <strong>the</strong>ir type <strong>of</strong> application.<br />
Dispersion <strong>in</strong>clusive deposition modell<strong>in</strong>g is usually applied <strong>in</strong> <strong>the</strong> follow<strong>in</strong>g<br />
three ma<strong>in</strong> areas:<br />
1. Environmental impact studies<br />
2. Probabilistic Accident Consequence Assessments<br />
3. Real-time (i.e. <strong>in</strong> real time dur<strong>in</strong>g an accident) damage assessment<br />
and decision support<br />
The first and most widely used application is "Environmental impact<br />
studies". In this category, dispersion models are used for Government<br />
and regulatory bodies control and assessment on environmental loads<br />
com<strong>in</strong>g from <strong>in</strong>dustrial and energy production emissions. The second type<br />
<strong>of</strong> application is "probabilistic assessment studies" - where, for example,<br />
<strong>the</strong> annual mean or <strong>the</strong> monthly peak concentrations over an area are<br />
<strong>in</strong>vestigated. The third type <strong>of</strong> application for is a real-time assessment<br />
model; <strong>in</strong> which case <strong>the</strong> actual Pollution State or near future (e.g.<br />
tomorrows) Ozone impact is estimated. This is <strong>of</strong> <strong>in</strong>terest for <strong>the</strong> realtime<br />
monitor<strong>in</strong>g <strong>of</strong> pollution states, decision support concern<strong>in</strong>g accidents,<br />
and for assess<strong>in</strong>g <strong>the</strong> present or near future state <strong>of</strong> pollution.<br />
26
Dispersion modell<strong>in</strong>g has also high priority as emergency management<br />
support tools for decision-makers <strong>in</strong> charge <strong>of</strong> accident management. The<br />
dispersion models <strong>in</strong>volved need to provide forecasts or real time<br />
predictions so that decision-makers can alert people downstream to go<br />
<strong>in</strong>doors, and subsequently <strong>in</strong>itiate countermeasures based on <strong>the</strong><br />
predictions (e.g. distribute Iod<strong>in</strong>e tablets, relocate etc). In particular <strong>in</strong><br />
cases <strong>of</strong> chemical, biological and radioactive releases, whe<strong>the</strong>r <strong>the</strong>y are<br />
accidental or terrorists work, fast and reliable real-time atmospheric<br />
dispersion assessment is an important issue.<br />
Models may vary considerably <strong>in</strong> type and complexity depend<strong>in</strong>g on <strong>the</strong>ir<br />
specific goals. The most complex models may take too long to run, or<br />
require too much <strong>in</strong>put data <strong>in</strong> a real emergency, <strong>in</strong> which case a simple<br />
but good quality model may be much more practical and still provide <strong>the</strong><br />
answers urgently needed by <strong>the</strong> decision makers exercis<strong>in</strong>g emergency<br />
management. It is also a fact that complex models are not always<br />
significantly more accurate than simpler models, - and that no model<br />
produces results <strong>of</strong> a quality better than <strong>the</strong> quality <strong>of</strong> <strong>the</strong> <strong>in</strong>put data<br />
<strong>the</strong>y require to work. The "bon-mot" amongst modeller’s "Garbage <strong>in</strong> -<br />
garbage out", reflects this fact. To make sense, <strong>the</strong> models embedded<br />
"physics" and <strong>the</strong> quality <strong>of</strong> <strong>the</strong> meteorological <strong>in</strong>put data have to match<br />
one o<strong>the</strong>r.<br />
Practical Atmospheric Dispersion Models<br />
Except for <strong>the</strong> simple Gauss plume model already mentioned <strong>in</strong> section II<br />
(See "Analytical solutions to <strong>the</strong> diffusion equation"), modell<strong>in</strong>g dispersion<br />
usually <strong>in</strong>volves both a w<strong>in</strong>d (flow) model, and a diffusion (spread) model.<br />
A gallery based on historical order <strong>of</strong> appearance is presented next. The<br />
gallery also reflects <strong>the</strong> <strong>in</strong>crease <strong>in</strong> "Complexity", as models evolve from<br />
<strong>the</strong> Gaussian plume modes and become <strong>in</strong>creas<strong>in</strong>gly computer-heavy to<br />
operate.<br />
Dispersion Model Gallery:<br />
Gaussian plume and puff models. Start<strong>in</strong>g with <strong>the</strong> Gaussian plume<br />
models at as <strong>the</strong> earliest and most simple <strong>in</strong> this category, Gaussian type<br />
models subsequently spans over <strong>the</strong> "Segmented Gaussian plume models",<br />
<strong>the</strong>n over simple Lagrangian puff models, <strong>the</strong>n over <strong>the</strong> more complex<br />
27
Puff model based dispersion models, some <strong>of</strong> which, although <strong>the</strong>y are<br />
still formulae-based, <strong>in</strong>clude advanced features such as "puff-splitt<strong>in</strong>g"<br />
to be used <strong>in</strong> connection with moderate complex terra<strong>in</strong>.<br />
W<strong>in</strong>d data to drive <strong>the</strong> Gaussian plume model can come from a s<strong>in</strong>gle po<strong>in</strong>t<br />
measurement <strong>of</strong> w<strong>in</strong>d speed and direction and is assumed to apply for <strong>the</strong><br />
entire doma<strong>in</strong> (cf. <strong>the</strong> simple Gaussian plume model). This is only a useful<br />
approximation over flat and homogeneous terra<strong>in</strong> and dur<strong>in</strong>g long last<strong>in</strong>g<br />
stationary conditions.<br />
The first puff models relied on w<strong>in</strong>d fields generated from so-called<br />
"<strong>in</strong>terpolation rout<strong>in</strong>es" which were based on two or more observations <strong>in</strong><br />
<strong>the</strong> nearby terra<strong>in</strong>. The result<strong>in</strong>g w<strong>in</strong>d fields are "diagnostic" imply<strong>in</strong>g<br />
that <strong>the</strong>y "now- cast" <strong>the</strong> w<strong>in</strong>ds based on present (on-l<strong>in</strong>e connected)<br />
meteorological sensors.<br />
In addition, <strong>in</strong> <strong>the</strong> early eighties, several dispersion modell<strong>in</strong>g groups<br />
made mass-consistent <strong>in</strong>terpolation schemes <strong>in</strong> which <strong>in</strong>itially guessed or<br />
<strong>in</strong>terpolated w<strong>in</strong>ds field was made "divergence-free". Some models <strong>of</strong> this<br />
type <strong>in</strong>clude a vertical stratification relevant for stable flow regime flows<br />
over vary<strong>in</strong>g terra<strong>in</strong>.<br />
Start<strong>in</strong>g <strong>in</strong> <strong>the</strong> mid-1980s, practical and fast w<strong>in</strong>d models emerged<br />
suitable for puff advection over heterogeneous terra<strong>in</strong>. These w<strong>in</strong>d<br />
models are based on l<strong>in</strong>earized versions <strong>of</strong> <strong>the</strong> Navier-stokes<br />
conservation equations for mass and momentum <strong>in</strong> <strong>the</strong> BL. L<strong>in</strong>earized w<strong>in</strong>d<br />
and turbulence models nowadays exists for flow over hills, roughness<br />
change, and <strong>the</strong>rmal stratification's such as valley breeze and sea breeze<br />
effects [Astrup et al, 2001, Mikkelsen et al, 2000, Dunkerley 2001]. The<br />
CPU-time required runn<strong>in</strong>g <strong>the</strong>se l<strong>in</strong>earized models is very modest.<br />
Lagrangian Particle Models. At <strong>the</strong> next level <strong>of</strong> complication, <strong>the</strong><br />
Lagrangian particle model type is one level up from <strong>the</strong> puff-model <strong>in</strong><br />
complexity. Be<strong>in</strong>g particle-type models <strong>the</strong>y typically requires a large<br />
number <strong>of</strong> particles to build up some statistical significance <strong>in</strong> <strong>the</strong><br />
simulation.<br />
Eulerian Grid Models. Eulerian grid models solve <strong>the</strong> diffusion equation<br />
<strong>in</strong>clud<strong>in</strong>g transfer (advection) <strong>of</strong> pollutants over a large number <strong>of</strong> grid<br />
po<strong>in</strong>ts- typically <strong>of</strong> <strong>the</strong> order 100 by 100 for each horizontal layer. In<br />
addition, some 10-30 vertical layers are <strong>of</strong>ten used to model <strong>the</strong> vertical<br />
28
structure <strong>of</strong> <strong>the</strong> diffusion. In pr<strong>in</strong>ciple, Eulerian grid models are mass<br />
conserv<strong>in</strong>g algorithms (by solv<strong>in</strong>g <strong>the</strong> diffusion equation <strong>in</strong> a 3-d grid) -<br />
but <strong>the</strong> diffusivity, called Kz is used to parameterise <strong>the</strong> vertical spread<br />
dur<strong>in</strong>g different stability categories, or nowadays, as prescribed by<br />
similarity scal<strong>in</strong>g (e.g. Mikkelsen, 1995).<br />
In addition, w<strong>in</strong>d and turbulence equations can be embedded <strong>in</strong> Eulerian<br />
grid models, <strong>of</strong> which some are hydrostatic, and o<strong>the</strong>rs are nonhydrostatic.<br />
The latter is <strong>in</strong>cluded to accommodate important pressure<br />
features aris<strong>in</strong>g from flows over complex terra<strong>in</strong> at <strong>the</strong> local scale.<br />
Fur<strong>the</strong>rmore, some Eulerian based Mesoscale models (e.g. <strong>the</strong> US based<br />
RAMS model or <strong>the</strong> European-German KAMM model) are "Prognostic",<br />
that is, from a given <strong>in</strong>itial state, <strong>the</strong>y are able to make predictions <strong>of</strong><br />
<strong>the</strong> future w<strong>in</strong>d, temperature and <strong>the</strong>reby also <strong>the</strong> pollution pattern. To<br />
run such a comb<strong>in</strong>ed Mesoscale wea<strong>the</strong>r and dispersion model, significant<br />
computational and model specific <strong>in</strong>sight is required by <strong>the</strong> user. Highresolution<br />
Eulerian grid models may locally complement or nest with large<br />
scale wea<strong>the</strong>r forecast model outputs as provided by <strong>the</strong> national or<br />
<strong>in</strong>ternational numerical forecast<strong>in</strong>g centres, for <strong>in</strong>stance to predict <strong>the</strong><br />
evolution <strong>of</strong> a local sea-breeze evolution.<br />
Most recent and most complex Models Over <strong>the</strong> last two decades, more<br />
computer heavy dispersion simulation tools have emerged. They pr<strong>in</strong>cipally<br />
solve <strong>the</strong> atmospheric boundary layer approximated Navier-Stoke fluid<br />
equations for conservation <strong>of</strong> mass, momentum, and heat, <strong>in</strong>clud<strong>in</strong>g<br />
constituencies (pollution). However, <strong>the</strong>ir uses for practical applications<br />
are limited by <strong>the</strong>ir complexity and huge computational requirements. The<br />
methods <strong>in</strong>clude:<br />
Large Eddy Simulation LES. LES models solve <strong>the</strong> full un-truncated<br />
Navier Stokes equations on a Cartesian three-dimensional grid, but rely<br />
on a sub-grid scale parameterisation <strong>of</strong> <strong>the</strong> turbulence dissipation. They<br />
are particular suitable for studies <strong>of</strong> <strong>the</strong> unstable (convective) BL<br />
diffusion.<br />
Computational Fluid Dynamic CFD. CFD represent fluid dynamical<br />
numerical codes that can solve <strong>the</strong> mean flow and diffusion field over a<br />
pre-described configuration, e.g. a group <strong>of</strong> build<strong>in</strong>gs. They are aga<strong>in</strong><br />
based on <strong>the</strong> full set <strong>of</strong> Navier-Stokes conservation equations, but rely on<br />
" K-ε closures", that is on generalized K diffusivities.<br />
29
Direct Numerical Simulation DNS. DNS methods symbolize full and untruncated<br />
solutions <strong>of</strong> <strong>the</strong> Navier-Stokes equations <strong>in</strong>clud<strong>in</strong>g particle<br />
track<strong>in</strong>g on all scales. As <strong>the</strong> smallest scale <strong>of</strong> relevance for atmospheric<br />
dispersion is <strong>the</strong> Kolmogorov microscale (<strong>of</strong> <strong>the</strong> order <strong>of</strong> ~1 mm) it is<br />
evident that DNS methods are not relevant for atmospheric dispersion,<br />
where scales are rang<strong>in</strong>g from meters to thousand <strong>of</strong> km, cf. Figure1.<br />
Aga<strong>in</strong>, nei<strong>the</strong>r DNS nor LES type models are suited for direct practical<br />
real-time air pollution control or emergency assessments, but should<br />
ra<strong>the</strong>r be considered as research tools.<br />
On-l<strong>in</strong>e Numerical Wea<strong>the</strong>r Prediction w<strong>in</strong>ds for dispersion<br />
Numerical wea<strong>the</strong>r forecast data are today available to dispersion<br />
modeller’s for download from <strong>the</strong> world’s national and <strong>in</strong>ternational<br />
wea<strong>the</strong>r forecast centres.<br />
Limited Area Models (LAM) with an <strong>in</strong>ternal grid resolution down to ~10 x<br />
10 km grid resolution, and with <strong>in</strong>ternal time steps <strong>of</strong> <strong>the</strong> order <strong>of</strong><br />
m<strong>in</strong>utes, produce regional scale (e.g. Europe) forecasts with a forecast<br />
length up to + 36 or + 48 hours.<br />
As an example <strong>the</strong> jo<strong>in</strong>t Scand<strong>in</strong>avian- European corporation project<br />
HIRLAM (for HIgh Resolution Limited Area Model) wea<strong>the</strong>r prediction<br />
code operates at several European national Met <strong>of</strong>fices. HIRLAM is a<br />
complete 3-D regional atmospheric forecast<strong>in</strong>g system. With<strong>in</strong> a vertical<br />
resolved grid conta<strong>in</strong><strong>in</strong>g some thirty levels, and runn<strong>in</strong>g around <strong>the</strong> clock<br />
<strong>in</strong> a 6 hour updated data-assimilation cycle, HIRLAM produces w<strong>in</strong>d,<br />
temperature, humidity and precipitation + 48 hours ahead.<br />
Numerical wea<strong>the</strong>r forecasts <strong>of</strong> local w<strong>in</strong>ds and stability are nowadays onl<strong>in</strong>e<br />
available <strong>in</strong> Europe for use with local scale atmospheric dispersion<br />
forecasts. For <strong>in</strong>stance are HIRLAM produced local w<strong>in</strong>d and<br />
precipitation forecasts today operationally accessible for local scale<br />
dispersion calculations with<strong>in</strong> two European Emergency management<br />
decision support systems, RODOS and ARGOS (Mikkelsen, 2000).<br />
30
Atmospheric dispersion module for nuclear releases<br />
Prediction and assessment <strong>of</strong> <strong>the</strong> atmospheric transport <strong>of</strong> radionuclides<br />
released from a nuclear accident requires many different discipl<strong>in</strong>es,<br />
<strong>in</strong>clud<strong>in</strong>g plume rise, w<strong>in</strong>dborne transport and turbulent mix<strong>in</strong>g, irradiation<br />
from puffs and plumes, and deposition (both wet and dry), see Figure 5.<br />
Figure 5 In case <strong>of</strong> a nuclear release is <strong>the</strong> actual wea<strong>the</strong>r (real-time)<br />
and associated atmospheric dispersion <strong>of</strong> uttermost importance for<br />
actual transfer <strong>of</strong> radionuclides to <strong>the</strong> environment. Many discipl<strong>in</strong>es are<br />
<strong>in</strong>volved (From: European Commission - Safeguard<strong>in</strong>g Europe's Citizens).<br />
We end this Chapter with a practical Example <strong>of</strong> a contemporary Nested<br />
Atmospheric dispersion Module nowadays under development and<br />
dissem<strong>in</strong>ation for Practical Emergency Preparedness <strong>in</strong> Europe. For a<br />
review <strong>of</strong> <strong>the</strong> correspond<strong>in</strong>g American approach see e.g. Kramer and<br />
Porch( 1990).<br />
The Met-RODOS Atmospheric Dispersion Module for Real-time<br />
Decision Support<br />
In Europe, an on-l<strong>in</strong>e atmospheric dispersion modell<strong>in</strong>g system called Met-<br />
RODOS has recently been developed and serves now as central part <strong>of</strong><br />
<strong>the</strong> jo<strong>in</strong>t European decision support system for nuclear emergencies<br />
called RODOS. [Ehrhardt et al., 1997]. The Met-RODOS module<br />
[Mikkelsen, 2000] provides <strong>the</strong> decision support system with an<br />
31
<strong>in</strong>tegrated atmospheric transport module for now- and forecast<strong>in</strong>g <strong>of</strong><br />
radioactive airborne spread on all ranges (local, national, and European<br />
scales), and it <strong>in</strong>corporates local (on-site) wea<strong>the</strong>r stations and remote<br />
numerical wea<strong>the</strong>r prediction data from national wea<strong>the</strong>r services.<br />
The MET-RODOS dispersion module has three sub-systems:<br />
• A Local-Scale Pre-processor LSP,<br />
• A Local-Scale Model Cha<strong>in</strong> LSMC, and<br />
• A Long-Range Model Cha<strong>in</strong> LRMC<br />
A graphical overview <strong>of</strong> <strong>the</strong> Met-RODOS atmospheric dispersion module<br />
is shown <strong>in</strong> Figure 6 (from Mikkelsen et al., 1997). The systems detailed<br />
functionality specifications are described <strong>in</strong> Mikkelsen et al. (1998).<br />
Real -time<br />
RO DO S<br />
Shared<br />
Memory<br />
Sodar’ s<br />
On-site<br />
Met-<br />
Towers<br />
Off-site<br />
RODOS INTEGRATED DISPERSION MODULES:<br />
ATSTEP RIM PUFF<br />
N<br />
W<br />
P<br />
ON-LINE MET-DATA INTERFACE & STORAGE<br />
PAD SUB’ S<br />
Local Scale<br />
Pre-processor<br />
u*<br />
z/L<br />
Zi<br />
A,B,C<br />
x<br />
x<br />
x<br />
x<br />
I O I<br />
I O<br />
LINCOM provides<br />
W<strong>in</strong>d & Turbulence grid fields over:<br />
Topograph Roughness<br />
+4<br />
Hr<br />
10Co<br />
o 15Co<br />
20C<br />
Thermal<br />
Long-<br />
Range<br />
Model<br />
Cha<strong>in</strong><br />
Figure 6. The MET-RODOS real-time atmospheric dispersion forecast<strong>in</strong>g<br />
system with pre-processors and <strong>in</strong>tegrated local-scale and long-range<br />
model cha<strong>in</strong>s.<br />
32<br />
M<br />
A<br />
T<br />
C<br />
H
LSP is a local scale pre-process<strong>in</strong>g program that ma<strong>in</strong>ta<strong>in</strong>s <strong>the</strong> local-scale<br />
system with actual and forecast local scale w<strong>in</strong>d fields and correspond<strong>in</strong>g<br />
micro-meteorological scal<strong>in</strong>g parameters by real-time pre-process<strong>in</strong>g and<br />
use <strong>of</strong> <strong>the</strong> local scale w<strong>in</strong>d models.<br />
LSMC is a nested local scale model cha<strong>in</strong>, which conta<strong>in</strong>s a suite <strong>of</strong><br />
different local scale mean w<strong>in</strong>d and dispersion models, from which casespecific<br />
models are selected depend<strong>in</strong>g on <strong>the</strong> actual topography and<br />
atmospheric stability features <strong>in</strong> question. It provides ground level air<br />
concentrations (<strong>in</strong> [Bq/m 3 ]) and concentration <strong>of</strong> deposited isotopes (<strong>in</strong><br />
[Bq/m 2 ]), and ground level gamma dose rates (<strong>in</strong> Grays per second [Gy/s])<br />
for subsequent use by <strong>the</strong> RODOS system. When clouds are leav<strong>in</strong>g <strong>the</strong><br />
outer bounds <strong>of</strong> <strong>the</strong> local scale doma<strong>in</strong> (variable from 20 km to 160 km),<br />
diffusion specific parameters such as cloud size, content and position is<br />
passed on to <strong>the</strong> long-range model cha<strong>in</strong> LRMC.<br />
LRMC is a system nested long-range model cha<strong>in</strong>, which manages <strong>the</strong><br />
dispersion and fallout assessments on national and European scales. Near<br />
surface air concentrations (<strong>in</strong> [Bq/m 3 ]) and <strong>in</strong>tegrated depositions <strong>of</strong><br />
isotopes (<strong>in</strong> [Bq/m 2 ]) are provided as outputs. Input data consists <strong>of</strong><br />
numerical wea<strong>the</strong>r prediction data from numerical wea<strong>the</strong>r prediction,<br />
which provides <strong>the</strong> long-range dispersion system with <strong>the</strong> actual and<br />
forecast atmospheric state and motion on meso and synoptic scales. The<br />
MET-RODOS module fur<strong>the</strong>rmore conta<strong>in</strong>s real-time databases for onl<strong>in</strong>e<br />
available Met-tower observations and a Numerical Wea<strong>the</strong>r<br />
Prediction (NWP) data.<br />
Prognostic Computer-based Decision Support Systems. MET-RODOS is<br />
realised as an <strong>in</strong>tegral part <strong>of</strong> <strong>the</strong> RODOS operational system. Mode and<br />
time control, data management, user <strong>in</strong>put and graphics control are all<br />
handled via <strong>the</strong> RODOS Operat<strong>in</strong>g Subsystem. As <strong>in</strong>dicated <strong>in</strong> Figure6, <strong>the</strong><br />
MET-RODOS module communicates with <strong>the</strong> operat<strong>in</strong>g system via shared<br />
memory and <strong>in</strong>teracts directly with <strong>the</strong> RODOS systems <strong>in</strong>tegrated realtime<br />
databases. Source terms are provided accident specific from <strong>the</strong><br />
RODOS real-time database, while meteorological data are downloaded <strong>in</strong><br />
background via on-l<strong>in</strong>e networks. The outputs <strong>of</strong> MET-RODOS module (dose<br />
rates from air and ground deposited material) are archived and displayed<br />
via <strong>the</strong> RODOS GUIs The type <strong>of</strong> radio-ecological "End po<strong>in</strong>ts" <strong>the</strong> Met-<br />
RODOS system provides is listed <strong>in</strong> Table 6.<br />
33
Table 5: Typical end-po<strong>in</strong>t quantities from <strong>the</strong> atmospheric dispersion<br />
module <strong>in</strong> a nuclear emergency decision support system.<br />
Instantaneous Air concentrations [Bq/m 3 ]<br />
Time <strong>in</strong>tegrated air concentrations [Bq s/m 3 ]<br />
Ground level deposits [Bq/m 2 ]<br />
Ground level gamma dose rates [Gray/ Hour]<br />
Onl<strong>in</strong>e meteorological <strong>in</strong>put data from met-towers. Real-time<br />
application <strong>of</strong> <strong>the</strong> system requires an on-l<strong>in</strong>e connection to quality realtime<br />
measurements <strong>of</strong> local meteorological quantities (w<strong>in</strong>d, direction,<br />
stability etc). Such data must be available from at least one nearby and<br />
on-l<strong>in</strong>e connected Met-tower <strong>in</strong> <strong>the</strong> vic<strong>in</strong>ity <strong>of</strong> <strong>the</strong> release po<strong>in</strong>t (onsite).For<br />
application <strong>of</strong> <strong>the</strong> system on distances beyond <strong>the</strong> local 10 (20)<br />
km) scale, on-l<strong>in</strong>e meteorological measurements from with<strong>in</strong> <strong>the</strong> regional<br />
(100-km scale) such as w<strong>in</strong>d and temperature conditions must also be<br />
provided <strong>the</strong> MET-RODOS module for “now-cast<strong>in</strong>g” <strong>of</strong> <strong>the</strong> plume travel<br />
and spread <strong>in</strong> real time.<br />
Real-time numerical wea<strong>the</strong>r prediction data. Forecast<strong>in</strong>g <strong>in</strong> time<br />
requires that numerical wea<strong>the</strong>r prediction data is available to <strong>the</strong><br />
system. Such wea<strong>the</strong>r forecast data can be downloaded via <strong>the</strong> Internet<br />
from national or <strong>in</strong>ternational meteorological forecast<strong>in</strong>g services. For<br />
Europe, Numerical wea<strong>the</strong>r prediction (NWP) data have become available<br />
via <strong>the</strong> Internet <strong>in</strong> high spatial and temporal resolution (8 –50 km<br />
horizontal grid resolution at three (and <strong>in</strong> some cases one) hour time<br />
<strong>in</strong>tervals up to typically +72 hours. The Met-RODOS system has been<br />
operated over a two-year test period with on-l<strong>in</strong>e NWP data provided by<br />
<strong>the</strong> Danish Meteorological Institute's DMI-HIRLAM forecast model<br />
(Sass, 1994).<br />
Atmospheric dispersion models <strong>in</strong> Met-RODOS: The Local Scale Model<br />
Cha<strong>in</strong> (LSMC) is a real-time atmospheric dispersion system for predict<strong>in</strong>g<br />
<strong>the</strong> spread <strong>of</strong> airborne materials (primarily radioactive isotopes, but also<br />
bacteria and viruses and chemical substances) <strong>in</strong> <strong>the</strong> vic<strong>in</strong>ity <strong>of</strong> <strong>the</strong>ir<br />
release po<strong>in</strong>t, i.e. with<strong>in</strong> ~100 km (local and regional scale) from <strong>the</strong><br />
source po<strong>in</strong>t<br />
34
It consists <strong>of</strong> nested modules, which may be grouped <strong>in</strong>to two ma<strong>in</strong> subsystems:<br />
• <strong>the</strong> LSP,<br />
• The Risø Meso-scale Puff dispersion model: RIMPUFF.<br />
The pre-processor LSPAD reads on-l<strong>in</strong>e meteorological data or numerical<br />
wea<strong>the</strong>r prediction data for "now-cast" or "forecast" simulations, <strong>the</strong>n<br />
<strong>in</strong>terpolates/extrapolates <strong>the</strong>se data onto <strong>the</strong> po<strong>in</strong>ts <strong>of</strong> <strong>the</strong> calculation<br />
grid cover<strong>in</strong>g <strong>the</strong> area <strong>of</strong> <strong>in</strong>terest, and calculates <strong>the</strong> fields <strong>of</strong> derived<br />
parameters needed by <strong>the</strong> puff dispersion model RIMPUFF. Local landuse<br />
data and local topography, with less than one kilometre resolution is<br />
available to <strong>the</strong> system from satellite remote sens<strong>in</strong>g, Thykier-Nielsen<br />
and Hasager (2000).<br />
RIMPUFF reads <strong>the</strong> source data and <strong>the</strong> data fields <strong>of</strong> LSP, and performs<br />
<strong>the</strong> calculations <strong>of</strong> dispersion, deposition, and, for radioactive isotopes,<br />
gamma-doses. It handles a high number <strong>of</strong> radioactive isotopes released<br />
simultaneously, <strong>in</strong>clud<strong>in</strong>g decay and generation <strong>of</strong> daughter products.<br />
On-l<strong>in</strong>e meteorological <strong>in</strong>put data. Real-time application <strong>of</strong> <strong>the</strong> model<br />
cha<strong>in</strong> requires an on-l<strong>in</strong>e connection to real-time measurements <strong>of</strong> local<br />
meteorological quantities (w<strong>in</strong>d speed and direction, temperature,<br />
temperature gradient, and ra<strong>in</strong> <strong>in</strong>tensity), or to up to date numerical<br />
wea<strong>the</strong>r prediction (NWP) data. With <strong>the</strong> latter, dispersion forecast can<br />
be made. Data must be available for at least one Met-tower or one NWP<br />
grid node near <strong>the</strong> release po<strong>in</strong>t (on-site). For application <strong>of</strong> <strong>the</strong> system<br />
on distances beyond <strong>the</strong> local (10-20) km scale, on-l<strong>in</strong>e meteorological<br />
measurements from with<strong>in</strong> <strong>the</strong> regional (100 km) scale or a larger number<br />
<strong>of</strong> NWP po<strong>in</strong>ts can be used. For test purposes, LSMC was set up to<br />
automatically <strong>in</strong>terface with wea<strong>the</strong>r data downloaded from <strong>the</strong> Danish<br />
Meteorological Institutes high resolution limited area model DMI-<br />
HIRLAM (Sass, 1994).<br />
The Local Scale Pre-processor (LSP). The pre-processor calculates all<br />
necessary mean and turbulence scal<strong>in</strong>g parameters for <strong>the</strong> dispersion<br />
modes on a high- resolution grid (typically 100 meters x 100 meters) for<br />
subsequent use by <strong>the</strong> atmospheric dispersion model. In addition to w<strong>in</strong>d<br />
speed, direction and temperature, also turbulence scal<strong>in</strong>g parameters<br />
(friction velocity and Mon<strong>in</strong>-Obukhov length), stability category, mix<strong>in</strong>g<br />
35
height is generated for each 10-m<strong>in</strong> time step. Local scale w<strong>in</strong>d and<br />
turbulence fields are generated from <strong>the</strong> LSP-embedded LINCOM model.<br />
L<strong>in</strong>earized mean and turbulence w<strong>in</strong>d models LINCOM<br />
Detailed modell<strong>in</strong>g <strong>of</strong> <strong>the</strong> w<strong>in</strong>d and turbulence fields on <strong>the</strong> local scale is<br />
important for prediction <strong>of</strong> <strong>the</strong> trajectory-directions and <strong>the</strong> time <strong>of</strong><br />
arrival <strong>of</strong> radioactive clouds travers<strong>in</strong>g hilly terra<strong>in</strong> and heterogeneous<br />
surfaces (e.g. over land-water-land <strong>in</strong>terfaces).<br />
LINCOM is a fast diagnostic mean w<strong>in</strong>d model based on l<strong>in</strong>earized Navier-<br />
Stokes equations for mass and momentum conservation, us<strong>in</strong>g a first<br />
order spectral turbulent diffusion closure. Local scale grid files<br />
consist<strong>in</strong>g <strong>of</strong> mean w<strong>in</strong>d and turbulence (u*) fields are In LINCOM<br />
modelled with respect to: local topography (Troen and de Baas, 1986], 2)<br />
<strong>the</strong> surface aerodynamic roughness [Astrup et a1, 1997], and 3) <strong>the</strong><br />
vertical <strong>the</strong>rmal stratification <strong>of</strong> <strong>the</strong> atmosphere [Moreno et al 1994], 4)<br />
local sea breeze effects [Dunkerley et al., 2001]. Figure 7 shows LINCOM<br />
generated fields <strong>of</strong> w<strong>in</strong>d speed and turbulence over Nor<strong>the</strong>rn Zealand,<br />
Denmark.<br />
Figure 7: Met-RODOS Pre-processor generated fields over Nor<strong>the</strong>rn<br />
Zealand - Denmark, on a 0.5 km * 0.5 km grid. left: Roughness distribution<br />
(z0); mid: LINCOM-z0 mean w<strong>in</strong>d field (U); right: LINCOM-z0 generated<br />
turbulence w<strong>in</strong>d field (u*).<br />
Pasquill-Gifford Stability, Similarity Scal<strong>in</strong>g and Mix<strong>in</strong>g Height.<br />
With<strong>in</strong> LSMC, <strong>the</strong> stability parameters are calculated at each grid node<br />
accord<strong>in</strong>g to <strong>the</strong> local velocity and turbulence levels, comb<strong>in</strong>ed with <strong>the</strong><br />
temperature gradient at <strong>the</strong> nearest measurement station or numerical<br />
wea<strong>the</strong>r prediction (NWP) node po<strong>in</strong>t. Due to <strong>the</strong> large discrepancies<br />
between temperature gradients over land and over water, stability over<br />
36
land uses <strong>the</strong> nearest land-based Met-station or NWP po<strong>in</strong>t, and over<br />
water, <strong>the</strong> nearest water-based station is used.<br />
Mix<strong>in</strong>g height determ<strong>in</strong>ation. In LSP, <strong>the</strong> friction velocity and Mon<strong>in</strong>-<br />
Obukhov length are calculated follow<strong>in</strong>g <strong>the</strong> descriptions given by van<br />
Ulden and Holtslag (1985), and <strong>the</strong> mix<strong>in</strong>g height is taken as <strong>the</strong> maximum<br />
<strong>of</strong> <strong>the</strong> mechanical mix<strong>in</strong>g height accord<strong>in</strong>g to <strong>the</strong> model <strong>of</strong> Nieuwstadt,<br />
1980 and <strong>the</strong> convective mix<strong>in</strong>g height (Batchvarova and Gryn<strong>in</strong>g, 1991)<br />
Alternatively, if high quality NPW data are available, <strong>in</strong>version height zi is<br />
determ<strong>in</strong>ed from a critical bulk Richardson number (Sørensen et al. 1996.)<br />
The puff dispersion model RIMPUFF. RIMPUFF, <strong>the</strong> systems local scale<br />
puff diffusion model [Mikkelsen et al.(1984); Mikkelsen et al. (1997);<br />
Mikkelsen et al. (1998)], provides a detailed real-time simulation <strong>of</strong> <strong>the</strong><br />
actual atmospheric dispersion scenario by account<strong>in</strong>g for local changes <strong>in</strong><br />
dispersion characteristics <strong>in</strong> both time and space. RIMPUFF is based on<br />
Lagrangian track<strong>in</strong>g <strong>of</strong> a number <strong>of</strong> dispers<strong>in</strong>g puffs, where each puff<br />
represents an <strong>in</strong>stantaneous released amount <strong>of</strong> isotopes, <strong>the</strong><br />
concentration pr<strong>of</strong>ile <strong>of</strong> which is approximated with a Gaussian pr<strong>of</strong>ile.<br />
RIMPUFF has puff-splitt<strong>in</strong>g features such as "pentafurcation" (horizontal<br />
split <strong>of</strong> a puff <strong>in</strong>to five m<strong>in</strong>or puffs) and "trifurcation" (vertical split <strong>of</strong> a<br />
puff <strong>in</strong>to three m<strong>in</strong>or puffs) for improv<strong>in</strong>g its dispersion modell<strong>in</strong>g with<br />
horizontal w<strong>in</strong>d shear and shear effects over <strong>in</strong>version layers, but also<br />
for dispersion over terra<strong>in</strong> caus<strong>in</strong>g channell<strong>in</strong>g. The advection and growth<br />
<strong>of</strong> each puff uses typically time steps <strong>of</strong> ~ 10 second and are calculated<br />
with <strong>the</strong> local w<strong>in</strong>d and turbulence fields as provided by LSP. All diffusion<br />
and deposition calculation with<strong>in</strong> RIMPUFF is formula-based<br />
(parameterised). For <strong>the</strong> puffs dispersion parameters σy and σz, three<br />
different parameterization options are <strong>in</strong>cluded, depend<strong>in</strong>g on <strong>the</strong> release<br />
type:<br />
1. Karlsruhe-Jülich plume parameters: Release height and distance<br />
dependent 1-hour averaged plume sigma's.<br />
2. Risø <strong>in</strong>stantaneous <strong>in</strong>stant puff-diffusion sigma's (no averag<strong>in</strong>g).<br />
3. Similarity-<strong>the</strong>ory scaled plume-sigma's (averag<strong>in</strong>g time 10 m<strong>in</strong>utes to 1<br />
hour).<br />
In RIMPUFF, dry deposition accounts for deposition <strong>of</strong> different<br />
chemical forms <strong>of</strong> <strong>the</strong> dispersed material, e.g. iod<strong>in</strong>e vapour (elementary<br />
iodide) and iod<strong>in</strong>e aerosols. Deposition velocities fur<strong>the</strong>rmore depend on<br />
land use.<br />
37
Figure8:<br />
Deposition footpr<strong>in</strong>t<br />
simulation by RIMPUFF <strong>of</strong> a<br />
deposit<strong>in</strong>g 137 Cs plumes from a<br />
simulated accident at <strong>the</strong><br />
Ignal<strong>in</strong>a NPP; Lithuanian.<br />
Figure 8 shows a RIMPUFF calculated footpr<strong>in</strong>t <strong>of</strong> deposited<br />
radioactivity from a 137 Cs plume from <strong>the</strong> Ignal<strong>in</strong>a NPP. Dur<strong>in</strong>g <strong>the</strong> plume<br />
passage, <strong>the</strong> deposition rate varies accord<strong>in</strong>g to <strong>the</strong> local surface<br />
characteristics (land, water, forest, urban, etc.).<br />
Figure 9<br />
Simulations <strong>of</strong><br />
cont<strong>in</strong>uous plume<br />
dispersion from <strong>the</strong><br />
Met-tower at <strong>the</strong><br />
Risø National<br />
Laboratory,<br />
Roskilde, Denmark,<br />
dur<strong>in</strong>g a period with<br />
strong vertical w<strong>in</strong>ddirectional<br />
shear.<br />
Solid curves:<br />
account<strong>in</strong>g for w<strong>in</strong>d<br />
shear (by RIMPUFF<br />
model features<br />
shear rise and<br />
trifurcation), dotted curves: ignor<strong>in</strong>g <strong>the</strong> w<strong>in</strong>d shear effects.<br />
38
Ano<strong>the</strong>r example, show<strong>in</strong>g <strong>the</strong> effect <strong>of</strong> strong vertical directional shear,<br />
is shown <strong>in</strong> Fig. 9. The consequence for emergency response strategy may<br />
be dramatic!<br />
Urban Dispersion:<br />
Figure 10. Urban Dispersion scenario from a hypo<strong>the</strong>tical release <strong>of</strong><br />
Anthrax <strong>in</strong> <strong>the</strong> stairways to <strong>the</strong> metro at Kgs. Nytorv, Copenhagen.<br />
Urban Dispersion. An example <strong>of</strong> local dispersion with<strong>in</strong> an urban area<br />
(Central Copenhagen <strong>in</strong> this case), is shown <strong>in</strong> Figure 10. The calculation<br />
has been performed with <strong>the</strong> British UDM Urban dispersion model (Hall<br />
et al., 2002). UDM can be nested with RIMPUFF so that UDM calculates<br />
<strong>the</strong> <strong>in</strong>itial urban dispersion <strong>in</strong>fluenced by <strong>the</strong> build<strong>in</strong>gs, while RIMPUFF<br />
takes over at longer distances.<br />
39
IV Atmospheric Dispersion: Release <strong>of</strong> Heavy gases<br />
Morten Nielsen, Risø, has produced <strong>the</strong> text <strong>in</strong> Chapter IV<br />
Dispersion models for <strong>in</strong>dustrial safety<br />
Manufacturers, distribut<strong>in</strong>g agents, and public authorities need to<br />
formulate safety policies for toxic and flammable gases. This <strong>in</strong>volves a<br />
wide range <strong>of</strong> aspects: <strong>in</strong>tr<strong>in</strong>sic process safety, equipment, alarm<br />
systems, handl<strong>in</strong>g procedures, personnel tra<strong>in</strong><strong>in</strong>g, spatial plann<strong>in</strong>g, and <strong>the</strong><br />
likelihood and consequences <strong>of</strong> possible accidents. Gas dispersion is an<br />
important task <strong>in</strong> <strong>the</strong> consequence analysis and <strong>in</strong> <strong>the</strong> context <strong>of</strong><br />
<strong>in</strong>dustrial accidents <strong>the</strong> source buoyancy and momentum may alter <strong>the</strong><br />
flow and turbulence fields significantly. This calls for special dispersion<br />
models.<br />
Source terms. Some gases used <strong>in</strong> <strong>in</strong>dustry are simply denser than air,<br />
for example chlor<strong>in</strong>e, which has a molecular weight 2.45 times that <strong>of</strong> air.<br />
The temperature deficit may also contribute significantly to <strong>the</strong> density<br />
effect. To understand this, we shall review <strong>the</strong> typical source conditions.<br />
It is convenient to store gas <strong>in</strong> a compressed state <strong>in</strong> pressurised or<br />
refrigerated conta<strong>in</strong>ers. An accidental spill <strong>of</strong> liquefied gas from a<br />
refrigerated conta<strong>in</strong>er will typically form a pool on <strong>the</strong> ground. If <strong>the</strong><br />
atmospheric boil<strong>in</strong>g-po<strong>in</strong>t temperature <strong>of</strong> <strong>the</strong> compound is lower than <strong>the</strong><br />
ambient air temperature, <strong>the</strong> pool will boil as long as <strong>the</strong> heat transfer<br />
from <strong>the</strong> ground is sufficient. The evaporation rate will depend on <strong>the</strong><br />
available heat, <strong>the</strong> ventilat<strong>in</strong>g airflow above <strong>the</strong> pool, and <strong>the</strong> surface<br />
area. Obvious mitigation methods are to cover <strong>the</strong> pool by foam or try to<br />
limit horizontal spread<strong>in</strong>g. It is generally a bad idea to pour water on <strong>the</strong><br />
pool, s<strong>in</strong>ce this will contribute with additional heat for evaporation - <strong>in</strong><br />
particular if <strong>the</strong> chemical reacts with water. The evaporation rate will be<br />
most <strong>in</strong>tense <strong>in</strong> <strong>the</strong> <strong>in</strong>itial stage <strong>of</strong> <strong>the</strong> accident, s<strong>in</strong>ce <strong>the</strong> heat supply<br />
weakens as <strong>the</strong> ground is cooled. A multi-component pool has a timedependent<br />
composition, s<strong>in</strong>ce <strong>the</strong> most volatile component tends to<br />
evaporate first. A leakage from a pressure-liquefied tank will usually<br />
produce a two-phase jet, with liquid aerosols so t<strong>in</strong>y that <strong>the</strong>y deposit<br />
only if <strong>the</strong> jet hits a nearby obstruction. The heat requirement for<br />
aerosol evaporation will keep <strong>the</strong> two-phase cloud cold for a longer time<br />
than a s<strong>in</strong>gle-phase cloud. The comb<strong>in</strong>ed effect <strong>of</strong> temperature deficit<br />
and latent heat <strong>of</strong> evaporation is characterised by source enthalpy.<br />
40
Density calculations. Numerical dispersion models for non-iso<strong>the</strong>rmal gas<br />
clouds usually rely on a <strong>the</strong>rmodynamic sub-model, based on <strong>the</strong><br />
assumption <strong>of</strong> homogeneous <strong>the</strong>rmal equilibrium. This steady-state<br />
approximation claims that liquid aerosols and <strong>the</strong> gaseous phase are <strong>of</strong><br />
equal temperature and sets <strong>the</strong> gas partial pressure <strong>in</strong> balance with <strong>the</strong><br />
vapour pressure <strong>of</strong> <strong>the</strong> condensed material. The <strong>the</strong>rmodynamic state is<br />
determ<strong>in</strong>ed by an enthalpy budget, and <strong>the</strong> <strong>the</strong>rmodynamic model is used<br />
to f<strong>in</strong>d <strong>the</strong> mixture temperature, <strong>the</strong> degree <strong>of</strong> condensation, and <strong>the</strong><br />
density for a given mix<strong>in</strong>g ratio. Rapid chemical reactions are treated <strong>in</strong> a<br />
similar way. The homogeneous equilibrium assumption allows <strong>the</strong> model<br />
developer to separate all this from <strong>the</strong> dispersion calculation, and it<br />
provides sufficiently accurate density predictions when <strong>the</strong> aerosol<br />
droplets are small. This is usually <strong>the</strong> situation <strong>in</strong> an emission from a<br />
pressurised tank, where <strong>the</strong> liquid <strong>of</strong>ten becomes quite superheated by<br />
<strong>the</strong> pressure relief. The flash-boil<strong>in</strong>g emission efficiently entra<strong>in</strong>s air and<br />
most liquefied gas evaporates with<strong>in</strong> a short distance. The water content<br />
<strong>of</strong> <strong>the</strong> entra<strong>in</strong>ed air will condense, and <strong>the</strong>se almost pure water aerosols<br />
will persist to <strong>the</strong> downw<strong>in</strong>d distance where <strong>the</strong> cloud reaches its dewpo<strong>in</strong>t<br />
temperature.<br />
Relative density difference, ∆ρ/ρ air<br />
1<br />
0.1<br />
0.01<br />
M * approximation<br />
H 2 O aerosols<br />
Immiscible aerosols<br />
Hygroscopic aerosols<br />
Fladis 9 (Ammonia)<br />
T air =16 °C and R.H.=86%<br />
0.1 1.0 10.0 100.0<br />
Mixture Concentration, c [mole%]<br />
Figure 11: Density difference <strong>of</strong> a two-phase mixture <strong>of</strong> ammonia and<br />
humid air as a function <strong>of</strong> concentration as predicted by four<br />
models, see text for discussion.<br />
41
Figure 11 shows relative excess density ∆ρ ρ air as a function <strong>of</strong> mix<strong>in</strong>g<br />
concentration c calculated by four models <strong>of</strong> different complexities. Each<br />
model assumes adiabatic mix<strong>in</strong>g, i.e. it neglects possible heat transfer<br />
from <strong>the</strong> ground. The chosen atmospheric conditions match <strong>the</strong> most<br />
humid case <strong>in</strong> a set <strong>of</strong> field experiments with liquefied ammonia (Nielsen<br />
et al, 1987). Ammonia is a hygroscopic substance (i.e. readily react<strong>in</strong>g with<br />
air humidity) and <strong>the</strong> thick solid curve, calculated by Wheatley´s (1987)<br />
model, is <strong>the</strong> most accurate one. This solution may be divided <strong>in</strong>to three<br />
doma<strong>in</strong>s: dry mix<strong>in</strong>g, nearly pure water aerosols and nearly pure ammonia.<br />
The moisture affects <strong>the</strong> aerosol formation <strong>in</strong> two ways: <strong>the</strong> relative<br />
humidity determ<strong>in</strong>es <strong>the</strong> limit <strong>of</strong> transition between dry and wet mix<strong>in</strong>g,<br />
while <strong>the</strong> absolute humidity (depend<strong>in</strong>g on air temperature) determ<strong>in</strong>es<br />
<strong>the</strong> magnitude <strong>of</strong> <strong>the</strong> deviation from dry mix<strong>in</strong>g. The immiscible aerosol<br />
model (dashed l<strong>in</strong>e) does surpris<strong>in</strong>gly well with just a slight over<br />
prediction <strong>of</strong> <strong>the</strong> density <strong>in</strong> <strong>the</strong> doma<strong>in</strong> <strong>of</strong> almost pure water aerosols.<br />
Most heavy gas sources produce an <strong>in</strong>itial dilution, and <strong>the</strong> doma<strong>in</strong> <strong>of</strong><br />
almost pure ammonia is unimportant for heavy-gas dispersion. The<br />
relatively simple pure water condensation model (th<strong>in</strong> l<strong>in</strong>e) is <strong>the</strong>refore<br />
adequate for most heavy-gas calculations. The straight dotted l<strong>in</strong>e,<br />
∆ρρair ≈ c ∆M∗M<br />
air , is based on <strong>the</strong> effective molecular weight,<br />
air<br />
M∗ = M−∆H0c c p Tairh, which approximates <strong>the</strong> dilute limit <strong>of</strong> pure gasphase<br />
mixtures (Nielsen & Ott, 1999). M is <strong>the</strong> contam<strong>in</strong>ant molar weight<br />
[kg mole -1 air<br />
], cp and<br />
T air are <strong>the</strong> heat capacity [J (kg K) -1 ] and absolute<br />
temperature [K] <strong>of</strong> <strong>the</strong> entra<strong>in</strong>ed air, and <strong>the</strong> enthalpy difference [J kg -1 ]<br />
between source and ambient conditions, ∆H 0 , is assumed constant. The<br />
simple M∗ approximately describes <strong>the</strong> doma<strong>in</strong> <strong>of</strong> dry mix<strong>in</strong>g quite well,<br />
but has a deviation <strong>of</strong> up to 78% <strong>in</strong> <strong>the</strong> doma<strong>in</strong> <strong>of</strong> almost pure water<br />
aerosols. The test scenario is however a demand<strong>in</strong>g one, partly because <strong>of</strong><br />
<strong>the</strong> high relative humidity and partly because <strong>of</strong> <strong>the</strong> large heat <strong>of</strong><br />
evaporation and low molecular weight <strong>of</strong> ammonia. The M∗ approximation<br />
will be more successful for o<strong>the</strong>r release conditions and it is a useful<br />
concept when compar<strong>in</strong>g <strong>the</strong> results <strong>of</strong> w<strong>in</strong>d-tunnel test with those from<br />
large-scale releases <strong>of</strong> liquefied gasses.<br />
Cloud Dynamics. The comb<strong>in</strong>ed forces <strong>of</strong> gravity and <strong>the</strong> ambient w<strong>in</strong>d<br />
drive heavy gas dynamics. The negative buoyancy makes <strong>the</strong> cloud spread<br />
horizontally and gives it a tendency to move downhill <strong>in</strong> slop<strong>in</strong>g terra<strong>in</strong>.<br />
The density stratification between <strong>the</strong> cloud and <strong>the</strong> air above reduces<br />
<strong>the</strong> turbulent k<strong>in</strong>etic energy level and vertical mix<strong>in</strong>g. Thus, a heavy-gas<br />
42
cloud is expected to cover a larger surface with higher gas concentration<br />
than a cloud <strong>of</strong> neutral buoyancy.<br />
Heavy gas dispersion may be predicted by three-dimensional numerical<br />
flow models with a k-ε turbulence closure (e.g. Pereira & Chen, 1996).<br />
These models parameterise <strong>the</strong> turbulent mix<strong>in</strong>g by concentration<br />
gradients and an isotropic diffusion coefficients, predicted by <strong>the</strong> local<br />
turbulent k<strong>in</strong>etic energy, local stratification and distances to solid<br />
boundaries. In heavy-gas applications <strong>the</strong> k-ε models must update <strong>the</strong><br />
turbulence field dur<strong>in</strong>g <strong>the</strong> time <strong>in</strong>tegration, s<strong>in</strong>ce <strong>the</strong> turbulence<br />
depends on <strong>the</strong> develop<strong>in</strong>g gas field. At present <strong>the</strong> typical grid is a<br />
relatively coarse mesh <strong>of</strong> 30×30×30 cells and <strong>of</strong>ten arranged with an<br />
irregular spac<strong>in</strong>g that enhances <strong>the</strong> resolution near <strong>the</strong> source and near<br />
<strong>the</strong> ground.<br />
An alternative and computationally cheaper method is to parameterise<br />
<strong>the</strong> mix<strong>in</strong>g process by an entra<strong>in</strong>ment function. Follow<strong>in</strong>g this approach,<br />
<strong>the</strong> heavy fluid and <strong>the</strong> ambient fluid are considered to be two dist<strong>in</strong>ct<br />
volumes, <strong>the</strong> mix<strong>in</strong>g zone is idealised to an <strong>in</strong>terface. Horizontal spread<strong>in</strong>g<br />
may <strong>the</strong>n be predicted by two-dimensional layer-<strong>in</strong>tegrated flow<br />
equations (e.g. Hank<strong>in</strong> & Britter 1999).<br />
The most popular models <strong>in</strong> risk assessment are <strong>of</strong> <strong>the</strong> box model type,<br />
which requires less computation as it simplifies <strong>the</strong> gas field to a s<strong>in</strong>gle<br />
control volume, whose time development is predicted by ord<strong>in</strong>ary<br />
differential equations (e.g. Witlox 1994).<br />
The driv<strong>in</strong>g potential for <strong>the</strong> horizontal spread<strong>in</strong>g is <strong>the</strong> excess pressure<br />
result<strong>in</strong>g from <strong>the</strong> density difference between <strong>the</strong> cloud and ambient air.<br />
b g , where g is<br />
The front velocity [m s -2 ] <strong>in</strong> calm air is ufgh 105 . ρ ρair gravity [m s -2 ] and h is <strong>the</strong> cloud height [m] (Brighton et al. 1985). In box<br />
models, <strong>the</strong> mix<strong>in</strong>g <strong>in</strong> <strong>the</strong> turbulent wake <strong>of</strong> <strong>the</strong> spread<strong>in</strong>g front is<br />
<strong>in</strong>terpreted as `edge entra<strong>in</strong>ment´ and parameterised by <strong>the</strong> mix<strong>in</strong>g rate<br />
016 . u (Simpson & Britter, 1979) multiplied by <strong>the</strong> cloud perimeter and<br />
f<br />
ue f<br />
height. The mix<strong>in</strong>g through <strong>the</strong> cloud top is formulated as <strong>the</strong><br />
entra<strong>in</strong>ment velocity ue<br />
multiplied by <strong>the</strong> top area. One parameterisation<br />
out <strong>of</strong> several alternatives is ue e 25 . 333 . Rie<br />
d i<br />
velocity scale e u 01<br />
. w<br />
3 3<br />
* *<br />
13<br />
b g with <strong>the</strong> turbulence<br />
def<strong>in</strong>ed by <strong>the</strong> friction velocity, u , and <strong>the</strong><br />
heat-convection velocity scale, w * , typical for <strong>the</strong> conditions <strong>in</strong>side <strong>the</strong><br />
gas cloud (Nielsen, 1998). Jensen (1981) proposed an analogy with <strong>the</strong><br />
43<br />
*
uair<br />
uair<br />
.<br />
ue<br />
u(t)<br />
.<br />
.<br />
uf<br />
Fd<br />
f<br />
ue<br />
ue<br />
x(t)<br />
uair<br />
uf ue ue<br />
f<br />
uef<br />
u<br />
.<br />
ue<br />
ue<br />
uf<br />
f<br />
Figure 12: Various box-models for heavy gas dispersion: a) Model for<br />
<strong>in</strong>stantaneous releases, b) Model for a jet or plume with ground contact,<br />
c) ’Ballistic’ model for a free jet, d) Model for an <strong>in</strong>stantaneous releases<br />
on slop<strong>in</strong>g ground.<br />
atmospheric surface layer and used Mon<strong>in</strong>-Obukhov <strong>the</strong>ory to estimate<br />
<strong>the</strong> turbulent velocity scales u * and w * . The <strong>in</strong>-plume Mon<strong>in</strong>-Obukhov<br />
length was estimated by <strong>the</strong> cloud height, advection speed, and<br />
temperature deficit relative to <strong>the</strong> surface. The dimensionless number <strong>in</strong><br />
<strong>the</strong> denom<strong>in</strong>ator <strong>of</strong> <strong>the</strong> entra<strong>in</strong>ment function is a bulk Richardson number,<br />
Rie gh e<br />
ρ ρ air , which represents <strong>the</strong> <strong>in</strong>ternal cloud stability. There is no<br />
clear consensus on entra<strong>in</strong>ment functions – probably because <strong>of</strong> <strong>the</strong> lack<br />
<strong>of</strong> adequate turbulence measurements <strong>in</strong> <strong>the</strong> field. Box model developers<br />
have been forced to calibrate coefficients <strong>in</strong> <strong>the</strong>ir entra<strong>in</strong>ment functions<br />
by <strong>the</strong> result<strong>in</strong>g gas field. Comparison <strong>of</strong> entra<strong>in</strong>ment functions is fur<strong>the</strong>r<br />
complicated by <strong>the</strong> fact that <strong>in</strong>dividual model def<strong>in</strong>itions <strong>of</strong> Richardson<br />
numbers and cloud height vary.<br />
Figure 12 shows a collection <strong>of</strong> heavy-gas box models <strong>of</strong> variable<br />
geometry. The first model, designed for <strong>in</strong>stantaneous gas releases,<br />
considers <strong>the</strong> entire cloud as its control volume and adopts <strong>the</strong> cloud<br />
radius, mass and enthalpy as <strong>the</strong> ma<strong>in</strong> variables <strong>in</strong> <strong>the</strong> <strong>in</strong>tegration.<br />
44<br />
.
Auxiliary parameters like concentration, temperature, density, volume,<br />
height, turbulence, and heat flux from <strong>the</strong> ground are derived from <strong>the</strong><br />
ma<strong>in</strong> variables. The front velocity and <strong>the</strong> mass and enthalpy balances<br />
provide differential equations for <strong>the</strong> time development. The cloud<br />
velocity is ei<strong>the</strong>r set equal to <strong>the</strong> ambient w<strong>in</strong>d velocity or determ<strong>in</strong>ed by<br />
a momentum balance. The second part <strong>of</strong> <strong>the</strong> figure shows a model <strong>of</strong> a<br />
jet or plume with ground contact. Here, <strong>the</strong> plume width is <strong>the</strong> relevant<br />
horizontal dimension and <strong>the</strong> cloud mass and enthalpy described as fluxes<br />
through <strong>the</strong> plume cross section <strong>in</strong>stead <strong>of</strong> <strong>the</strong> <strong>in</strong>tegral values. The<br />
differential equations and <strong>the</strong> auxiliary parameters are very similar to<br />
those <strong>of</strong> <strong>the</strong> box model for <strong>in</strong>stantaneous release. There are many<br />
publicly available heavy gas models <strong>of</strong> this type, e.g. HEGADAS (Witlox,<br />
1994), DEGADIS (Spicer and Havens, 1986), SLAM (Ermak, 1990), and<br />
DRIFT (Webber et al., 1992). The third part <strong>of</strong> <strong>the</strong> figure shows a free<br />
jet whose trajectory is <strong>in</strong>fluenced by gravity <strong>in</strong> a `ballistic’ manner,<br />
which also <strong>in</strong>cludes <strong>the</strong> drag force <strong>of</strong> <strong>the</strong> ambient flow and <strong>the</strong> momentum<br />
<strong>of</strong> <strong>the</strong> entra<strong>in</strong>ed air (e.g. Ooms and Duijm, 1983). The entra<strong>in</strong>ment rate <strong>in</strong><br />
this model is different from that for <strong>the</strong> model <strong>of</strong> clouds with ground<br />
contact; it ma<strong>in</strong>ly depends on <strong>the</strong> velocity shear between <strong>the</strong> jet and <strong>the</strong><br />
surround<strong>in</strong>g air. The fourth part <strong>of</strong> <strong>the</strong> figure shows a model for<br />
<strong>in</strong>stantaneous releases <strong>in</strong> slop<strong>in</strong>g terra<strong>in</strong>. The top is flat and horizontal,<br />
which is <strong>the</strong> steady state solution <strong>of</strong> a layer-<strong>in</strong>tegrated two-dimensional<br />
model (Webber et al, 1993). The sharp pr<strong>of</strong>iles <strong>of</strong> <strong>the</strong> various box models<br />
are unrealistic and <strong>the</strong> predicted fields are <strong>of</strong>ten smoo<strong>the</strong>d by empirical<br />
similarity pr<strong>of</strong>iles before presentation to <strong>the</strong> model users.<br />
Heat transfer from <strong>the</strong> ground. The heat transfer from <strong>the</strong> ground to<br />
a cold gas cloud affects <strong>the</strong> dispersion <strong>in</strong> two ways: It modifies <strong>the</strong> cloud<br />
density and produces additional turbulence. The result<strong>in</strong>g density effect<br />
is l<strong>in</strong>ked to <strong>the</strong> dispersion process as illustrated <strong>in</strong> Figure 13.<br />
A box model calculates <strong>the</strong>se curves, and <strong>in</strong> order to avoid <strong>the</strong> complexity<br />
<strong>of</strong> two-phase density calculations <strong>the</strong> dilut<strong>in</strong>g air has no humidity. The<br />
release conditions are listed <strong>in</strong> Table 6. The heat transfer is most<br />
significant when <strong>the</strong> cloud has a large temperature deficit, i.e. close to<br />
<strong>the</strong> source where gas concentrations are relative high. In <strong>the</strong> reference<br />
case (fat solid l<strong>in</strong>e) <strong>the</strong> accumulated heat<strong>in</strong>g changes <strong>the</strong> cloud buoyancy.<br />
This is compared to <strong>the</strong> cases <strong>of</strong> no ground heat<strong>in</strong>g (th<strong>in</strong> straight l<strong>in</strong>e),<br />
enhanced mix<strong>in</strong>g near <strong>the</strong> source (doted l<strong>in</strong>e), a higher w<strong>in</strong>d speed<br />
(dashed l<strong>in</strong>e) and enhanced entra<strong>in</strong>ment rate (dashed-dotted l<strong>in</strong>e). Each<br />
<strong>of</strong> <strong>the</strong>se factors moderates <strong>the</strong> heat<strong>in</strong>g effect.<br />
45
Relative density difference, ∆ρ/ρ air<br />
1<br />
0.1<br />
0.01<br />
0.001<br />
1: No heat transfer<br />
2: Extra source dilution<br />
3: Increased w<strong>in</strong>d speed<br />
4: Enhanced entra<strong>in</strong>ment<br />
Reference case<br />
0.1 1.0 10.0<br />
Mixture Concentration, c [mole%]<br />
Figure 13: Predicted Heat-Flux Effect on <strong>the</strong> Density Difference <strong>of</strong> a<br />
Propane Plume as a Function <strong>of</strong> Concentration. Release conditions are<br />
given <strong>in</strong> Table 1.<br />
Table 6: Release conditions for test cases <strong>in</strong> Figure 13.<br />
Reference<br />
case<br />
Compariso<br />
n cases<br />
Release rate<br />
W<strong>in</strong>d speed<br />
Surface roughness<br />
Air temperature<br />
Air pressure<br />
Air humidity<br />
1: No heat transfer<br />
2: Extra source dilution<br />
3: Increased w<strong>in</strong>d speed<br />
4: Enhanced entra<strong>in</strong>ment<br />
46<br />
&m= 3 kg s -1 C3H8(l)<br />
u10= 2 m s -1<br />
z0= 0.01 m<br />
Tair = 288 K<br />
pair = 100 kNm -2<br />
R.H.= 0%<br />
ϕ 0<br />
3<strong>in</strong>itial dilution<br />
u10 = 4 m/s<br />
ue doubled
Variable atmospheric w<strong>in</strong>d conditions make <strong>the</strong> <strong>in</strong>tegral heat balances<br />
quite difficult, and as an alternative, Nielsen and Ott (1999) preferred to<br />
test whe<strong>the</strong>r local cloud enthalpies were <strong>in</strong> accordance with <strong>the</strong><br />
assumption <strong>of</strong> adiabatic mix<strong>in</strong>g, ∆H = c ⋅ ∆H0<br />
. The cloud enthalpies were<br />
calculated by adjacent measurements <strong>of</strong> temperature and concentration,<br />
us<strong>in</strong>g <strong>the</strong> homogeneous-equilibrium assumption and Wheatley's (1987)<br />
aerosol model to evaluate <strong>the</strong> degree <strong>of</strong> aerosol condensation. The<br />
analysis found reductions <strong>in</strong> excess cloud buoyancy <strong>in</strong> <strong>the</strong> range 38-<br />
59%, which is almost as significant as suggested <strong>in</strong> Figure 3. The heattransfer<br />
effect was found to depend on <strong>the</strong> distance from <strong>the</strong> source and<br />
seemed to depend on <strong>the</strong> efficiency <strong>of</strong> <strong>the</strong> near-source mix<strong>in</strong>g.<br />
Obviously <strong>the</strong> ground will not susta<strong>in</strong> heat transfer forever. Nielsen and<br />
Ott (1999) analysed <strong>in</strong>-soil heat flux measurements from <strong>the</strong> Desert<br />
Tortoise liquefied ammonia experiments (Goldwire et al 1985) and<br />
concluded that <strong>the</strong> surface heat flux at 100-m distance decreased to<br />
62% <strong>of</strong> its <strong>in</strong>itial value.<br />
That’s all folks…<br />
Acknowledgements:<br />
The author acknowledges contributions to this article from colleagues<br />
Morten Nielsen, Poul Astrup, Søren Thykier-Nielsen and Fay Dunkerley.<br />
47
References<br />
Atmosheric dispersion, Chapter I- III<br />
ApSimon, H. M., A. Goddard and J. Wrigley (1980): Estimat<strong>in</strong>g <strong>the</strong><br />
possible transfrontier consequences <strong>of</strong> accidental releases: <strong>the</strong> MESOS<br />
Model for long range atmospheric dispersal. In: Sem<strong>in</strong>ar on Radioactive<br />
Releases and Their Dispersion <strong>in</strong> <strong>the</strong> <strong>Atmosphere</strong> Follow<strong>in</strong>g a Hypo<strong>the</strong>tical<br />
Reactor Accident. Risø, 22-25 April 1980. Edited by F. van Hoeck and P.<br />
Recht. Vol. 2. (Commission <strong>of</strong> <strong>the</strong> European Communities, Luxembourg,<br />
1980) pp 819-866.<br />
Astrup P., N.O. Jensen and T. Mikkelsen (1997): A fast model for mean<br />
and turbulent w<strong>in</strong>ds characteristics over terra<strong>in</strong> with mixed surface<br />
roughness. Radiat. Prot. Dosim. (1997) Vol. 73, pp. 257-260<br />
Batchelor, G.K. (1952): Diffusion <strong>in</strong> <strong>the</strong> Field <strong>of</strong> Homogeneous Turbulence,<br />
II. The relative motion <strong>of</strong> particles, Proc. Camb, Phil. Soc., Vol. 48, p 345.<br />
Batchelor, G.K (1959) Note on <strong>the</strong> diffusion from sources <strong>in</strong> a turbulent<br />
boundary layer (Unpublished)<br />
Batchelor, G.K. (1964) Diffusion from sources <strong>in</strong> a turbulent boundary<br />
layer, Archiv Mechanik i Stosowanej, Vol 3, p 661.<br />
Batchvarova E. and S.-E. Gryn<strong>in</strong>g (1991): Applied Model for <strong>the</strong> Growth <strong>of</strong><br />
<strong>the</strong> Daytime Mixed Layer. Boundary-Layer Meteorology. Vol 56, pp. 261--<br />
274.<br />
Brandt, J.; Mikkelsen, T.; Thykier-Nielsen, S.; Zlatev, Z.( 1996a): The<br />
Danish RIMPUFF and Eulerian accidental release model (<strong>the</strong> dream). 21.<br />
General assembly <strong>of</strong> <strong>the</strong> European Geophysical Society, The Hague (NL),<br />
6-10 May 1996. Ann. Geophys. Suppl. 2 (1996) 14, C486<br />
Brandt, J.; Mikkelsen, T.; Thykier-Nielsen, S.; Zlatev, Z.,( 1996b): The<br />
Danish Rimpuff and Eulerian Accident release model (The DREAM). Phys.<br />
Chem. Earth (1996) Vol. 21, pp 441-444.<br />
48
Busch, N.E., On <strong>the</strong> Mechanics <strong>of</strong> Atmospheric Turbulence. In: Workshop<br />
on Micrometeorology. Edited by D.A. Hangen. (American Meteorological<br />
Society, Boston, 1973), pp 1-65.<br />
Chatw<strong>in</strong>, P.C. (1968) The dispersion <strong>of</strong> a puff <strong>of</strong> passive contam<strong>in</strong>ant <strong>in</strong><br />
<strong>the</strong> constant stress region, Quart. J. R. Met. Soc., Vol. 94, pp 350-360<br />
Cionco, R.M.; aufm Kampe, W.; Bilt<strong>of</strong>t, C.; Byers, J.H.; Coll<strong>in</strong>s, C.G.; Higgs,<br />
T.J.; H<strong>in</strong>, A.R.T.; Johansson, P.E.; Jones, C.D.; Jørgensen, H.E.; Kimber,<br />
J.F.; Mikkelsen, T.; Nyren, K.; Ride, D.J.; Robson, R.; Santabarbara, J.M.;<br />
Streicher, J.; Thykier-Nielsen, S.; Raden H. van; Weber, H., An overview<br />
<strong>of</strong> MADONA: A mult<strong>in</strong>ational field study <strong>of</strong> high-resolution meteorology<br />
and diffusion over complex terra<strong>in</strong>. Bull. Am. Meteorol. Soc. (1999) Vol.<br />
80, pp 5-19.<br />
Dunkerley, F.N.; Mikkelsen, T.; Griffiths, I.H., A simple model for<br />
predict<strong>in</strong>g <strong>the</strong> local mean w<strong>in</strong>d field near a coastl<strong>in</strong>e. EGS 2001, 26.<br />
General assembly, Nice (FR), 25-30 Mar 2001.<br />
Ehrhardt, J.; Brown, J.; French, S.; Kelly, G.N.; Mikkelsen, T.; Müller, H.,<br />
RODOS: Decision-mak<strong>in</strong>g support for <strong>of</strong>fside emergency management<br />
after nuclear accidents. Kerntechnik (1997) 62, 122-128<br />
Gifford, F. (1988). A simple <strong>the</strong>ory for <strong>the</strong> description <strong>of</strong> cloud spread<strong>in</strong>g<br />
at ranges from 1-2000 km. In: Air Pollution <strong>Modell<strong>in</strong>g</strong> and Its Application<br />
VI. Proceed<strong>in</strong>gs <strong>of</strong> <strong>the</strong> 16. NATO/CCMS International Technical Meet<strong>in</strong>g.<br />
L<strong>in</strong>dau, 6-10 Apr 1987. Dop, H. van (ed.), (Plenum Press, New York, 1988)<br />
(NATO Challenges <strong>of</strong> Modern Society, 11) p. 569-577.<br />
Hall, D.J., A.M. Spanton , I.H. Griffiths, M. Hargarve and S. Walker<br />
(2002): The Urban Dispersion Model (UDM): Version 2.2 Technical<br />
Documentation; DSTL/TR04774; 2 September, 2002.<br />
Kadar B. A, Yaglom, A.M. and Zubkovskii, S. L. (1989) Spatial correlation<br />
functions <strong>of</strong> surface-layer atmospheric turbulence <strong>in</strong> neutral<br />
stratification. Boundary-Layer Meteorology, Vol. 47, 233-249.<br />
Kramer, M.L. & W. M. Porch (Eds.) 1990: Meteorological aspects <strong>of</strong><br />
Emergency Response, American Meteorological Society. 119 pp.<br />
49
Maryon R.H. and A.T. Buckland (1995) Tropospheric dispersion: The first<br />
ten days after a puff release. Q. J. R. Meteorol. Soc. Vol 121B , pp 1799-<br />
1834.<br />
Mikkelsen, T.; Larsen, S.E.; Thykier-Nielsen, S., Description <strong>of</strong> <strong>the</strong> Risø<br />
Puff Diffusion Model. Nucl. Technol. 67 (1984) 56-65.<br />
Mikkelsen, T. (1995): <strong>Modell<strong>in</strong>g</strong> Diffusion and Dispersion <strong>of</strong> <strong>Pollutant</strong>s. In:<br />
Diffusion and <strong>Transport</strong> <strong>of</strong> <strong>Pollutant</strong>s <strong>in</strong> Atmospheric Mesoscale Flow<br />
Fields. Eds. A. Gyr and F-S. Rys, Kluwer Academic Publishers, ERCOFTAC<br />
SERIES, 1995.<br />
Mikkelsen, T.; Thykier-Nielsen, S.; Astrup, P.; Santabárbara, J.M.;<br />
Sørensen, J.H.; Rasmussen, A.; Robertson, L.; Ullerstig, A.; Deme, S.;<br />
Martens, R.; Bartzis, J.G.; Päsler-Sauer, J., MET-RODOS: A<br />
comprehensive atmospheric dispersion module. Radiat. Prot. Dosim. (1997)<br />
73, 45-56.<br />
Mikkelsen, T.; Thykier-Nielsen, S.; Astrup, P.; Santabárbara, J.M.;<br />
Havskov Sørensen, J.; Rasmussen, A.; Deme, S.; Martens, R., An<br />
operational real-time model cha<strong>in</strong> for flow- and forecast<strong>in</strong>g <strong>of</strong> radioactive<br />
atmospheric releases on <strong>the</strong> local scale. In: Air pollution modell<strong>in</strong>g and its<br />
application 12. 22. NATO/CCMS <strong>in</strong>ternational technical meet<strong>in</strong>g,<br />
Clermont-Ferrand (FR), 2-6 Jun 1997. Gryn<strong>in</strong>g, S. -E.; Chaumerliac, N.<br />
(eds.), (Plenum Press, New York, 1998) (NATO Challenges <strong>of</strong> Modern<br />
Society, 22) pp. 501-508.]<br />
Mikkelsen, T. (2000) Meteorology and atmospheric dispersion. In:<br />
Ehrhardt, J.; Weis, A. (Eds.) RODOS: Decision support system for <strong>of</strong>fsite<br />
nuclear emergency management <strong>in</strong> Europe. F<strong>in</strong>al project report. EUR-<br />
19144 (2000) p. 57-88.<br />
Mikkelsen, T., Meteorology and atmospheric dispersion. In: Ehrhardt, J.;<br />
Weis, A. (eds.), RODOS: Decision support system for <strong>of</strong>f-site nuclear<br />
emergency management <strong>in</strong> Europe. F<strong>in</strong>al project report. EUR-19144<br />
(2000) p. 57-88<br />
Mikkelsen, T., H. E. Jørgensen, M. Nielsen and S. Ott (2002): Similarity<br />
Scal<strong>in</strong>g <strong>of</strong> Surface-released Smoke Plumes. Boundary-Layer Meteorology<br />
105: 483–505, 2002.<br />
50
Mon<strong>in</strong> A.S. (1959) Smoke propagation <strong>in</strong> <strong>the</strong> surface layer <strong>of</strong> <strong>the</strong><br />
atmosphere, Atmospheric Diffusion and Air Pollution, ed. F. N. Frenkiel<br />
and P.A. Sheppard, Advances <strong>in</strong> Geophysics, 6, 331pp, Academic Press.<br />
Moreno, J., A.M. Sempreviva, T. Mikkelsen, G. Lai and R. Kamada (1994). A<br />
spectral diagnostic model for w<strong>in</strong>d flow simulation: extension to <strong>the</strong>rmal<br />
forc<strong>in</strong>g. In proceed<strong>in</strong>gs <strong>of</strong> <strong>the</strong> Second International Conference on Air<br />
Pollution, 27-29 September 1994, Barcelona, Spa<strong>in</strong>. (Eds.) J.M. Baldasano,<br />
C.A. Brebbia, H. Power and P. Senate, Computational Mechanics<br />
Publications, Southhamton, U.K., Vol II, pp 51-58.<br />
Nagstrom, G. D. and K.S. Gage (1985): A climatology <strong>of</strong> atmospheric wavenumber<br />
spectra <strong>of</strong> w<strong>in</strong>d and temperature observed by a commercial<br />
aircraft. J. Atmos. Sci. Vol. 42. p 950.<br />
Nieuwstadt, F.T.M. (1981): The Steady-State Height and Resistance Laws<br />
<strong>of</strong> <strong>the</strong> Nocturnal Boundary Layer: Theory compared with Cabauw<br />
Observations. Boundary-Layer Meteorology. Vol. 20, pp. 3-17.<br />
Olesen, H.R. and Mikkelsen, T. (Eds.) 1992: Proceed<strong>in</strong>gs <strong>of</strong> <strong>the</strong> workshop<br />
"Objectives for Next Generation <strong>of</strong> Practical short-range Atmospheric<br />
Dispersion Models", Risø, Denmark, May 6-8 Danish Centre for Atmospheric<br />
Research (DCAR), P.O.BOX 358, DK-4000 Roskilde. 262 pp.<br />
Ott, S., Mann, J. (2000) An experimental <strong>in</strong>vestigation <strong>of</strong> <strong>the</strong> relative<br />
diffusion <strong>of</strong> particle pairs <strong>in</strong> three-dimensional turbulent flow. J. Fluid<br />
Mech. 422 , 207-223<br />
Pasquill, F. (1961) The Estimation <strong>of</strong> <strong>the</strong> Dispersion <strong>of</strong> W<strong>in</strong>dborne<br />
Material. Meteorol. Mag., 90 (1063), pp33-49.<br />
Pielke, R. A. 1984 Mesoscale Meteorological <strong>Modell<strong>in</strong>g</strong>, Academic Press.<br />
Richardson, F. L. (1926): Atmospheric diffusion shown on a distanceneighbour<br />
graph, Proc. Roy. Soc. Soc., A, Vol. 97, p 354.<br />
Sass, B.H. (1994): The DMI Operational HIRLAM Forecast<strong>in</strong>g System,<br />
Version 2.3. Danish Meteorological Institute. DMI Technical Report 94-8.<br />
51
Smagor<strong>in</strong>sky, J. (1981) Epilogue: a perspective <strong>of</strong> dynamical meteorology.<br />
In Dynamical meteorology. An Introductory selection. Ed. B.W. Atk<strong>in</strong>son,<br />
Methuen, 205-219.<br />
Sørensen J.H., A. Rasmussen and H. Svensmark (1996): Forecast <strong>of</strong><br />
Atmospheric Boundary-Layer Height Utilised for ETEX Real-time<br />
Dispersion <strong>Modell<strong>in</strong>g</strong>. Physics and Chemistry <strong>of</strong> <strong>the</strong> Earth. Vol. 21, pp.<br />
435--439.<br />
Taylor, G. I. (1921) Diffusion by cont<strong>in</strong>uous movements. Proc. London<br />
Math. Soc., Ser.2, Vol. 20, p 196.<br />
Tchen, C.M. (1959) Diffusion <strong>of</strong> Particles <strong>in</strong> Turbulent Flow. In : Frenkiel,<br />
F.N.; Sheppard, P.A. (Eds.). Atmospheric diffusion and air pollution.<br />
Academic Press. 1959. 488 pp<br />
Thykier-Nielsen, S.; Hasager, C.B., Satellite maps <strong>of</strong> land cover used <strong>in</strong> a<br />
real-time air pollution deposition model. Scenarios for Ignal<strong>in</strong>a nuclear<br />
power plant, Lithuania. EGS 2000, 25. General assembly: Millennium<br />
conference on earth, planetary and solar systems sciences, Nice (FR), 25-<br />
29 Apr 2000. Geophys. Res. Abstr.<br />
Troen, I. and de Baas, A. F. (1986): A spectral diagnostic model for w<strong>in</strong>d<br />
flow simulation <strong>in</strong> complex terra<strong>in</strong>. In: Proceed<strong>in</strong>gs <strong>of</strong> <strong>the</strong> European W<strong>in</strong>d<br />
Energy Association Conference & Exhibition, pp.37-41, Rome, 1986.<br />
van Ulden, A.P. and A.A.M. Holtslag (1985): Estimation <strong>of</strong> Atmospheric<br />
Boundary Layer Parameters for Diffusion Applications. Journal <strong>of</strong> Climate<br />
and Applied Meteorology. Vol. 24, pp. 1196-1207.<br />
References, cont.: Heavy gases (Chapter IV).<br />
Brighton, P.W.M., Pr<strong>in</strong>ce, A..J. and Webber, D. M. (1985) Determ<strong>in</strong>ation <strong>of</strong><br />
cloud area and path from visual and concentration records, J. Hazard.<br />
Mater. 11 ,155-178.<br />
Ermak, D. L., (1990) User's Manuals for SLAB: An Atmospheric Dispersion<br />
Model for Denser-Than-Air Releases, UCRL-MA-105607, Lawrence<br />
Livermore National Laboratory, Ca., 144p.<br />
52
Goldwire, H. C., McRae, T. G., Johnson, G. W., Hipple, D. L., Koopman, R. P. ,<br />
McClure, J. W., Morris, L. K. and Cederwall, R. T. (1985) Desert Tortoise<br />
series data report - 1983 Pressurized ammonia spills, UCID-20562, US<br />
Lawrence Livermore National Laboratory, 244 pp.<br />
Hank<strong>in</strong>, R. K. S. and Britter, R. E. (1999) TWODEE: <strong>the</strong> Helath and Safety<br />
Laboratory's shallow water layer model for heavy gas dispersion. Part 1:<br />
Ma<strong>the</strong>matical basis and physical assumptions, J. Hazard. Mater. A66 ,<br />
211-226,<br />
Jensen, N. O., (1981), Entra<strong>in</strong>ment through <strong>the</strong> top <strong>of</strong> a heavy gas cloud,<br />
In C. de Wispelaere,: Air Pollution Model<strong>in</strong>g and its Application- I, Plenum<br />
Press, New York, 477-487.<br />
Nielsen, M., Ott, S., Jørgensen, H. E., Bengtsson, R., Nyrén, K., W<strong>in</strong>ter, S.,<br />
Ride, D. and Jones, C. (1997) Field experiments with dispersion <strong>of</strong><br />
pressure liquefied ammonia, J. Hazard. Mater. 56 ,59-105.<br />
Nielsen, M. (1998) Dense gas dispersion <strong>in</strong> <strong>the</strong> atmosphere, Risø-R-<br />
1030(EN), Risø National Laboratory, 276 pp.<br />
Nielsen, M. and Ott, S. (1999) Heat transfer <strong>in</strong> large-scale heavy-gas<br />
dispersion, J. Hazard. Mater. A67, 41-58.<br />
Ooms, G. and Duijm, N. J. (1983) Dispersion <strong>of</strong> a stack plume heavier than<br />
air, In: Ooms, G. and Tennekes, H. (Eds.) Atmospheric Dispersion <strong>of</strong><br />
Heavy Gas and Small Particles, Spr<strong>in</strong>ger Verlag, 1-23.<br />
Pereira, J. C. F. and Chen, X.-Q. (1996) Numerical calculation <strong>of</strong> unsteady<br />
heavy gas dispersion, J. Hazard. Mater. 46, 253-272.<br />
Simpson, J. E. and Britter, R. E. (1979) The dynamics <strong>of</strong> a head <strong>of</strong> a<br />
gravity current advanc<strong>in</strong>g over a horizontal surface, J. Fluid Mech. 94,<br />
447-495.<br />
Spicer, T. O. and Havens, J. A. (1986) Development <strong>of</strong> a Heavier-Than-Air<br />
Dispersion Model for <strong>the</strong> US Coast Guard Hazard Assessment Computer<br />
System, <strong>in</strong> S. Hartwig (ed.), Heavy Gas and Risk Assessment - III,<br />
Battelle Institute e. V., Frankfurt am Ma<strong>in</strong>, Germany, pp. 73-121.<br />
53
Webber, D. M., Jones, S. J., Tickle, G. A. and Wren, T. (1992) A Model <strong>of</strong><br />
a Dispersion Dense Gas Cloud, and <strong>the</strong> Computer Implementation II.<br />
Steady Cont<strong>in</strong>uous Releases, SRD-R587, UK Atomic Energy Authority,<br />
Safety and Reliability Directorate, 101 p.<br />
Webber, D. M., Jones, S. J. and Mart<strong>in</strong>, D. (1993) A model <strong>of</strong> <strong>the</strong> motion<br />
<strong>of</strong> a heavy gas cloud released on a uniform slope, J. Hazard. Mater. 33,<br />
101-122.<br />
Wheatley, C. J. (1987) Discharge <strong>of</strong> liquid ammonia to moist atmospheres<br />
- survey <strong>of</strong> experimental data and model for estimat<strong>in</strong>g <strong>in</strong>itial conditions<br />
for dispersion calculations, SRD/HSE-R410, UK Athomic Energy<br />
Authority, 41 pp.<br />
Witlox, H. W. M. (1994) The HEGADAS model for ground-level heavy-gas<br />
dispersion, Atm. Env. 28, 2917-2932.<br />
54
Table <strong>of</strong> Content<br />
<strong>Modell<strong>in</strong>g</strong> <strong>of</strong> <strong>Pollutant</strong> <strong>Transport</strong> <strong>in</strong> <strong>the</strong> <strong>Atmosphere</strong> .......................................1<br />
I Atmospheric dispersion: Basic ............................................................................1<br />
Key Factors Influenc<strong>in</strong>g Atmospheric Dispersion .........................................2<br />
Introduction........................................................................................................2<br />
The Structure <strong>of</strong> <strong>the</strong> <strong>Atmosphere</strong> ...............................................................2<br />
The importance <strong>of</strong> <strong>the</strong> local w<strong>in</strong>d field ........................................................5<br />
The Temperature Pr<strong>of</strong>ile and Atmospheric Stability...............................7<br />
Atmospheric Dispersion at different scales.............................................10<br />
II Diffusion Theories and associated Atmospheric Dispersion Models ....12<br />
Fixed and mov<strong>in</strong>g frames <strong>of</strong> reference......................................................12<br />
III Atmospheric Dispersion Models - Applications: .......................................26<br />
Practical Atmospheric Dispersion Models .....................................................27<br />
Dispersion Model Gallery:..............................................................................27<br />
On-l<strong>in</strong>e Numerical Wea<strong>the</strong>r Prediction w<strong>in</strong>ds for dispersion ...............30<br />
Atmospheric dispersion module for nuclear releases.............................31<br />
The Met-RODOS Atmospheric Dispersion Module for Real-time<br />
Decision Support..............................................................................................31<br />
Urban Dispersion: ............................................................................................39<br />
IV Atmospheric Dispersion: Release <strong>of</strong> Heavy gases .....................................40<br />
Dispersion models for <strong>in</strong>dustrial safety.....................................................40<br />
References ................................................................................................................48<br />
Atmosheric dispersion, Chapter I- III......................................................48<br />
References, cont.: Heavy gases (Chapter IV). ........................................52<br />
55