Summary formula sheet for simple linear ... - NCSU Statistics
Summary formula sheet for simple linear ... - NCSU Statistics
Summary formula sheet for simple linear ... - NCSU Statistics

Create successful ePaper yourself
Turn your PDF publications into a flip-book with our unique Google optimized e-Paper software.
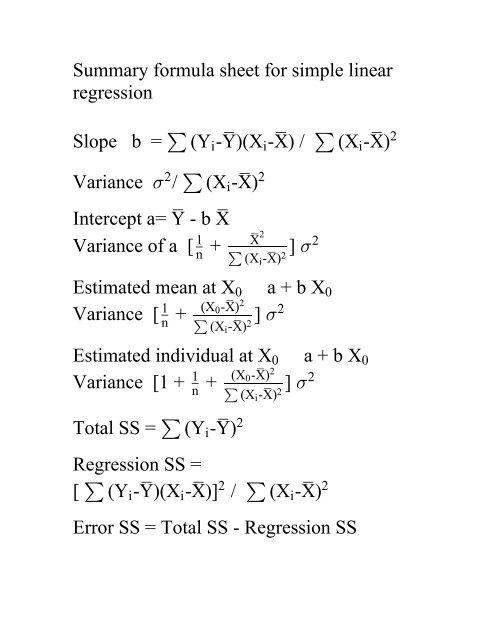
<strong>Summary</strong> <strong><strong>for</strong>mula</strong> <strong>sheet</strong> <strong>for</strong> <strong>simple</strong> <strong>linear</strong><br />
regression<br />
_ _ _<br />
Slope b = ! (Yi-Y)(Xi-X) / ! (Xi-X) Variance / (X -X)<br />
_<br />
2 2<br />
5 ! i<br />
_ _<br />
Intercept a= Y - b X _<br />
1 X<br />
Variance of a [ + ] _<br />
2<br />
2 5<br />
n<br />
! (X -X)<br />
Estimated mean at X a + b X<br />
1 (X -X)<br />
Variance [ + ]<br />
_<br />
_<br />
2<br />
0 2 5<br />
n<br />
! (X -X)<br />
i<br />
i<br />
2<br />
0 0<br />
Estimated individual at X a + b X<br />
1 (X -X)<br />
Variance [1 + n + ]<br />
_<br />
(X -X)<br />
_<br />
2<br />
0 2 5<br />
! 2<br />
i<br />
Total SS = (Y -Y)<br />
_<br />
2<br />
! i<br />
2<br />
0 0<br />
Regression<br />
_<br />
SS =<br />
_ _<br />
[ ! (Y -Y)(X -X)] / ! (X -X)<br />
2 2<br />
i i i<br />
Error SS = Total SS - Regression SS<br />
2
2 R = Regression SS/ Total SS = "proportion<br />
explained"<br />
MSE = error mean square = estimate of 52 = Error SS/ df<br />
df= degrees of freedom = n-2 <strong>for</strong> <strong>simple</strong><br />
<strong>linear</strong>.<br />
Example<br />
Data points (x 1,y 1), (x 2,y 2), ...., (x n,y n)<br />
_<br />
(1,5), (2,7),<br />
_<br />
(3,9), (4,6), (5,8)<br />
x = 15/5=3, y = 7<br />
Corrected sum of squares <strong>for</strong> x:<br />
n _<br />
! 2 2 2<br />
(x - x) = S = (1-3) +...+(5-3) = 10<br />
i=1<br />
i xx<br />
Corrected sum of squares <strong>for</strong> y:<br />
n _<br />
! 2 2 2<br />
(y -y) = S = (5-7) +...+(8-7) = 10<br />
i=1<br />
i yy<br />
Corrected sum of cross products = S xy=<br />
n _ _<br />
! (x - x)(y -y) =<br />
i=1<br />
i i<br />
(-2)(-2)+(-1)(0)+...+(2)(1) = 5 =
n __<br />
! x y -n x y = 110-5(3)(7)<br />
i=1<br />
i i<br />
Slope: b = S xy/S xx = 5/10 = 0.5<br />
Intercept:<br />
_ _<br />
y - b x = 7-0.5(3) = 5.5<br />
y=5.5 ^ + 0.5x<br />
n<br />
y 5 7 9 6 8<br />
y^ 6 6.5 7 7.5 8<br />
r=y- y^ -1 0.5 2 -1.5 0<br />
! r = "Error sum of squares" =<br />
i=1<br />
i 2<br />
SSE = 1+0.25+4+2.25=7.5<br />
2 2<br />
SSE is also S yy - S xy/S<br />
xx = S yy - b S xx =<br />
2 10-5 /10<br />
Variance of b:<br />
MSE/Sxx œ 2.5/10 = 0.25.<br />
ÈMSE/S xx<br />
is called "standard error" of b.
Task: test H 0:<br />
true slope is 0<br />
t = b/ È0.25<br />
= 1 which is not an<br />
unusual t.<br />
data a; input x y @@; cards;<br />
1 5 2 7 3 9 4 6 5 8<br />
;<br />
proc reg; model Y =X / p;<br />
run;<br />
Dependent Variable: y<br />
Analysis of Variance<br />
Sum of Mean<br />
Source DF Squares Square F Value Pr > F<br />
Model 1 2.50000 2.50000 1.00 0.3910<br />
Error 3 7.50000 2.50000<br />
Corr Total 4 10.00000<br />
Root MSE 1.58114 R-Square 0.2500<br />
Dependent Mean 7.00000 Adj R-Sq 0.0000<br />
Coeff Var 22.58770<br />
Parameter Estimates<br />
Parameter Standard<br />
Variable DF Estimate Error t Value Pr > |t|<br />
Intercept 1 5.50000 1.65831 3.32 0.0452<br />
x 1 0.50000 0.50000 1.00 0.3910<br />
Output <strong>Statistics</strong>
Dep Var Predicted<br />
Obs y Value Residual<br />
1 5.0000 6.0000 -1.0000<br />
2 7.0000 6.5000 0.5000<br />
3 9.0000 7.0000 2.0000<br />
4 6.0000 7.5000 -1.5000<br />
5 8.0000 8.0000 0