EPID 766: Analysis of Longitudinal Data from ... - NCSU Statistics
EPID 766: Analysis of Longitudinal Data from ... - NCSU Statistics
EPID 766: Analysis of Longitudinal Data from ... - NCSU Statistics

You also want an ePaper? Increase the reach of your titles
YUMPU automatically turns print PDFs into web optimized ePapers that Google loves.
Epid <strong>766</strong> D. Zhang<br />
<strong>EPID</strong> <strong>766</strong>: <strong>Analysis</strong> <strong>of</strong> <strong>Longitudinal</strong> <strong>Data</strong><br />
<strong>from</strong> Epidemiologic Studies<br />
Graduate Summer Session in Epidemiology<br />
Daowen Zhang<br />
zhang@stat.ncsu.edu<br />
http://www4.stat.ncsu.edu/∼dzhang2
TABLE OF CONTENTS Epid <strong>766</strong>, D. Zhang<br />
Contents<br />
1 Review and introduction to longitudinal studies 3<br />
1.1 Review <strong>of</strong> 3 study designs . . . . . . . . . . . . . . . . . . 3<br />
1.2 Introduction to longitudinal studies . . . . . . . . . . . . . 9<br />
1.3 <strong>Data</strong> examples . . . . . . . . . . . . . . . . . . . . . . . . 10<br />
1.4 Features <strong>of</strong> longitudinal data . . . . . . . . . . . . . . . . 18<br />
1.5 Why longitudinal studies? . . . . . . . . . . . . . . . . . . 20<br />
1.6 Challenges in analyzing longitudinal data . . . . . . . . . . 23<br />
1.7 Methods for analyzing longitudinal data . . . . . . . . . . 28<br />
1.8 Two-stage method for analyzing longitudinal data . . . . . 29<br />
1.9 Analyzing Framingham data using two-stage method . . . 31<br />
2 Linear mixed models for normal longitudinal data 46<br />
2.1 What is a linear mixed (effects) model? . . . . . . . . . . 47<br />
2.2 Estimation and inference for linear mixed models . . . . . 63<br />
2.3 How to choose random effects and the error structure? . . 65<br />
Graduate Summer Session in Epidemiology
TABLE OF CONTENTS Epid <strong>766</strong>, D. Zhang<br />
2.4 Analyze Framingham data using linear mixed models . . . 66<br />
2.5 GEE for linear mixed models . . . . . . . . . . . . . . . . 102<br />
2.6 Missing data issues . . . . . . . . . . . . . . . . . . . . . 106<br />
3 Modeling and design issues 111<br />
3.1 How to handle baseline response? . . . . . . . . . . . . . . 112<br />
3.2 Do we model previous responses as covariates? . . . . . . 114<br />
3.3 Modeling outcome vs. modeling the change <strong>of</strong> outcome . . 116<br />
3.4 Design a longitudinal study: Sample size estimation . . . . 126<br />
4 Modeling discrete longitudinal data 133<br />
4.1 Generalized estimating equations (GEEs) for continuous<br />
and discrete longitudinal data . . . . . . . . . . . . . . . . 134<br />
4.1.1 Why GEEs? . . . . . . . . . . . . . . . . . . . . . 134<br />
4.1.2 Key features <strong>of</strong> GEEs for analyzing longitudinal data138<br />
4.1.3 Some popular GEE Models . . . . . . . . . . . . . 140<br />
4.1.4 Some basics <strong>of</strong> GEEs . . . . . . . . . . . . . . . . 142<br />
4.1.5 Interpretation <strong>of</strong> regression coefficients in a GEE<br />
Model . . . . . . . . . . . . . . . . . . . . . . . . 148<br />
Graduate Summer Session in Epidemiology
TABLE OF CONTENTS Epid <strong>766</strong>, D. Zhang<br />
4.1.6 Analyze Infectious disease data using GEE . . . . . 150<br />
4.1.7 Analyze epileptic seizure count data using GEE . . 156<br />
4.2 Generalized linear mixed models (GLMMs) . . . . . . . . . 167<br />
4.2.1 Model specification and implementation . . . . . . 167<br />
4.3 Analyze infectious disease data using a GLMM . . . . . . . 178<br />
4.4 Analyze epileptic count data using a GLMM . . . . . . . . 189<br />
5 Summary: what we covered 200<br />
Graduate Summer Session in Epidemiology
CHAPTER 1 Epid <strong>766</strong>, D. Zhang<br />
1 Review and introduction to<br />
longitudinal studies<br />
• Review <strong>of</strong> 3 study designs<br />
• Introduction to longitudinal (panel) studies<br />
• <strong>Data</strong> examples<br />
• Features <strong>of</strong> longitudinal data<br />
• Why longitudinal studies<br />
• Challenges in analyzing longitudinal data<br />
• Methods for analyzing longitudinal data: two-stage, linear mixed<br />
model, GEE, transition models<br />
• Two-stage method for analyzing longitudinal data<br />
• Analyzing Framingham data using two-stage method<br />
Graduate Summer Session in Epidemiology Slide 5
CHAPTER 1 Epid <strong>766</strong>, D. Zhang<br />
1.1 Review <strong>of</strong> 3 study designs<br />
1. Cross-sectional study:<br />
• Information on disease status (Y ) and exposure status (X) is<br />
obtained <strong>from</strong> a random sample at one time point. A snap<br />
shot <strong>of</strong> population.<br />
• A single observation <strong>of</strong> each variable <strong>of</strong> interest is measured <strong>from</strong><br />
each subject: (Yi, Xi) (i = 1, ..., n). Regression such as logistic<br />
regression (if Yi is binary) can be used to assess the<br />
association between Y and X:<br />
� �<br />
P[Yi = 1|Xi]<br />
log<br />
= β0 + β1Xi<br />
1 − P[Yi = 1|Xi]<br />
� �<br />
P[Y = 1|X = 1]/(1 − P[Y = 1|X = 1])<br />
β1 = log<br />
P[Y = 1|X = 0]/(1 − P[Y = 1|X = 0])<br />
β1 = log odds-ratio between exposure population (X = 1) and<br />
non exposure population (X = 0). β1 > 0 =⇒ exposure<br />
population has higher probability <strong>of</strong> getting disease.<br />
Graduate Summer Session in Epidemiology Slide 6
CHAPTER 1 Epid <strong>766</strong>, D. Zhang<br />
• Given data as follows,<br />
Y = 1 Y = 0<br />
X = 1 n11 n10<br />
X = 0 n01 n00<br />
then the MLE <strong>of</strong> β1 is given by<br />
�β1 = log<br />
� n11n00<br />
n10n01<br />
• Feature: All numbers n00, n01, n10, n11 are random.<br />
• No causal inference can be made! � β1 may not be stable (e.g.,<br />
n11 may be too small). Useful public health information can be<br />
obtained, such as the proportion <strong>of</strong> people in the population with<br />
disease, the proportion <strong>of</strong> people in the population under<br />
exposure.<br />
• Can account for confounders in the model.<br />
Graduate Summer Session in Epidemiology Slide 7<br />
�
CHAPTER 1 Epid <strong>766</strong>, D. Zhang<br />
2. Prospective cohort study (follow-up study):<br />
• A cohort with known exposure status (X) is followed over time<br />
to obtain their disease status (Y ).<br />
• A single observation <strong>of</strong> (Y ) may be observed (e.g., survival<br />
study) or multiple observations <strong>of</strong> (Y ) may be observed<br />
(longitudinal study).<br />
• Stronger evidence for causal inference. Causal inference can be<br />
made if X is assigned randomly (if X is a treatment indicator in<br />
the case <strong>of</strong> clinical trials).<br />
• When single binary (0/1) Y is obtained, we have<br />
D D<br />
E n11 n10 n1+<br />
E n01 n00 n0+<br />
Here, n1+ and n0+ are fixed (sample sizes for exposure and nonexposure<br />
groups).<br />
Graduate Summer Session in Epidemiology Slide 8
CHAPTER 1 Epid <strong>766</strong>, D. Zhang<br />
3. Retrospective (case-control) study:<br />
• A sample with known disease status (D) is drawn and their<br />
exposure history (E) is ascertained. <strong>Data</strong> can be summarized as<br />
D D<br />
E n11 n10<br />
E n01 n00<br />
n+1 n+0<br />
where the margins n+1 and n+0 are fixed numbers.<br />
• Assuming no bias in obtaining history information on E,<br />
association between E and D can be estimated.<br />
n11 ∼ Bin(n+1, P[E|D]), n10 ∼ Bin(n+0, P[E|D]).<br />
Odds ratio: estimate <strong>from</strong> this study<br />
�θ = n11n00<br />
n10n01<br />
Graduate Summer Session in Epidemiology Slide 9
CHAPTER 1 Epid <strong>766</strong>, D. Zhang<br />
estimates the following quantity<br />
θ =<br />
P[E|D]/(1 − P[E|D])<br />
P[E|D]/(1 − P[E|D])<br />
= P[D|E]/(1 − P[D|E])<br />
P[D|E]/(1 − P[D|E]) .<br />
• If disease is rare, i.e., P[D|E] ≈ 0, P[D|E] ≈ 0, relative risk <strong>of</strong><br />
disease can be approximately obtained:<br />
θ ≈ P[D|E]<br />
P[D|E]<br />
= relative risk.<br />
More efficient than prospective cohort study in this case.<br />
• Problem: recall bias! (it is difficult to ascertain exposure<br />
history E.)<br />
Graduate Summer Session in Epidemiology Slide 10
CHAPTER 1 Epid <strong>766</strong>, D. Zhang<br />
1.2 Introduction to longitudinal studies<br />
A longitudinal study is a prospective cohort study where repeated<br />
measures are taken over time for each individual.<br />
A longitudinal study is usually designed to answer the following<br />
questions:<br />
1. How does the variable <strong>of</strong> interest change over time?<br />
2. How is the (change <strong>of</strong>) variable <strong>of</strong> interest associated with<br />
treatment and other covariates?<br />
3. How does the variable <strong>of</strong> interest relate to each other over time?<br />
4. · · ·<br />
Graduate Summer Session in Epidemiology Slide 11
CHAPTER 1 Epid <strong>766</strong>, D. Zhang<br />
1.3 <strong>Data</strong> examples<br />
Example 1: Framingham study<br />
In the Framingham study, each <strong>of</strong> 2634 participants was examined every<br />
2 years for a 10 year period for his/her cholesterol level.<br />
Study objectives:<br />
1. How does cholesterol level change over time on average as people<br />
get older?<br />
2. How is the change <strong>of</strong> cholesterol level associated with sex and<br />
baseline age?<br />
3. Do males have more stable (true) baseline cholesterol level and<br />
change rate than females?<br />
A subset <strong>of</strong> 200 subjects’ data is used for illustrative purpose.<br />
Graduate Summer Session in Epidemiology Slide 12
CHAPTER 1 Epid <strong>766</strong>, D. Zhang<br />
A glimpse <strong>of</strong> the raw data<br />
newid id cholst sex age year<br />
1 1244 175 1 32 0<br />
1 1244 198 1 32 2<br />
1 1244 205 1 32 4<br />
1 1244 228 1 32 6<br />
1 1244 214 1 32 8<br />
1 1244 214 1 32 10<br />
2 835 299 0 34 0<br />
2 835 328 0 34 4<br />
2 835 374 0 34 6<br />
2 835 362 0 34 8<br />
2 835 370 0 34 10<br />
3 176 250 0 41 0<br />
3 176 277 0 41 2<br />
3 176 265 0 41 4<br />
3 176 254 0 41 6<br />
3 176 263 0 41 8<br />
3 176 268 0 41 10<br />
4 901 243 0 44 0<br />
4 901 211 0 44 2<br />
4 901 204 0 44 4<br />
4 901 196 0 44 6<br />
4 901 246 0 44 8<br />
Graduate Summer Session in Epidemiology Slide 13
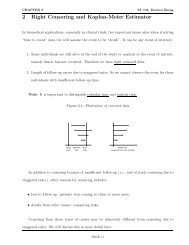
CHAPTER 1 Epid <strong>766</strong>, D. Zhang<br />
Cholesterol level over time for a subset <strong>of</strong> 200 subjects <strong>from</strong><br />
Framingham study<br />
Cholesterol level<br />
150 200 250 300 350 400<br />
Cholesterol levels over time<br />
•<br />
•<br />
•<br />
•<br />
•<br />
•<br />
•<br />
•<br />
•<br />
•<br />
•<br />
•<br />
•<br />
•<br />
•<br />
•<br />
•<br />
•<br />
•<br />
•<br />
• •<br />
•<br />
•<br />
•<br />
•<br />
•<br />
•<br />
•<br />
•<br />
•<br />
•<br />
•<br />
•<br />
•<br />
•<br />
•<br />
•<br />
•<br />
•<br />
•<br />
•<br />
•<br />
•<br />
•<br />
•<br />
•<br />
•<br />
•<br />
•<br />
•<br />
•<br />
•<br />
•<br />
•<br />
•<br />
•<br />
•<br />
•<br />
•<br />
•<br />
•<br />
•<br />
•<br />
•<br />
•<br />
•<br />
•<br />
•<br />
•<br />
•<br />
•<br />
•<br />
•<br />
•<br />
•<br />
•<br />
•<br />
•<br />
•<br />
•<br />
•<br />
•<br />
• •<br />
•<br />
•<br />
•<br />
• •<br />
•<br />
•<br />
•<br />
•<br />
• •<br />
•<br />
•<br />
•<br />
•<br />
•<br />
•<br />
•<br />
•<br />
•<br />
•<br />
•<br />
•<br />
•<br />
•<br />
•<br />
•<br />
•<br />
•<br />
•<br />
•<br />
•<br />
•<br />
•<br />
•<br />
• •<br />
•<br />
•<br />
•<br />
•<br />
•<br />
•<br />
•<br />
•<br />
•<br />
•<br />
•<br />
•<br />
•<br />
•<br />
•<br />
•<br />
•<br />
•<br />
•<br />
•<br />
•<br />
•<br />
•<br />
•<br />
•<br />
•<br />
•<br />
•<br />
•<br />
•<br />
• •<br />
•<br />
• • •<br />
•<br />
•<br />
•<br />
•<br />
•<br />
•<br />
•<br />
•<br />
•<br />
•<br />
•<br />
•<br />
•<br />
•<br />
•<br />
•<br />
•<br />
•<br />
•<br />
•<br />
•<br />
•<br />
•<br />
•<br />
•<br />
•<br />
•<br />
•<br />
•<br />
•<br />
•<br />
•<br />
•<br />
•<br />
•<br />
•<br />
•<br />
• •<br />
•<br />
•<br />
•<br />
•<br />
•<br />
•<br />
•<br />
•<br />
•<br />
•<br />
•<br />
•<br />
•<br />
•<br />
•<br />
•<br />
•<br />
•<br />
•<br />
•<br />
•<br />
•<br />
•<br />
•<br />
•<br />
•<br />
•<br />
•<br />
•<br />
•<br />
•<br />
•<br />
•<br />
•<br />
•<br />
•<br />
•<br />
•<br />
•<br />
•<br />
• •<br />
•<br />
•<br />
•<br />
•<br />
• •<br />
•<br />
•<br />
•<br />
•<br />
•<br />
•<br />
•<br />
•<br />
• •<br />
•<br />
•<br />
•<br />
•<br />
•<br />
•<br />
•<br />
•<br />
•<br />
•<br />
•<br />
•<br />
•<br />
•<br />
•<br />
•<br />
•<br />
•<br />
•<br />
•<br />
•<br />
•<br />
•<br />
•<br />
•<br />
•<br />
•<br />
•<br />
• •<br />
•<br />
•<br />
•<br />
•<br />
•<br />
•<br />
•<br />
•<br />
•<br />
•<br />
•<br />
•<br />
•<br />
•<br />
• •<br />
• • •<br />
•<br />
• •<br />
•<br />
•<br />
•<br />
•<br />
•<br />
•<br />
•<br />
•<br />
•<br />
• •<br />
•<br />
•<br />
•<br />
•<br />
•<br />
•<br />
•<br />
•<br />
•<br />
•<br />
•<br />
•<br />
•<br />
•<br />
•<br />
•<br />
• •<br />
•<br />
•<br />
•<br />
•<br />
• •<br />
•<br />
•<br />
•<br />
•<br />
•<br />
•<br />
•<br />
•<br />
•<br />
•<br />
•<br />
•<br />
•<br />
•<br />
•<br />
•<br />
•<br />
•<br />
•<br />
•<br />
•<br />
•<br />
•<br />
•<br />
•<br />
•<br />
•<br />
•<br />
•<br />
•<br />
•<br />
•<br />
•<br />
•<br />
•<br />
•<br />
•<br />
•<br />
•<br />
•<br />
•<br />
• •<br />
•<br />
•<br />
•<br />
•<br />
•<br />
•<br />
•<br />
•<br />
•<br />
• •<br />
•<br />
•<br />
•<br />
•<br />
•<br />
•<br />
•<br />
•<br />
•<br />
•<br />
•<br />
•<br />
•<br />
• •<br />
•<br />
•<br />
•<br />
•<br />
•<br />
•<br />
•<br />
•<br />
•<br />
•<br />
•<br />
•<br />
•<br />
•<br />
•<br />
•<br />
•<br />
•<br />
•<br />
•<br />
•<br />
•<br />
•<br />
•<br />
•<br />
•<br />
•<br />
•<br />
• •<br />
•<br />
•<br />
•<br />
•<br />
•<br />
•<br />
•<br />
•<br />
•<br />
•<br />
•<br />
•<br />
•<br />
•<br />
•<br />
•<br />
•<br />
•<br />
•<br />
•<br />
•<br />
•<br />
•<br />
•<br />
•<br />
• •<br />
•<br />
•<br />
•<br />
•<br />
•<br />
•<br />
•<br />
•<br />
•<br />
•<br />
•<br />
•<br />
•<br />
• •<br />
• •<br />
• •<br />
•<br />
• •<br />
•<br />
•<br />
•<br />
•<br />
•<br />
•<br />
•<br />
•<br />
• •<br />
•<br />
•<br />
•<br />
•<br />
•<br />
•<br />
•<br />
•<br />
•<br />
•<br />
•<br />
•<br />
•<br />
•<br />
•<br />
•<br />
•<br />
•<br />
•<br />
•<br />
•<br />
•<br />
•<br />
• •<br />
•<br />
•<br />
•<br />
•<br />
• •<br />
•<br />
•<br />
•<br />
•<br />
•<br />
•<br />
•<br />
•<br />
•<br />
•<br />
• • •<br />
•<br />
•<br />
•<br />
•<br />
•<br />
•<br />
•<br />
•<br />
• •<br />
•<br />
•<br />
• •<br />
•<br />
• •<br />
•<br />
•<br />
•<br />
•<br />
•<br />
•<br />
•<br />
•<br />
•<br />
•<br />
•<br />
• •<br />
•<br />
•<br />
•<br />
•<br />
•<br />
•<br />
•<br />
•<br />
•<br />
•<br />
•<br />
•<br />
•<br />
•<br />
•<br />
•<br />
•<br />
•<br />
•<br />
•<br />
•<br />
•<br />
•<br />
•<br />
•<br />
•<br />
•<br />
•<br />
•<br />
•<br />
•<br />
•<br />
•<br />
•<br />
•<br />
•<br />
•<br />
•<br />
•<br />
•<br />
•<br />
•<br />
•<br />
•<br />
•<br />
•<br />
• •<br />
•<br />
•<br />
•<br />
•<br />
•<br />
•<br />
• •<br />
•<br />
•<br />
•<br />
•<br />
•<br />
•<br />
•<br />
•<br />
•<br />
•<br />
•<br />
•<br />
•<br />
•<br />
•<br />
•<br />
•<br />
•<br />
•<br />
•<br />
•<br />
•<br />
•<br />
•<br />
•<br />
•<br />
•<br />
•<br />
•<br />
•<br />
•<br />
•<br />
•<br />
•<br />
•<br />
•<br />
•<br />
•<br />
•<br />
•<br />
•<br />
•<br />
•<br />
•<br />
•<br />
•<br />
•<br />
•<br />
•<br />
•<br />
•<br />
•<br />
•<br />
•<br />
•<br />
•<br />
•<br />
•<br />
•<br />
•<br />
•<br />
•<br />
•<br />
•<br />
•<br />
•<br />
•<br />
• •<br />
•<br />
•<br />
•<br />
•<br />
•<br />
•<br />
•<br />
•<br />
•<br />
•<br />
•<br />
•<br />
• •<br />
•<br />
•<br />
•<br />
0 2 4 6 8 10<br />
Time in years<br />
Graduate Summer Session in Epidemiology Slide 14<br />
•<br />
•
CHAPTER 1 Epid <strong>766</strong>, D. Zhang<br />
What we observed <strong>from</strong> this data set:<br />
1. Cholesterol levels increase (linearly) over time for most individuals.<br />
2. Each subject has his/her own trajectory line with a possibly different<br />
intercept and slope, implying two sources <strong>of</strong> variations: within and<br />
between subject variations.<br />
3. Each subject has on average 5 observations (as opposed to one<br />
observation per subject for a cross-sectional study)<br />
4. The data is not balanced. Some individuals have missing<br />
observations.<br />
5. The inference is NOT limited to these 200 individuals. Instead, the<br />
inference is for the target population and each subject is viewed as a<br />
random person drawn <strong>from</strong> the target population.<br />
Graduate Summer Session in Epidemiology Slide 15
CHAPTER 1 Epid <strong>766</strong>, D. Zhang<br />
Example 2: Respiratory Infection Disease<br />
Each <strong>of</strong> 275 Indonesian preschool children was examined up to six<br />
consecutive quarters for the presence <strong>of</strong> respiratory infection (yes/no).<br />
Information on age, sex, height for age, xerophthalmia (vitamin A<br />
deficiency) was also obtained.<br />
Study objectives:<br />
• Was the risk <strong>of</strong> respiratory infection related to vitamin A deficiency<br />
after adjusting for age, sex, and height for age, etc.?<br />
Features <strong>of</strong> this data set:<br />
1. Outcome is whether or not a child has respiratory infection, i.e.,<br />
binary outcome.<br />
2. Some covariates (age, vitamin A deficiency and height) are<br />
time-varying covariates and some are one-time covariates.<br />
Graduate Summer Session in Epidemiology Slide 16
CHAPTER 1 Epid <strong>766</strong>, D. Zhang<br />
Proportions <strong>of</strong> respiratory infection and vitamin A<br />
deficiency<br />
Proportion <strong>of</strong> respiratory infection<br />
0.0 0.05 0.10 0.15<br />
1 2 3 4 5 6<br />
Order <strong>of</strong> visit<br />
Proportion <strong>of</strong> vitamin A deficiency<br />
0.0 0.02 0.04 0.06<br />
1 2 3 4 5 6<br />
Order <strong>of</strong> visit<br />
Graduate Summer Session in Epidemiology Slide 17
CHAPTER 1 Epid <strong>766</strong>, D. Zhang<br />
Example 3: Epileptic seizure counts <strong>from</strong> progabide trial<br />
In progabide trial, 59 epileptics were randomly assigned to receive<br />
anti-epileptic treatment (progabide) or placebo. The number <strong>of</strong> seizure<br />
counts was recorded in 4 consecutive 2-week intervals. Age and baseline<br />
seizure counts (for an 8 week period prior to treatment assignment) were<br />
also recorded.<br />
Study objectives:<br />
• Does the treatment work?<br />
• What is the treatment effect adjusting for available covariates?<br />
Features <strong>of</strong> this data set:<br />
1. Outcome is count data, implying Poisson regression.<br />
2. Baseline seizure counts were for 8 weeks, as opposed to 2 weeks for<br />
other seizure counts.<br />
3. Randomization may be taken into account in data analysis.<br />
Graduate Summer Session in Epidemiology Slide 18
CHAPTER 1 Epid <strong>766</strong>, D. Zhang<br />
Epileptic seizure counts <strong>from</strong> progabide trial<br />
Seizure counts<br />
0 50 100 150<br />
Seizure counts for progabide arm<br />
0 1 2 3 4<br />
Order <strong>of</strong> visit<br />
Seizure counts<br />
0 50 100 150<br />
Seizure counts for control arm<br />
0 1 2 3 4<br />
Order <strong>of</strong> visit<br />
Graduate Summer Session in Epidemiology Slide 19
CHAPTER 1 Epid <strong>766</strong>, D. Zhang<br />
1.4 Features <strong>of</strong> longitudinal data<br />
Common features <strong>of</strong> all examples:<br />
• Each subject has multiple time-ordered observations <strong>of</strong> response.<br />
• Responses <strong>from</strong> same subject may be “more alike” than others.<br />
• Inference NOT in study subjects, but in population <strong>from</strong> which they<br />
are <strong>from</strong>.<br />
• # <strong>of</strong> subjects >> # <strong>of</strong> observations/subject<br />
• Source <strong>of</strong> variations – between and within subject variations.<br />
Difference in the examples:<br />
• Different type <strong>of</strong> responses (continuous, binary, count).<br />
• Objectives depend on type <strong>of</strong> study – “mean” behavior, etc.<br />
Graduate Summer Session in Epidemiology Slide 20
CHAPTER 1 Epid <strong>766</strong>, D. Zhang<br />
Comparison <strong>of</strong> data structures:<br />
Classical study <strong>Longitudinal</strong> study<br />
Subject <strong>Data</strong> Subject <strong>Data</strong> Time<br />
1 x1 1 x11, x12, ..., x15 t11, t12, ..., t15<br />
y1 y11, y12, ..., y15 t11, t12, ..., t15<br />
2 x2 2 x21, x22, ..., x25 t21, t22, ..., t25<br />
y2 y21, y22, ..., y25 t21, t22, ..., t25<br />
For simplicity, we consider one covariate case.<br />
Graduate Summer Session in Epidemiology Slide 21
CHAPTER 1 Epid <strong>766</strong>, D. Zhang<br />
1.5 Why longitudinal studies?<br />
1. A longitudinal study allows us to study the change <strong>of</strong> the variable <strong>of</strong><br />
interest over time, either population level or individual level.<br />
2. A longitudinal study enables us to separately estimate the<br />
cross-sectional effect (e.g., cohort effect) and the longitudinal effect<br />
(e.g., aging effect):<br />
Given yij, age ij (j = 1, 2, · · · , ni, j = 1 is baseline). In a<br />
cross-sectional study, ni = 1 and we are forced to fit the following<br />
model<br />
yi1 = β0 + βCage i1 + ǫi1.<br />
That is, βC is the cross-sectional effect <strong>of</strong> age.<br />
With longitudinal data (ni > 1), we can entertain the model<br />
yij = β0 + βCage i1 + βL(age ij − age i1) + ǫij.<br />
Graduate Summer Session in Epidemiology Slide 22
CHAPTER 1 Epid <strong>766</strong>, D. Zhang<br />
Then<br />
yi1 = β0 + βCage i1 + ǫi1 (let j = 1),<br />
yij − yi1 = βL(age ij − age i1) + ǫij − ǫi1.<br />
That is, βL is the longitudinal effect <strong>of</strong> age and in general βL �= βC.<br />
3. A longitudinal study is more powerful to detect an association <strong>of</strong><br />
interest compared to a cross-sectional study, =⇒ more efficient, less<br />
sample size (number <strong>of</strong> subjects).<br />
4. A longitudinal study allows us to study the within-subject and<br />
between-subject variations.<br />
Suppose b ∼ (µ, σ2 b ) is the blood pressure for a patient population.<br />
However, what we observe is Y = b + e, where e ∼ (0, σ2 e) is the<br />
measurement error.<br />
• σ 2 e = within-subject variation<br />
• σ 2 b<br />
= between-subject variation<br />
Graduate Summer Session in Epidemiology Slide 23
CHAPTER 1 Epid <strong>766</strong>, D. Zhang<br />
If we have only one observation Yi for each subject <strong>from</strong> a sample <strong>of</strong><br />
n patients, then we can’t separate σ2 e and σ2 b . Although we can use<br />
data Y1, Y2, ..., Yn to make inference on µ, we can’t make any<br />
inference on σ2 b .<br />
However, if we have repeated (or longitudinal) measurements Yij <strong>of</strong><br />
blood pressure for each subjects, then<br />
Yij = bi + eij.<br />
Now, it is possible to make inference about all quantities µ, σ 2 b and<br />
σ 2 e.<br />
5. A longitudinal study provides more evidence for possible causal<br />
interpretation.<br />
Graduate Summer Session in Epidemiology Slide 24
CHAPTER 1 Epid <strong>766</strong>, D. Zhang<br />
1.6 Challenges in analyzing longitudinal data<br />
Key assumptions in a classical regression model: There is only<br />
one observation <strong>of</strong> response per subject, =⇒ responses are independent<br />
to each other. For example, when y = cholesterol level,<br />
yi = β0 + β1age i + β2sexi + ǫi.<br />
However, the observations <strong>from</strong> the same subject in a longitudinal<br />
study tend to be more similar to each other than those observations<br />
<strong>from</strong> other subjects, =⇒ responses (<strong>from</strong> the same subjects) are not<br />
independent any more. Although, the observations <strong>from</strong> different<br />
subjects are still independent.<br />
What happens if we treat observations as independent (i.e.,<br />
ignore the correlation)?<br />
1. In general, the estimation <strong>of</strong> the associations (regression<br />
coefficients) <strong>of</strong> the outcome and covariates is valid.<br />
Graduate Summer Session in Epidemiology Slide 25
CHAPTER 1 Epid <strong>766</strong>, D. Zhang<br />
2. However, the variability measures (e.g, the SEs <strong>from</strong> a classical<br />
regression analysis) are not right: sometimes smaller, sometimes<br />
bigger than the true variability.<br />
3. Therefore, the inference is not valid (too significant than it should<br />
be if the SE is too small).<br />
Sources <strong>of</strong> variation and correlation in longitudinal data:<br />
1. Between-subject variation: For the blood pressure example, if each<br />
subject’s blood pressures were measured within a relatively short<br />
time, then the following model may be a reasonable one:<br />
yij = bi + eij,<br />
where bi is the true blood pressure <strong>of</strong> subject i, eij is the<br />
independent (random) measurement error, independent <strong>of</strong> bi.<br />
Graduate Summer Session in Epidemiology Slide 26
CHAPTER 1 Epid <strong>766</strong>, D. Zhang<br />
For j �= k,<br />
corr(yij, yik) =<br />
=<br />
cov(yij, yik)<br />
� var(yij)var(yik)<br />
σ 2 b<br />
σ 2 b + σ2 e<br />
Therefore, if the between-subject variation σ2 b<br />
the same subjects are correlated.<br />
.<br />
�= 0, then data <strong>from</strong><br />
Graduate Summer Session in Epidemiology Slide 27
CHAPTER 1 Epid <strong>766</strong>, D. Zhang<br />
The blood pressure example<br />
blood pressure<br />
100 110 120 130 140<br />
5 10 15 20 25<br />
Graduate Summer Session in Epidemiology Slide 28<br />
minute
CHAPTER 1 Epid <strong>766</strong>, D. Zhang<br />
2. Serial correlation: If the time intervals between blood pressure<br />
measurements are relatively large so it may not be reasonable to<br />
assume a constant blood pressure for each subject:<br />
yij = bi + Ui(tij) + ǫij,<br />
where bi = true long-term blood pressure, Ui(tij) =a stochastic<br />
process (like a time series) due to biological fluctuation <strong>of</strong> blood<br />
pressure, ǫij is the independent (random) measurement error. Here<br />
the correlation is caused by both bi and Ui(tij).<br />
3. In a typical longitudinal study for human where # <strong>of</strong><br />
observations/subject is small ∼ moderate, there may not be enough<br />
information for the serial correlation and most correlation can be<br />
accounted for by (possibly complicated) between-subject variation.<br />
Graduate Summer Session in Epidemiology Slide 29
CHAPTER 1 Epid <strong>766</strong>, D. Zhang<br />
1.7 Methods for analyzing longitudinal data<br />
1. Two-stage: summarize each subject’s outcome and regress the<br />
summary statistics on one-time covariates. Especially useful for<br />
continuous longitudinal data. However, this method is getting<br />
out-dated since mixed model approach can do the same even better.<br />
2. Mixed (effects) model approach: model fixed effects and random<br />
effects; use random effect to model correlation.<br />
3. Generalized estimating equation (GEE) approach: model the<br />
dependence <strong>of</strong> marginal mean on covariates. Correlation is not a<br />
main interest. Particularly good for discrete data.<br />
4. transition models: use history as covariates. Good for prediction <strong>of</strong><br />
future response using history.<br />
Graduate Summer Session in Epidemiology Slide 30
CHAPTER 1 Epid <strong>766</strong>, D. Zhang<br />
1.8 Two-stage method for analyzing longitudinal<br />
data<br />
• Outcome (continuous): yi1, ..., yini measured at ti1, ..., tini,<br />
one-time covariates: xi1, ..., xip.<br />
• Two-stage analysis is conducted as follows:<br />
1. Stage 1: Get summary statistics <strong>from</strong> subject i’s data:<br />
yi1, ..., yini. For example, use mean ¯yi = (yi1 + · · · + yini)/ni or<br />
fit a linear regression for each subject:<br />
yij = bi0 + bi1tij + ǫij,<br />
and get estimates � bi0, � bi1 <strong>of</strong> bi0 and bi1. Here we assume that<br />
subject i’s true response at time tij is given by<br />
bi0 + bi1tij,<br />
a straight line. Suppose t = 0 is the baseline, then bi0 is subject<br />
i’s true response at baseline and bi1 is subject i’s change rate <strong>of</strong><br />
Graduate Summer Session in Epidemiology Slide 31
CHAPTER 1 Epid <strong>766</strong>, D. Zhang<br />
the true response (not y). The error term ǫij can be regarded<br />
as measurement error.<br />
2. Stage 2: Treat the summary statistics as new responses and<br />
regress the summary statistics on one-time covariates. For<br />
example, after we got � bi0 and � bi1, we can calculate the means <strong>of</strong><br />
� bi0 and � bi1 and the standard errors <strong>of</strong> those means, or do the<br />
following regressions<br />
� bi0 = α0 + α1xi1 + · · · + αpxip + ei0<br />
� bi1 = β0 + β1xi1 + · · · + βpxip + ei1.<br />
Here, αk is the effect <strong>of</strong> xk on the true baseline response (not<br />
y), βk is the effect <strong>of</strong> xk on the change rate <strong>of</strong> <strong>of</strong> the true<br />
response.<br />
Graduate Summer Session in Epidemiology Slide 32
CHAPTER 1 Epid <strong>766</strong>, D. Zhang<br />
1.9 Analyzing Framingham data using two-stage<br />
method<br />
Example 1(a) The Framingham study:<br />
• Stage I: For each subject, fit<br />
and get estimates � bi0 and � bi1.<br />
SAS program for stage I:<br />
options ls=80 ps=200;<br />
data cholst;<br />
infile "cholst.dat";<br />
input newid id cholst sex age year;<br />
run;<br />
proc sort;<br />
by newid year;<br />
run;<br />
proc print data=cholst (obs=20);<br />
var newid cholst sex age year;<br />
run;<br />
yij = bi0 + bi1tij + ǫij.<br />
Graduate Summer Session in Epidemiology Slide 33
CHAPTER 1 Epid <strong>766</strong>, D. Zhang<br />
title "First stage in two-stage analysis";<br />
proc reg outest=out noprint;<br />
model cholst = year;<br />
by newid;<br />
run;<br />
data out; set out;<br />
b0hat = intercept;<br />
b1hat = year;<br />
keep newid b0hat b1hat;<br />
run;<br />
data main; merge cholst out;<br />
by newid;<br />
if first.newid=1;<br />
run;<br />
title "Summary statistics for intercepts and slopes";<br />
proc means mean stderr var t probt;<br />
var b0hat b1hat;<br />
run;<br />
title "Correlation between intercepts and slopes";<br />
proc corr;<br />
var b0hat b1hat;<br />
run;<br />
Graduate Summer Session in Epidemiology Slide 34
CHAPTER 1 Epid <strong>766</strong>, D. Zhang<br />
Part <strong>of</strong> output <strong>from</strong> above SAS program:<br />
Summary statististics for intercepts and slopes 2<br />
The MEANS Procedure<br />
Variable Mean Std Error Variance t Value Pr > |t|<br />
------------------------------------------------------------------------------b0hat<br />
220.6893518 2.9478698 1737.99 74.86
CHAPTER 1 Epid <strong>766</strong>, D. Zhang<br />
S 2b0<br />
Summary statistics <strong>from</strong> stage 1:<br />
Parameter mean SE t P[T ≥ |t|]<br />
� b0 221 3 75 < .0001<br />
� b1 2.55 0.257 10 < .0001 �corr( � b0, � b1) = −0.27<br />
Note:<br />
= 1738, S 2b1<br />
= 13.2.<br />
1. Similar to the blood pressure example, we can use the sample means<br />
<strong>of</strong> � b0 and � b1 to estimate the means <strong>of</strong> b0 and b1. Hence we can use<br />
sample mean <strong>of</strong> � b1 (2.55) its SE (0.257) to answer the first objective<br />
<strong>of</strong> this study.<br />
2. However, since var( � bi0) and var( � bi1) contain variability due to<br />
estimating the true baseline response bi0 and change rate bi1 for<br />
individual i, so<br />
var( � bi0) > var(bi0), var( � bi1) > var(bi1).<br />
Graduate Summer Session in Epidemiology Slide 36
CHAPTER 1 Epid <strong>766</strong>, D. Zhang<br />
Sample variances S2b0 and S2b1 are unbiased estimates <strong>of</strong> var( �bi0) and<br />
var( �bi1) and would overestimate var(bi0) and var(bi1).<br />
3. Similarly,<br />
corr( � b0, � b1) �= corr(b0, b1).<br />
Therefore, �corr( � b0, � b1) = −0.27 cannot be used to estimate the<br />
correlation between the true baseline response b0 and true change<br />
rate b1.<br />
4. We will use mixed model approach to address the above issues later.<br />
Graduate Summer Session in Epidemiology Slide 37
CHAPTER 1 Epid <strong>766</strong>, D. Zhang<br />
• Stage II:<br />
1. Try to compare E(b0) and E(b1) between males and females.<br />
2. Try to compare var(b0) and var(b1) between males and females.<br />
3. Try to examine the effects <strong>of</strong> age and sex on b0 using<br />
� b0 = α0 + α1sex + α2age + e0.<br />
Technically, we should use b0 instead <strong>of</strong> � b0. However, � b0 is an<br />
unbiased estimate <strong>of</strong> b0 (and b0 is not observable), so using � b0 is<br />
valid.<br />
4. Try to examine the effects <strong>of</strong> age and sex on b1 using<br />
� b1 = β0 + β1sex + β2age + e1.<br />
Similar to the above argument, using � b1 here is valid.<br />
Graduate Summer Session in Epidemiology Slide 38
CHAPTER 1 Epid <strong>766</strong>, D. Zhang<br />
SAS program for stage II:<br />
title "Test equality <strong>of</strong> mean and variance <strong>of</strong> intercepts and slopes between sexes";<br />
proc ttest;<br />
class sex;<br />
var b0hat b1hat;<br />
run;<br />
title "Regression to look at the association between intercept and age, sex";<br />
proc reg data=main;<br />
model b0hat = age sex;<br />
run;<br />
title "Regression to look at the association between slope and age, sex";<br />
proc reg data=main;<br />
model b1hat = age sex;<br />
run;<br />
Graduate Summer Session in Epidemiology Slide 39
CHAPTER 1 Epid <strong>766</strong>, D. Zhang<br />
Part <strong>of</strong> output <strong>from</strong> above SAS program:<br />
Test equality <strong>of</strong> mean and variance <strong>of</strong> intercepts and slopes between sexes 4<br />
The TTEST Procedure<br />
Variable: b0hat<br />
sex N Mean Std Dev Std Err Minimum Maximum<br />
0 97 224.0 40.2259 4.0843 146.3 348.1<br />
1 103 217.6 42.9885 4.2358 141.1 360.2<br />
Diff (1-2) 6.3629 41.6719 5.8960<br />
sex Method Mean 95% CL Mean Std Dev 95% CL Std Dev<br />
0 224.0 215.9 232.1 40.2259 35.2522 46.8465<br />
1 217.6 209.2 226.0 42.9885 37.8123 49.8197<br />
Diff (1-2) Pooled 6.3629 -5.2640 17.9898 41.6719 37.9405 46.2237<br />
Diff (1-2) Satterthwaite 6.3629 -5.2408 17.9666<br />
Method Variances DF t Value Pr > |t|<br />
Pooled Equal 198 1.08 0.2818<br />
Satterthwaite Unequal 197.99 1.08 0.2809<br />
Equality <strong>of</strong> Variances<br />
Method Num DF Den DF F Value Pr > F<br />
Folded F 102 96 1.14 0.5117<br />
Graduate Summer Session in Epidemiology Slide 40
CHAPTER 1 Epid <strong>766</strong>, D. Zhang<br />
Variable: b1hat<br />
sex N Mean Std Dev Std Err Minimum Maximum<br />
0 97 1.7454 3.3567 0.3408 -14.0000 8.3000<br />
1 103 3.3083 3.7282 0.3673 -11.3750 11.7429<br />
Diff (1-2) -1.5629 3.5529 0.5027<br />
sex Method Mean 95% CL Mean Std Dev 95% CL Std Dev<br />
0 1.7454 1.0688 2.4219 3.3567 2.9417 3.9092<br />
1 3.3083 2.5796 4.0369 3.7282 3.2793 4.3206<br />
Diff (1-2) Pooled -1.5629 -2.5542 -0.5716 3.5529 3.2348 3.9410<br />
Diff (1-2) Satterthwaite -1.5629 -2.5511 -0.5747<br />
Method Variances DF t Value Pr > |t|<br />
Pooled Equal 198 -3.11 0.0022<br />
Satterthwaite Unequal 197.61 -3.12 0.0021<br />
Equality <strong>of</strong> Variances<br />
Method Num DF Den DF F Value Pr > F<br />
Folded F 102 96 1.23 0.2996<br />
Graduate Summer Session in Epidemiology Slide 41
CHAPTER 1 Epid <strong>766</strong>, D. Zhang<br />
Regression to look at the association between intercept and age, sex 5<br />
The REG Procedure<br />
Model: MODEL1<br />
Dependent Variable: b0hat<br />
<strong>Analysis</strong> <strong>of</strong> Variance<br />
Sum <strong>of</strong> Mean<br />
Source DF Squares Square F Value Pr > F<br />
Model 2 53715 26857 18.11 |t|<br />
Intercept 1 138.21793 15.04083 9.19
CHAPTER 1 Epid <strong>766</strong>, D. Zhang<br />
Regression to look at the association between slope and age, sex 6<br />
The REG Procedure<br />
Model: MODEL1<br />
Dependent Variable: b1hat<br />
<strong>Analysis</strong> <strong>of</strong> Variance<br />
Sum <strong>of</strong> Mean<br />
Source DF Squares Square F Value Pr > F<br />
Model 2 257.85057 128.92528 10.75 |t|<br />
Intercept 1 6.14089 1.35288 4.54
CHAPTER 1 Epid <strong>766</strong>, D. Zhang<br />
• Summary <strong>from</strong> Stage II:<br />
1. Comparison <strong>of</strong> E(b0) and E(b1) between males and females:<br />
�E( � b0) : 223.97(female), 217.6(male), p-value = 0.28<br />
�E( � b1) : 1.75(female), 3.31(male), p-value = 0.002.<br />
2. Comparison <strong>of</strong> var(b0) and var(b1) between males and females:<br />
S 2b0<br />
S 2b1<br />
: 1621(female), 1848(male), p-value = 0.5<br />
: 11.3(female), 13.9(male), p-value = 0.3.<br />
However, the above tests do NOT compare var(b0) and var(b1)<br />
between males and females. We will use mixed model approach<br />
to address this problem.<br />
3. Model for true baseline response b0:<br />
� b0 = α0 + α1sex + α2age + e0,<br />
�α0 = 138.2(15.0), �α1 = −9.75(5.5), �α2 = 2.06(0.35).<br />
Graduate Summer Session in Epidemiology Slide 44
CHAPTER 1 Epid <strong>766</strong>, D. Zhang<br />
After adjusting for sex, one year increase in age corresponds to 2<br />
unit increase in baseline cholesterol level. After adjusting for<br />
baseline age, on average males’ baseline cholesterol level is about<br />
10 units less than females’.<br />
4. Model for change rate <strong>of</strong> the true response b1:<br />
� b1 = β0 + β1sex + β2age + e1,<br />
�β0 = 6.14(1.35), � β1 = 1.74(0.5), � β2 = −0.11(0.03).<br />
After adjusting for sex, one year increase in age corresponds to<br />
0.11 less in cholesterol level change rate. After adjusting for<br />
baseline age, males’ cholesterol level change rate is 1.74 greater<br />
than females’.<br />
Graduate Summer Session in Epidemiology Slide 45
CHAPTER 1 Epid <strong>766</strong>, D. Zhang<br />
Some remarks on two-stage analysis:<br />
1. The first stage model should be reasonably good for the second<br />
stage analysis to be valid and make sense.<br />
2. Two-stage analysis can only be used when the covariates considered<br />
are one-time covariates (fixed over time).<br />
3. Summary statistics <strong>of</strong> a time-varying covariates cannot be used in<br />
the second stage analysis because <strong>of</strong> error in variable issue.<br />
4. When the covariates considered are time-varying covariates,<br />
two-stage analysis is not appropriate. Mixed model or GEE approach<br />
can be used.<br />
5. Two-stage analysis for discrete data (binary or count data) may<br />
break down. Mixed model or GEE approach is much more<br />
appropriate.<br />
6. Although two-stage approach can be used to make inference on the<br />
quantities <strong>of</strong> interest, it is less efficient compared to the mixed<br />
Graduate Summer Session in Epidemiology Slide 46
CHAPTER 1 Epid <strong>766</strong>, D. Zhang<br />
model approach. Therefore, mixed model approach should be used<br />
whenever possible.<br />
Graduate Summer Session in Epidemiology Slide 47
CHAPTER 2 Epid <strong>766</strong>, D. Zhang<br />
2 Linear mixed models for normal<br />
longitudinal data<br />
• What is a linear mixed model?<br />
1. Random intercept model<br />
2. Random intercept and slope model<br />
3. Other error structures<br />
4. General mixed models<br />
• Estimation and inference<br />
• Choose a variance matrix <strong>of</strong> the data<br />
• Analyze Framingham data using linear mixed models<br />
• GEE for mixed models, missing data issue<br />
Graduate Summer Session in Epidemiology Slide 48
CHAPTER 2 Epid <strong>766</strong>, D. Zhang<br />
2.1 What is a linear mixed (effects) model?<br />
A linear mixed model is an extension <strong>of</strong> a linear regression model to<br />
model longitudinal (correlated) data. It contains fixed effects and<br />
random effects where random effects are subject-specific and used to<br />
model between-subject variation and the correlation induced by this<br />
variation.<br />
What are fixed effects? Fixed effects are the covariate effects that<br />
are fixed across subjects in the study sample. These effects are the ones<br />
<strong>of</strong> our particular interest. E.g., the regression coefficients in usual<br />
regression models are fixed effects:<br />
y = α + xβ + ǫ.<br />
What are random effects? Random effects are the covariate effects<br />
that vary among subjects. So these effects are subject-specific and hence<br />
are random (unobservable) since each subject is a random subject drawn<br />
<strong>from</strong> a population.<br />
Graduate Summer Session in Epidemiology Slide 49
CHAPTER 2 Epid <strong>766</strong>, D. Zhang<br />
I. Random intercept model:<br />
<strong>Data</strong> <strong>from</strong> m subjects:<br />
Subject Outcome Time Random<br />
1 y11, y12, ..., y1n1 t11, t12, ..., t1n1 b1<br />
2 y21, y22, ..., y2n2 t21, t22, ..., t2n2 b2<br />
· · ·<br />
i yi1, yi2, ..., yini ti1, ti2, ..., tini bi<br />
· · ·<br />
m ym1, ym2, ..., ymnm tm1, tm2, ..., tmnm bm<br />
Other covariates: xij2, ..., xijp, i = 1, ..., m, j = 1, ..., ni.<br />
A random intercept model assumes:<br />
intercept<br />
yij = β0 + β1tij + β2xij2 + · · · + βpxijp + bi + ǫij.<br />
Graduate Summer Session in Epidemiology Slide 50
CHAPTER 2 Epid <strong>766</strong>, D. Zhang<br />
Random intercept model:<br />
yij = β0 + β1tij + β2xij2 + · · · + βpxijp + bi + ǫij<br />
where β’s are fixed effects <strong>of</strong> interest, bi ∼ N(0, σ2 b ) are random effects,<br />
ǫij ∼ N(0, σ2 ǫ) are independent errors.<br />
Interpretation <strong>of</strong> the model components:<br />
1. From model,<br />
E[yij] = β0 + β1tij + β2xij2 + · · · + βpxijp.<br />
2. βk: Average increase in y associated with one unit increase in xk,<br />
the kth covariate.<br />
3. β0 + β1tij + β2xij2 + · · · + βpxijp + bi = true response for subject i<br />
at tij.<br />
4. β0 + bi is the intercept for subject i =⇒ bi = deviation <strong>of</strong> intercept<br />
<strong>of</strong> subject i <strong>from</strong> population intercept β0.<br />
Graduate Summer Session in Epidemiology Slide 51
CHAPTER 2 Epid <strong>766</strong>, D. Zhang<br />
5. σ 2 b = between-subject variance, σ2 ǫ = within-subject variance.<br />
6. Total variance <strong>of</strong> y: Var(yij) = σ 2 b + σ2 ǫ, constant over time.<br />
7. Correlation between yij and yij ′:<br />
corr(yij, yij ′) = σ2 b<br />
σ 2 b + σ2 ǫ<br />
8. Correlation is constant and positive.<br />
Graduate Summer Session in Epidemiology Slide 52<br />
= ρ
CHAPTER 2 Epid <strong>766</strong>, D. Zhang<br />
Why treat bi as random<br />
1. Treating bi as random enables us to make inference for the whole<br />
population <strong>from</strong> which the sample was drawn. Treating bi as fixed<br />
would only allow us to make inference for the study sample.<br />
2. Usually ni is small for longitudinal studies. Therefore, as the<br />
number <strong>of</strong> total data points gets larger, the number <strong>of</strong> bi (which is<br />
m, the number <strong>of</strong> subjects) gets large proportionally. In this case,<br />
the standard properties (such as consistency) for the parameter<br />
estimates may not still hold if bi is treated as fixed.<br />
Graduate Summer Session in Epidemiology Slide 53
CHAPTER 2 Epid <strong>766</strong>, D. Zhang<br />
When no x, model reduces to<br />
Response<br />
2 4 6 8<br />
•<br />
•<br />
•<br />
•<br />
•<br />
•<br />
yij = β0 + β1tij + bi + ǫij.<br />
Graphical representation <strong>of</strong> data <strong>from</strong> random intercept model<br />
•<br />
•<br />
•<br />
•<br />
•<br />
•<br />
•<br />
•<br />
•<br />
•<br />
•<br />
•<br />
•<br />
•<br />
•<br />
•<br />
•<br />
•<br />
1 2 3 4 5<br />
Time since study<br />
Graduate Summer Session in Epidemiology Slide 54<br />
•<br />
•<br />
•<br />
•<br />
•<br />
•<br />
•<br />
•<br />
•<br />
•<br />
•<br />
•<br />
•<br />
•<br />
•
CHAPTER 2 Epid <strong>766</strong>, D. Zhang<br />
II. Random intercept and slope model:<br />
<strong>Data</strong> <strong>from</strong> m subjects:<br />
Subject Outcome Time Random Random<br />
intercept slope<br />
1 y11, ..., y1n1 t11, ..., t1n1 b10 b11<br />
2 y21, ..., y2n2 t21, ..., t2n2 b20 b21<br />
· · ·<br />
i yi1, ..., yini ti1, ..., tini bi0 bi1<br />
· · ·<br />
m ym1, ..., ymnm tm1, ..., tmnm bm0 bm1<br />
Other covariates: xij2, ..., xijp, i = 1, ..., m, j = 1, ..., ni.<br />
A random intercept and slope model assumes:<br />
yij = β0 + β1tij + β2xij2 + · · · + βpxijp + bi0 + bi1tij + ǫij.<br />
Graduate Summer Session in Epidemiology Slide 55
CHAPTER 2 Epid <strong>766</strong>, D. Zhang<br />
Random intercept and slope model:<br />
yij = β0 + β1tij + β2xij2 + · · · + βpxijp + bi0 + bi1tij + ǫij,<br />
βk the same as before, random effects bi0, bi1 are assumed to have a<br />
bivariate normal distribution<br />
⎛ ⎞ ⎛⎡<br />
⎝ bi0<br />
bi1<br />
⎠ ∼ N<br />
⎝⎣<br />
0<br />
0<br />
⎤<br />
⎦,<br />
Usually, no constraint is imposed on σij.<br />
Interpretation <strong>of</strong> the model components:<br />
1. Mean structure is the same as before:<br />
⎡<br />
⎣ σ00 σ01<br />
σ01 σ11<br />
⎤⎞<br />
⎦⎠.<br />
E[yij] = β0 + β1tij + β2xij2 + · · · + βpxijp.<br />
2. βk: Average increase in y associated with one unit increase in xk,<br />
the kth covariate.<br />
3. β0 + β1tij + β2xij2 + · · · + βpxijp + bi0 + bi1tij = true response for<br />
Graduate Summer Session in Epidemiology Slide 56
CHAPTER 2 Epid <strong>766</strong>, D. Zhang<br />
subject i at tij.<br />
4. β0 + bi = the intercept for subject i =⇒ bi0 = deviation <strong>of</strong> intercept<br />
<strong>of</strong> subject i <strong>from</strong> population intercept β0<br />
5. β1 + bi1 = the slope for subject i =⇒ bi1 = deviation <strong>of</strong> slope <strong>of</strong><br />
subject i <strong>from</strong> population slope β1<br />
6. V ar(bi0 + bi1tij) = σ00 + 2tijσ01 + t 2 ij σ11 = between-subject<br />
variance (varying over time).<br />
7. σ 2 ǫ = within-subject variance.<br />
8. Total variance <strong>of</strong> y: Var(yij) = σ00 + 2tijσ01 + t 2 ij σ11 + σ 2 ǫ, not a<br />
constant over time.<br />
9. Correlation between yij and yij ′: not a constant over time.<br />
Graduate Summer Session in Epidemiology Slide 57
CHAPTER 2 Epid <strong>766</strong>, D. Zhang<br />
When no x, model reduces to<br />
Response<br />
yij = β0 + β1tij + bi0 + bi1tij + ǫij.<br />
Graphical representation <strong>of</strong> data <strong>from</strong> random intercept and slope model<br />
2 4 6 8 10 12 14<br />
•<br />
•<br />
•<br />
•<br />
•<br />
•<br />
•<br />
•<br />
•<br />
•<br />
•<br />
•<br />
•<br />
•<br />
•<br />
• •<br />
•<br />
•<br />
•<br />
1 2 3 4 5<br />
Time since study<br />
Graduate Summer Session in Epidemiology Slide 58<br />
•<br />
•<br />
•<br />
•<br />
•<br />
•<br />
•<br />
•<br />
•<br />
•<br />
•<br />
•<br />
•<br />
•<br />
•<br />
•
CHAPTER 2 Epid <strong>766</strong>, D. Zhang<br />
III. Other mixed models:<br />
• A correlated error model<br />
yij = β0 + β1tij + β2xij2 + · · · + βpxijp + ǫij,<br />
where ǫij are correlated normal errors. For example,<br />
1. Compound symmetric (exchangeable) variance matrix<br />
⎛ ⎞ ⎛⎡<br />
⎤ ⎡<br />
ǫi1 0 1<br />
⎜ ⎟ ⎜⎢<br />
⎥ ⎢<br />
⎜<br />
⎝ ǫi2<br />
⎟<br />
⎠ ∼ N ⎜⎢<br />
⎝⎣<br />
0 ⎥<br />
⎦ , σ2 ⎢<br />
⎣ ρ<br />
⎤⎞<br />
ρ ρ<br />
⎥⎟<br />
1 ρ ⎥⎟<br />
⎦⎠<br />
0 ρ ρ 1<br />
.<br />
ǫi3<br />
Here, −1 < ρ < 1. A random intercept model is almost<br />
equivalent to this model.<br />
Graduate Summer Session in Epidemiology Slide 59
CHAPTER 2 Epid <strong>766</strong>, D. Zhang<br />
2. AR(1) variance matrix<br />
⎛ ⎞ ⎛⎡<br />
⎜<br />
⎝<br />
ǫi1<br />
ǫi2<br />
ǫi3<br />
⎟<br />
⎠<br />
∼ N<br />
⎜⎢<br />
⎜⎢<br />
⎝⎣<br />
0<br />
0<br />
0<br />
⎤<br />
⎥<br />
⎦ , σ2<br />
⎡<br />
⎢<br />
⎣<br />
1 ρ ρ 2<br />
ρ 1 ρ<br />
ρ 2 ρ 1<br />
⎤⎞<br />
⎥⎟<br />
⎥⎟<br />
⎦⎠<br />
.<br />
Here, −1 < ρ < 1. It assumes that the error (ǫi1, ǫi2, ǫi3) is an<br />
autoregressive process with order 1. This structure is more<br />
appropriate if y is measured at equally spaced time points.<br />
3. Spatial power variance matrix<br />
⎛ ⎞ ⎛⎡<br />
⎤ ⎡<br />
ǫi1 0<br />
⎜ ⎟ ⎜⎢<br />
⎥ ⎢<br />
⎜<br />
⎝ ǫi2<br />
⎟<br />
⎠ ∼ N ⎜⎢<br />
⎝⎣<br />
0 ⎥<br />
⎦ , σ2 ⎢<br />
⎣<br />
0<br />
ǫi3<br />
1 ρ |t2−t1| ρ |t3−t1|<br />
ρ |t2−t1| 1 ρ |t3−t2|<br />
ρ |t3−t1| ρ |t3−t2| 1<br />
⎤⎞<br />
⎥⎟<br />
⎥⎟<br />
⎦⎠<br />
.<br />
Here, 0 < ρ < 1. This error structure reduces to AR(1) when y<br />
is measured at equally spaced time points. This structure is<br />
appropriate if y is measured at unequally spaced time points.<br />
Graduate Summer Session in Epidemiology Slide 60
CHAPTER 2 Epid <strong>766</strong>, D. Zhang<br />
4. Unstructured variance matrix<br />
⎛ ⎞ ⎛⎡<br />
⎤<br />
ǫi1 0<br />
⎜ ⎟ ⎜⎢<br />
⎥<br />
⎜<br />
⎝ ǫi2<br />
⎟<br />
⎠ ∼ N ⎜⎢<br />
⎝⎣<br />
0 ⎥<br />
⎦<br />
0<br />
,<br />
⎡<br />
⎢<br />
⎣<br />
ǫi3<br />
Here no restriction is imposed on σij.<br />
σ11 σ12 σ13<br />
σ12 σ22 σ23<br />
σ13 σ23 σ33<br />
⎤⎞<br />
⎥⎟<br />
⎥⎟<br />
⎦⎠<br />
.<br />
Graduate Summer Session in Epidemiology Slide 61
CHAPTER 2 Epid <strong>766</strong>, D. Zhang<br />
IV. General linear mixed models<br />
General model 1: fixed effects + random effects + pure<br />
measurement error:<br />
For example,<br />
yij = β0 + β1tij + β2x + bi0 + bi1tij + ǫij,<br />
where ǫij is the pure measurement error (has an independent variance<br />
structure).<br />
S<strong>of</strong>tware to implement the above model: Proc Mixed in SAS:<br />
Proc Mixed data= method=;<br />
class id;<br />
model y = t x / s; /* specify t x for fixed effects */<br />
random intercept t / subject=id type=un; /* specify the covariance */<br />
/* for random effects */<br />
repeated / subject=id type=vc; /* specify the variance structure for error */<br />
run;<br />
Graduate Summer Session in Epidemiology Slide 62
CHAPTER 2 Epid <strong>766</strong>, D. Zhang<br />
General model 2: fixed effects + random effects + stochastic process<br />
For example,<br />
yij = β0 + β1tij + β2xij2 + bi0 + bi1tij + Ui(tij),<br />
where Ui(t) is a stochastic process with AR(1), a spatial power variance<br />
structure or other variance structure.<br />
S<strong>of</strong>tware to implement the above model: Proc Mixed in SAS:<br />
Proc Mixed data= method=;<br />
class id;<br />
model y = t x / s; /* specify t x for fixed effects */<br />
random intercept t / subject=id type=un; /* specify the covariance */<br />
/* for random effects */<br />
repeated / subject=id type=sp(pow)(t); /* specify the variance structure for error */<br />
run;<br />
If the time points are equally spaced, we can use type=ar(1) in the<br />
repeated statement for AR(1) variance structure for Ui(t).<br />
Graduate Summer Session in Epidemiology Slide 63
CHAPTER 2 Epid <strong>766</strong>, D. Zhang<br />
General model 3: fixed effects + random effects + stochastic process<br />
+ pure measurement error<br />
For example,<br />
yij = β0 + β1tij + β2xij2 + bi0 + bi1tij + Ui(tij) + ǫij,<br />
where Ui(t) is a stochastic process with some variance structure (e.g.,a<br />
spatial power variance structure), ǫij is the pure measurement error.<br />
S<strong>of</strong>tware to implement the above model: Proc Mixed in SAS:<br />
Proc Mixed data= method=;<br />
class id;<br />
model y = t x / s; /* specify t x for fixed effects */<br />
random intercept t / subject=id type=un; /* specify the covariance */<br />
/* for random effects */<br />
repeated / subject=id type=sp(pow)(t) local; /* specify error variance structure */<br />
run;<br />
If the time points are equally spaced, we can use type=ar(1) in the<br />
repeated statement if assuming AR(1) for Ui(t).<br />
Graduate Summer Session in Epidemiology Slide 64
CHAPTER 2 Epid <strong>766</strong>, D. Zhang<br />
2.2 Estimation and inference for linear mixed<br />
models<br />
Let θ consist <strong>of</strong> all parameters in random effects and errors (ǫij). We<br />
want to make inference on β and θ. There are two approaches:<br />
1. Maximum likelihood:<br />
ℓ(β, θ; y) = logL(β, θ; y).<br />
Maximize ℓ(β, θ; y) jointly w.r.t. β and θ to get their MLEs.<br />
2. Restricted maximum likelihood (REML):<br />
(a) Get REML <strong>of</strong> θ <strong>from</strong> a REML likelihood ℓREML(θ; y) (take into<br />
account estimation <strong>of</strong> β). Leads to less biased � θ. For example, in<br />
a linear regression model<br />
�σ 2 REML =<br />
Residual Sum <strong>of</strong> Squares<br />
.<br />
n − p − 1<br />
(b) Estimate β by maximizing ℓ(β, � θREML; y).<br />
Graduate Summer Session in Epidemiology Slide 65
CHAPTER 2 Epid <strong>766</strong>, D. Zhang<br />
Hypothesis Testing<br />
• After we fit a linear mixed model such as<br />
yij = β0 + β1tij + β2xij2 + · · · + βpxijp + bi0 + bi1tij + ǫij,<br />
SAS will output a test for each βk, including the estimate, SE,<br />
p-value (for testing H0 : βk = 0), etc.<br />
• If we want to test a contrast between βk, we can use estimate<br />
statement in Proc Mixed. Then SAS will output the estimate, SE<br />
for the contrast and the p-value for testing the contrast is zero. See<br />
Programs 2 and 3 for Framingham data.<br />
Graduate Summer Session in Epidemiology Slide 66
CHAPTER 2 Epid <strong>766</strong>, D. Zhang<br />
2.3 How to choose random effects and the error<br />
structure?<br />
1. Use graphical representation to identify possible random effects.<br />
2. Use biological knowledge to identify possible error structure.<br />
3. Use information criteria to choose a final model:<br />
(a) Akaike’s Information Criterion (AIC):<br />
AIC = −2{ℓ( � β, � θ; y) − q}<br />
where q = # <strong>of</strong> elements in θ. Smaller AIC is preferred.<br />
(b) Bayesian Information Criterion (BIC):<br />
BIC = −2{ℓ( � β, � θ; y) − 0.5 × q × log(m)}, m = # <strong>of</strong> subjects<br />
Again, smaller BIC is preferred.<br />
Graduate Summer Session in Epidemiology Slide 67
CHAPTER 2 Epid <strong>766</strong>, D. Zhang<br />
2.4 Analyze Framingham data using linear mixed<br />
models<br />
• Model to address objective 1: How does cholesterol level change<br />
over time on average as people get older?<br />
⋆ Consider the following basic model suggested by the data:<br />
yij = bi0 + bi1tij + ǫij<br />
(2.1)<br />
where yij is the jth cholesterol level measurement <strong>from</strong> subject<br />
i, tij is year <strong>from</strong> the beginning <strong>of</strong> the study (or baseline) and<br />
bi0, bi1 are random variables distributed as<br />
⎛<br />
⎝ bi0<br />
bi1<br />
⎞<br />
⎠ ∼ N<br />
⎛⎡<br />
⎝<br />
⎣ β0<br />
β1<br />
⎤<br />
⎦,<br />
⎡<br />
⎣ σ00 σ01<br />
σ01 σ11<br />
⎤⎞<br />
⎦⎠<br />
,<br />
and ǫij are independent errors distributed as N(0, σ 2 ǫ).<br />
Graduate Summer Session in Epidemiology Slide 68
CHAPTER 2 Epid <strong>766</strong>, D. Zhang<br />
⋆ Model (2.1) assumes that<br />
1. The true cholesterol level for each individual changes linearly<br />
over time with different intercept and slope, which are both<br />
random (since the individual is a random subject drawn <strong>from</strong><br />
the population).<br />
2. Since t = 0 is the baseline, so bi0 can be viewed as the true<br />
but unobserved cholesterol level for subject i at the baseline,<br />
and bi1 can be viewed as the change rate <strong>of</strong> the true<br />
cholesterol level for subject i.<br />
3. β0 is the population average <strong>of</strong> the true baseline cholesterol<br />
level <strong>of</strong> all individuals in the population, β1 is the population<br />
average change rate <strong>of</strong> true cholesterol level and it tells us<br />
how cholesterol level changes on average as people get older.<br />
So β1 is the longitudinal effect or aging effect on<br />
cholesterol level.<br />
4. σ00 is the variance <strong>of</strong> the true baseline cholesterol level bi0;<br />
σ11 is the variance <strong>of</strong> the change rate bi1 <strong>of</strong> the true<br />
Graduate Summer Session in Epidemiology Slide 69
CHAPTER 2 Epid <strong>766</strong>, D. Zhang<br />
cholesterol level; and σ01 is the covariance between true<br />
baseline cholesterol level bi0 and the change rate bi1 <strong>of</strong> true<br />
cholesterol level.<br />
⋆ The random variables bi0 and bi1 can be re-written as<br />
bi0 = β0 + ai0, bi1 = β1 + ai1,<br />
where ai0, ai1 have the following distribution:<br />
⎛<br />
⎝ ai0<br />
ai1<br />
⎞<br />
⎠ ∼ N<br />
⎛⎡<br />
⎝⎣<br />
0<br />
0<br />
⎤<br />
⎦ ,<br />
⎡<br />
⎣ σ00 σ01<br />
⋆ Model (2.1) then can be re-expressed as<br />
σ01 σ11<br />
⎤⎞<br />
⎦⎠.<br />
yij = β0 + β1tij + ai0 + ai1tij + ǫij. (2.2)<br />
Therefore, β0, β1 are fixed effects and ai0, ai1 are random effects.<br />
Graduate Summer Session in Epidemiology Slide 70
CHAPTER 2 Epid <strong>766</strong>, D. Zhang<br />
⋆ The following is the SAS program for fitting model (2.1):<br />
title "Framingham data: mixed model without covariates";<br />
proc mixed data=cholst;<br />
class newid;<br />
model cholst = year / s;<br />
random intercept year / type=un subject=newid g;<br />
repeated / type=vc subject=newid;<br />
run;<br />
The following is the output <strong>from</strong> the above program:<br />
Framingham data: mixed model without covariates 1<br />
The Mixed Procedure<br />
Model Information<br />
<strong>Data</strong> Set WORK.CHOLST<br />
Dependent Variable cholst<br />
Covariance Structures Unstructured, Variance<br />
Components<br />
Subject Effects newid, newid<br />
Estimation Method REML<br />
Residual Variance Method Parameter<br />
Fixed Effects SE Method Model-Based<br />
Degrees <strong>of</strong> Freedom Method Containment<br />
Graduate Summer Session in Epidemiology Slide 71
CHAPTER 2 Epid <strong>766</strong>, D. Zhang<br />
Class Level Information<br />
Class Levels Values<br />
newid 200 1 2 3 4 5 6 7 8 9 10 11 12 13<br />
14 ...<br />
Dimensions<br />
Covariance Parameters 4<br />
Columns in X 2<br />
Columns in Z Per Subject 2<br />
Subjects 200<br />
Max Obs Per Subject 6<br />
Observations Used 1044<br />
Observations Not Used 0<br />
Total Observations 1044<br />
Iteration History<br />
Iteration Evaluations -2 Res Log Like Criterion<br />
0 1 10899.75433605<br />
1 2 9960.12567386 0.00000120<br />
2 1 9960.12082968 0.00000000<br />
Convergence criteria met.<br />
Graduate Summer Session in Epidemiology Slide 72
CHAPTER 2 Epid <strong>766</strong>, D. Zhang<br />
The Mixed Procedure<br />
Estimated G Matrix<br />
Row Effect newid Col1 Col2<br />
1 Intercept 1 1467.30 -2.2259<br />
2 year 1 -2.2259 3.8409<br />
Covariance Parameter Estimates<br />
Cov Parm Subject Estimate<br />
UN(1,1) newid 1467.30<br />
UN(2,1) newid -2.2259<br />
UN(2,2) newid 3.8409<br />
Residual newid 434.11<br />
Fit <strong>Statistics</strong><br />
-2 Res Log Likelihood 9960.1<br />
AIC (smaller is better) 9968.1<br />
AICC (smaller is better) 9968.2<br />
BIC (smaller is better) 9981.3<br />
Null Model Likelihood Ratio Test<br />
DF Chi-Square Pr > ChiSq<br />
3 939.63
CHAPTER 2 Epid <strong>766</strong>, D. Zhang<br />
Solution for Fixed Effects<br />
Standard<br />
Effect Estimate Error DF t Value Pr > |t|<br />
Intercept 220.57 2.9305 199 75.26
CHAPTER 2 Epid <strong>766</strong>, D. Zhang<br />
220.69 <strong>of</strong> � b0 with SE = 2.94 <strong>from</strong> the two-stage approach.<br />
5. The estimated change rate (longitudinal effect) � β1 = 2.82 with<br />
SE=0.24, as compared to the sample mean 2.55 <strong>of</strong> � b1 with SE =<br />
0.26 <strong>from</strong> the two-stage approach.<br />
6. �σ 2 ǫ = 434.11.<br />
⋆ Q: Is it reasonable to assume ǫij in model (2.1) to be pure<br />
measurement error?<br />
⋆ We can consider a more general model such as AR(1) for ǫij and<br />
test this assumption.<br />
title "Framingham data: mixed model without covariates + AR(1) error";<br />
proc mixed data=cholst covtest;<br />
class newid;<br />
model cholst = year / s;<br />
random intercept year / type=un subject=newid g;<br />
repeated / type=ar(1) subject=newid;<br />
run;<br />
Graduate Summer Session in Epidemiology Slide 75
CHAPTER 2 Epid <strong>766</strong>, D. Zhang<br />
and the relevant output:<br />
Covariance Parameter Estimates<br />
⋆ Note:<br />
Standard Z<br />
Cov Parm Subject Estimate Error Value Pr Z<br />
UN(1,1) newid 1490.82 173.93 8.57
CHAPTER 2 Epid <strong>766</strong>, D. Zhang<br />
• Model to investigate the cross sectional age effect and longitudinal<br />
age effect on cholesterol level:<br />
⋆ Re-write the true baseline cholesterol level bi0 and the change<br />
rate bi1 in model (2.1) in terms <strong>of</strong> conditional distributions given<br />
age:<br />
bi0 = β0 + βCagei + ai0<br />
(2.3)<br />
bi1 = β1 + βAagei + ai1, (2.4)<br />
Where agei is individual i’s baseline age. Then βC is the cross<br />
sectional age effect and β1 + βAagei is the longitudinal effect for<br />
the population with baseline age eqaul to agei.<br />
⋆ The average longitudinal effect is<br />
which can be estimated by<br />
β1 + βAE(age),<br />
�β1 + � βAage,<br />
Graduate Summer Session in Epidemiology Slide 77
CHAPTER 2 Epid <strong>766</strong>, D. Zhang<br />
where age is the sample average age.<br />
⋆ Suggest that we can center age and use the centered age<br />
(denoted by cagei = agei − age) in (2.3). Then β1 is the<br />
average longitudinal effect<br />
⋆ We are interested in testing H0 : βC = β1.<br />
⋆ Assume the usual distribution for (ai0, ai1):<br />
⎛<br />
⎝ ai0<br />
⎞ ⎛⎡<br />
⎠ ∼ N ⎝⎣<br />
0<br />
⎤ ⎡<br />
⎦ ,<br />
0<br />
ai1<br />
⎣ σ00 σ01<br />
σ01 σ11<br />
⎤⎞<br />
⎦⎠.<br />
Here both σ00 and σ11 are the remaining variances in bi0 and bi1<br />
after baseline age effect has been taken into account. So they<br />
should be smaller than those corresponding values in model (2.1).<br />
⋆ Basic model (2.1) becomes<br />
yij = β0 + βCcagei + β1tij + βAcagei ∗ tij + ai0 + ai1tij + ǫij,(2.5)<br />
Graduate Summer Session in Epidemiology Slide 78
CHAPTER 2 Epid <strong>766</strong>, D. Zhang<br />
where ǫij ∼ N(0, σ 2 ) are independent errors.<br />
⋆ The following is the SAS program for fitting model (2.5):<br />
title "Framingham data: longitudinal effect vs. cohort effect";<br />
proc mixed data=cholst;<br />
class newid;<br />
model cholst = year cage cage*year / s;<br />
random intercept year / type=un subject=newid g;<br />
repeated / type=vc subject=newid;<br />
estimate "long-cross" year 1 cage -1;<br />
run;<br />
Graduate Summer Session in Epidemiology Slide 79
CHAPTER 2 Epid <strong>766</strong>, D. Zhang<br />
⋆ The relevant output <strong>of</strong> the above SAS program is<br />
Iteration History<br />
Iteration Evaluations -2 Res Log Like Criterion<br />
0 1 10826.01576300<br />
1 2 9929.74817925 0.00000516<br />
2 1 9929.72729664 0.00000000<br />
Convergence criteria met.<br />
Estimated G Matrix<br />
Row Effect newid Col1 Col2<br />
1 Intercept 1 1226.69 9.7829<br />
2 year 1 9.7829 3.2598<br />
Covariance Parameter Estimates<br />
Cov Parm Subject Estimate<br />
UN(1,1) newid 1226.69<br />
UN(2,1) newid 9.7829<br />
UN(2,2) newid 3.2598<br />
Residual newid 434.15<br />
Fit <strong>Statistics</strong><br />
-2 Res Log Likelihood 9929.7<br />
AIC (smaller is better) 9937.7<br />
Graduate Summer Session in Epidemiology Slide 80
CHAPTER 2 Epid <strong>766</strong>, D. Zhang<br />
AICC (smaller is better) 9937.8<br />
BIC (smaller is better) 9950.9<br />
Null Model Likelihood Ratio Test<br />
DF Chi-Square Pr > ChiSq<br />
3 896.29 |t|<br />
Intercept 220.57 2.7172 198 81.18
CHAPTER 2 Epid <strong>766</strong>, D. Zhang<br />
⋆ What we learn <strong>from</strong> this output:<br />
1. �σ00 = 1226.7, much smaller than the corresponding estimate<br />
1467 <strong>from</strong> model (2.1) when baseline age was not used to<br />
explain the variability in the true baseline cholesterol level.<br />
2. �σ11 = 3.26, much smaller than the corresponding estimate<br />
3.84 <strong>from</strong> model (2.1) when baseline age was not used to<br />
explain the variability in the true baseline cholesterol change<br />
rate.<br />
3. � β0 = 220.57 is the estimate <strong>of</strong> mean true baseline cholesterol<br />
level for the individuals whose baseline age = 42.56 (the<br />
average age), which is the same as the one <strong>from</strong> model (2.1)<br />
but with a smaller SE (2.71 vs. 2.93).<br />
4. The estimate <strong>of</strong> the longitudinal age effect is � β1 = 2.8157 with<br />
SE = 0.2343, which is basically the same as � β1 = 2.8170 with<br />
SE = 0.24 <strong>from</strong> model (2.1).<br />
5. The estimate <strong>of</strong> the cross sectional age effect is � βC = 1.99<br />
with SE = 0.3455, which is very different <strong>from</strong> the estimate <strong>of</strong><br />
Graduate Summer Session in Epidemiology Slide 82
CHAPTER 2 Epid <strong>766</strong>, D. Zhang<br />
the longitudinal age effect � β1.<br />
6. The P-value for testing H0 : βL = βC is 0.0473, significant at<br />
level 0.05!<br />
7. �σ 2 ǫ = 434.15 is basically the same as the corresponding<br />
estimate <strong>from</strong> model (2.1), which is 434.11.<br />
8. Similarly, we can test iid ǫij by considering correlated errors<br />
such as AR(1).<br />
Graduate Summer Session in Epidemiology Slide 83
CHAPTER 2 Epid <strong>766</strong>, D. Zhang<br />
• Model to address objective 2: How is the change <strong>of</strong> cholesterol<br />
level associated with sex and baseline age?<br />
⋆ Re-write the true baseline cholesterol level bi0 and the change<br />
rate bi1 in model (2.1) in terms <strong>of</strong> conditional distribution given<br />
gender and baseline age:<br />
bi0 = β0 + sexiβ0,sex + ageiβ0,age + ai0<br />
(2.6)<br />
bi1 = β1 + sexiβ1,sex + ageiβ1,age + ai1, (2.7)<br />
where we assume that ai0, ai1 have the following<br />
⎛<br />
⎝ ai0<br />
ai1<br />
⎞<br />
⎠ ∼ N<br />
⎛⎡<br />
⎝⎣<br />
0<br />
0<br />
⎤<br />
⎦ ,<br />
⎡<br />
⎣ σ00 σ01<br />
σ01 σ11<br />
⎤⎞<br />
⎦⎠.<br />
⋆ Then β0,sex, β0,age are the sex effect and baseline age effect on<br />
the baseline cholesterol level. Of course, β0 does NOT have a<br />
proper interpretation.<br />
Graduate Summer Session in Epidemiology Slide 84
CHAPTER 2 Epid <strong>766</strong>, D. Zhang<br />
⋆ Similarly, β1,sex, β1,age are the sex effect and baseline age effect<br />
on the change rate <strong>of</strong> the true cholesterol level, and β1 does<br />
NOT have a proper interpretation.<br />
⋆ Substituting the above expressions into model (2.1), we got<br />
yij = β0 + sexiβ0,sex + ageiβ0,age + β1tij<br />
+sexitijβ1,sex + ageitijβ1,age + ai0 + ai1tij + ǫij.(2.8)<br />
⋆ Suppose we also want to test whether or not the change rates<br />
between 30 years old males and 40 years old females are the<br />
same using above model.<br />
⋆ From model (2.7), the (average) change rate <strong>of</strong> 30 years old<br />
males is<br />
β1 + 1 × β1,sex + 30 × β1,age = β1 + β1,sex + 30β1,age.<br />
Graduate Summer Session in Epidemiology Slide 85
CHAPTER 2 Epid <strong>766</strong>, D. Zhang<br />
The (average) change rate <strong>of</strong> 40 years old females is<br />
β1 + 0 × β1,sex + 40 × β1,age = β1 + 40β1,age.<br />
The difference between these two rates is<br />
β1 + β1,sex + 30β1,age − (β1 + 40β1,age) = β1,sex − 10β1,age.<br />
Therefore, we need only to test H0 : β1,sex − 10β1,age = 0.<br />
⋆ We can use the following SAS program to answer our questions.<br />
title "Framingham data: how baseline cholesterol level and";<br />
title2" change rate depend on sex and baseline age";<br />
proc mixed data=cholst;<br />
class newid;<br />
model cholst = sex age year sex*year age*year / s;<br />
random intercept year / type=un subject=newid g s;<br />
repeated / type=vc subject=newid;<br />
estimate "rate-diff" sex*year 1 age*year -10;<br />
run;<br />
Graduate Summer Session in Epidemiology Slide 86
CHAPTER 2 Epid <strong>766</strong>, D. Zhang<br />
⋆ Part <strong>of</strong> the relevant output <strong>from</strong> above program is<br />
Framingham data: how baseline cholesterol level and 1<br />
change rate depend on sex and baseline age<br />
Iteration History<br />
Iteration Evaluations -2 Res Log Like Criterion<br />
0 1 10813.99587154<br />
1 2 9907.89014721 0.00000655<br />
2 1 9907.86364103 0.00000000<br />
Convergence criteria met.<br />
Estimated G Matrix<br />
Row Effect newid Col1 Col2<br />
1 Intercept 1 1209.89 13.5502<br />
2 year 1 13.5502 2.5211<br />
Covariance Parameter Estimates<br />
Cov Parm Subject Estimate<br />
UN(1,1) newid 1209.89<br />
UN(2,1) newid 13.5502<br />
UN(2,2) newid 2.5211<br />
Residual newid 434.15<br />
Graduate Summer Session in Epidemiology Slide 87
CHAPTER 2 Epid <strong>766</strong>, D. Zhang<br />
Fit <strong>Statistics</strong><br />
-2 Res Log Likelihood 9907.9<br />
AIC (smaller is better) 9915.9<br />
AICC (smaller is better) 9915.9<br />
BIC (smaller is better) 9929.1<br />
Null Model Likelihood Ratio Test<br />
DF Chi-Square Pr > ChiSq<br />
3 906.13 |t|<br />
Intercept 138.18 14.9148 197 9.26
CHAPTER 2 Epid <strong>766</strong>, D. Zhang<br />
Solution for Random Effects<br />
Std Err<br />
Effect newid Estimate Pred DF t Value Pr > |t|<br />
Intercept 2 100.50 11.5761 651 8.68
CHAPTER 2 Epid <strong>766</strong>, D. Zhang<br />
⋆ What we learn <strong>from</strong> this output:<br />
1. � β0,sex = −9.64 (SE = 5.43), so after adjusting for baseline<br />
age, males’ baseline cholesterol level is about 10 units less<br />
than females’.<br />
2. � β0,age = 2.05 (SE = 0.35), so after adjusting for gender, one<br />
year older people’s baseline cholesterol level is about 2 units<br />
higher than that <strong>of</strong> one year younger people.<br />
3. � β1,sex = 1.80 (SE = 0.45), so after adjusting for baseline age,<br />
males’ change rate is 1.80 (cholesterol unit/year) greater that<br />
females’ change rate. Similar estimate <strong>from</strong> 2-stage analysis is<br />
1.74 (SE=0.49).<br />
4. � β1,age = −0.11 (SE = 0.028), so after adjusting for sex, one<br />
year older people’s change rate is 0.11 less than one year<br />
younger people’s change rate. Similar estimate <strong>from</strong> 2-stage<br />
analysis is -0.11 (SE=0.031).<br />
5. The change rate difference <strong>of</strong> interest is 2.94 (SE = 0.56).<br />
Significant!<br />
Graduate Summer Session in Epidemiology Slide 90
CHAPTER 2 Epid <strong>766</strong>, D. Zhang<br />
6. �σ00 = 1210, which is smaller than the corresponding estimate<br />
<strong>from</strong> model (2.5) since we use both age and gender to explain<br />
the variability in baseline true cholesterol level.<br />
7. �σ11 = 2.52, which is smaller than the corresponding estimate<br />
<strong>from</strong> model (2.5) since we use both age and gender to explain<br />
the variability in the cholesterol level change rate.<br />
8. �σ 2 ǫ = 434.15, basically the same as its estimates <strong>from</strong> models<br />
(2.1) and (2.5).<br />
9. Similarly, we can test iid ǫij by considering correlated errors<br />
such as AR(1).<br />
⋆ Note: The models (2.6) and (2.7) for bi0 and bi1 are basically<br />
the same as the second stage models in the two stage analysis<br />
for the Framingham data.<br />
⋆ Compare results <strong>from</strong> this model to the results <strong>from</strong> the<br />
two-stage analysis:<br />
Graduate Summer Session in Epidemiology Slide 91
CHAPTER 2 Epid <strong>766</strong>, D. Zhang<br />
(a) Effect on baseline cholesterol level:<br />
Model (2.8) :<br />
� β0 = 138.18(SE = 14.9),<br />
�β0,sex = −9.64(SE = 5.43), � β0,age = 2.05(SE = 0.35)<br />
Two-stage : �α0 = 138.2(SE = 15.0),<br />
�α1 = −9.75(SE = 5.48), �α2 = 2.06(SE = 0.35).<br />
(b) Effect on change rate <strong>of</strong> cholesterol level:<br />
Model (2.8) :<br />
Two-stage :<br />
� β1 = 6.80(SE = 1.22),<br />
�β1,sex = 1.80(SE = 0.45), � β1,age = −0.11(SE = 0.03).<br />
� β0 = 6.14(SE = 1.35),<br />
�β1 = 1.74(SE = 0.49), � β2 = −0.11(SE = 0.03).<br />
⋆ We can also estimate the individual random effects and estimate<br />
their trajectory lines.<br />
Graduate Summer Session in Epidemiology Slide 92
CHAPTER 2 Epid <strong>766</strong>, D. Zhang<br />
⋆ Estimated subject-specific lines <strong>from</strong> model (2.8):<br />
Cholesterol level<br />
150 200 250 300 350 400<br />
Cholesterol levels over time<br />
•<br />
•<br />
•<br />
•<br />
•<br />
•<br />
•<br />
•<br />
•<br />
•<br />
•<br />
•<br />
•<br />
•<br />
•<br />
•<br />
•<br />
•<br />
•<br />
•<br />
• •<br />
•<br />
•<br />
•<br />
•<br />
•<br />
•<br />
•<br />
•<br />
•<br />
•<br />
•<br />
•<br />
•<br />
•<br />
•<br />
•<br />
•<br />
•<br />
•<br />
•<br />
•<br />
•<br />
•<br />
•<br />
•<br />
•<br />
•<br />
•<br />
•<br />
•<br />
•<br />
•<br />
•<br />
•<br />
•<br />
•<br />
•<br />
•<br />
•<br />
•<br />
•<br />
•<br />
•<br />
•<br />
•<br />
•<br />
•<br />
•<br />
•<br />
•<br />
•<br />
•<br />
•<br />
•<br />
•<br />
•<br />
•<br />
•<br />
•<br />
•<br />
•<br />
• •<br />
•<br />
•<br />
•<br />
• •<br />
•<br />
•<br />
•<br />
•<br />
• •<br />
•<br />
•<br />
•<br />
•<br />
•<br />
•<br />
•<br />
•<br />
•<br />
•<br />
•<br />
•<br />
•<br />
•<br />
•<br />
•<br />
•<br />
•<br />
•<br />
•<br />
•<br />
•<br />
•<br />
•<br />
• •<br />
•<br />
•<br />
•<br />
•<br />
•<br />
•<br />
•<br />
•<br />
•<br />
•<br />
•<br />
•<br />
•<br />
•<br />
•<br />
•<br />
•<br />
•<br />
•<br />
•<br />
•<br />
•<br />
•<br />
•<br />
•<br />
•<br />
•<br />
•<br />
•<br />
•<br />
• •<br />
•<br />
• • •<br />
•<br />
•<br />
•<br />
•<br />
•<br />
•<br />
•<br />
•<br />
•<br />
•<br />
•<br />
•<br />
•<br />
•<br />
•<br />
•<br />
•<br />
•<br />
•<br />
•<br />
•<br />
•<br />
•<br />
•<br />
•<br />
•<br />
•<br />
•<br />
•<br />
•<br />
•<br />
•<br />
•<br />
•<br />
•<br />
•<br />
•<br />
• •<br />
•<br />
•<br />
•<br />
•<br />
•<br />
•<br />
•<br />
•<br />
•<br />
•<br />
•<br />
•<br />
•<br />
•<br />
•<br />
•<br />
•<br />
•<br />
•<br />
•<br />
•<br />
•<br />
•<br />
•<br />
•<br />
•<br />
•<br />
•<br />
•<br />
•<br />
•<br />
•<br />
•<br />
•<br />
•<br />
•<br />
•<br />
•<br />
•<br />
•<br />
• •<br />
•<br />
•<br />
•<br />
•<br />
• •<br />
•<br />
•<br />
•<br />
•<br />
•<br />
•<br />
•<br />
•<br />
• •<br />
•<br />
•<br />
•<br />
•<br />
•<br />
•<br />
•<br />
•<br />
•<br />
•<br />
•<br />
•<br />
•<br />
•<br />
•<br />
•<br />
•<br />
•<br />
•<br />
•<br />
•<br />
•<br />
•<br />
•<br />
•<br />
•<br />
•<br />
•<br />
• •<br />
•<br />
•<br />
•<br />
•<br />
•<br />
•<br />
•<br />
•<br />
•<br />
•<br />
•<br />
•<br />
•<br />
•<br />
• •<br />
• • •<br />
•<br />
• •<br />
•<br />
•<br />
•<br />
•<br />
•<br />
•<br />
•<br />
•<br />
•<br />
• •<br />
•<br />
•<br />
•<br />
•<br />
•<br />
•<br />
•<br />
•<br />
•<br />
•<br />
•<br />
•<br />
•<br />
•<br />
•<br />
•<br />
• •<br />
•<br />
•<br />
•<br />
•<br />
• •<br />
•<br />
•<br />
•<br />
•<br />
•<br />
•<br />
•<br />
•<br />
•<br />
•<br />
•<br />
•<br />
•<br />
•<br />
•<br />
•<br />
•<br />
•<br />
•<br />
•<br />
•<br />
•<br />
•<br />
•<br />
•<br />
•<br />
•<br />
•<br />
•<br />
•<br />
•<br />
•<br />
•<br />
•<br />
•<br />
•<br />
•<br />
•<br />
•<br />
•<br />
•<br />
• •<br />
•<br />
•<br />
•<br />
•<br />
•<br />
•<br />
•<br />
•<br />
•<br />
• •<br />
•<br />
•<br />
•<br />
•<br />
•<br />
•<br />
•<br />
•<br />
•<br />
•<br />
•<br />
•<br />
•<br />
• •<br />
•<br />
•<br />
•<br />
•<br />
•<br />
•<br />
•<br />
•<br />
•<br />
•<br />
•<br />
•<br />
•<br />
•<br />
•<br />
•<br />
•<br />
•<br />
•<br />
•<br />
•<br />
•<br />
•<br />
•<br />
•<br />
•<br />
•<br />
•<br />
• •<br />
•<br />
•<br />
•<br />
•<br />
•<br />
•<br />
•<br />
•<br />
•<br />
•<br />
•<br />
•<br />
•<br />
•<br />
•<br />
•<br />
•<br />
•<br />
•<br />
•<br />
•<br />
•<br />
•<br />
•<br />
•<br />
• •<br />
•<br />
•<br />
•<br />
•<br />
•<br />
•<br />
•<br />
•<br />
•<br />
•<br />
•<br />
•<br />
•<br />
• •<br />
• •<br />
• •<br />
•<br />
• •<br />
•<br />
•<br />
•<br />
•<br />
•<br />
•<br />
•<br />
•<br />
• •<br />
•<br />
•<br />
•<br />
•<br />
•<br />
•<br />
•<br />
•<br />
•<br />
•<br />
•<br />
•<br />
•<br />
•<br />
•<br />
•<br />
•<br />
•<br />
•<br />
•<br />
•<br />
•<br />
•<br />
• •<br />
•<br />
•<br />
•<br />
•<br />
• •<br />
•<br />
•<br />
•<br />
•<br />
•<br />
•<br />
•<br />
•<br />
•<br />
•<br />
• • •<br />
•<br />
•<br />
•<br />
•<br />
•<br />
•<br />
•<br />
•<br />
• •<br />
•<br />
•<br />
• •<br />
•<br />
• •<br />
•<br />
•<br />
•<br />
•<br />
•<br />
•<br />
•<br />
•<br />
•<br />
•<br />
•<br />
• •<br />
•<br />
•<br />
•<br />
•<br />
•<br />
•<br />
•<br />
•<br />
•<br />
•<br />
•<br />
•<br />
•<br />
•<br />
•<br />
•<br />
•<br />
•<br />
•<br />
•<br />
•<br />
•<br />
•<br />
•<br />
•<br />
•<br />
•<br />
•<br />
•<br />
•<br />
•<br />
•<br />
•<br />
•<br />
•<br />
•<br />
•<br />
•<br />
•<br />
•<br />
•<br />
•<br />
•<br />
•<br />
•<br />
•<br />
• •<br />
•<br />
•<br />
•<br />
•<br />
•<br />
•<br />
• •<br />
•<br />
•<br />
•<br />
•<br />
•<br />
•<br />
•<br />
•<br />
•<br />
•<br />
•<br />
•<br />
•<br />
•<br />
•<br />
•<br />
•<br />
•<br />
•<br />
•<br />
•<br />
•<br />
•<br />
•<br />
•<br />
•<br />
•<br />
•<br />
•<br />
•<br />
•<br />
•<br />
•<br />
•<br />
•<br />
•<br />
•<br />
•<br />
•<br />
•<br />
•<br />
•<br />
•<br />
•<br />
•<br />
•<br />
•<br />
•<br />
•<br />
•<br />
•<br />
•<br />
•<br />
•<br />
•<br />
•<br />
•<br />
•<br />
•<br />
•<br />
•<br />
•<br />
•<br />
•<br />
•<br />
•<br />
•<br />
• •<br />
•<br />
•<br />
•<br />
•<br />
•<br />
•<br />
•<br />
•<br />
•<br />
•<br />
•<br />
•<br />
• •<br />
•<br />
•<br />
•<br />
0 2 4 6 8 10<br />
Time in years<br />
Graduate Summer Session in Epidemiology Slide 93<br />
•<br />
•<br />
ID=2<br />
ID=74<br />
ID=171
CHAPTER 2 Epid <strong>766</strong>, D. Zhang<br />
• Model to address Objective 3: Do males have more stable (true)<br />
baseline cholesterol level and change rate than females?<br />
⋆ From model (2.1), assume bi0, bi1 have different distributions for<br />
males and females:<br />
⎛ ⎞ ⎛⎡<br />
⎤ ⎡ ⎤⎞<br />
Males:<br />
Females:<br />
⎝ bi0<br />
⎛<br />
bi1<br />
⎝ bi0<br />
bi1<br />
⋆ We would like to test<br />
⎠ ∼ N<br />
⎞<br />
⎝<br />
⎠ ∼ N<br />
⎣ µm0<br />
⎛⎡<br />
⎝<br />
µm1<br />
⎣ µf0<br />
µf1<br />
⎦ ,<br />
⎤<br />
⎦,<br />
⎣ σm00 σm01<br />
⎡<br />
σm01 σm11<br />
⎣ σf00 σf01<br />
σf01 σf11<br />
⎦⎠<br />
⎤⎞<br />
H0 : σm00 = σf00, σm01 = σf01, σm11 = σf11 (i.e., the above<br />
two variance-covariance matrices are the same).<br />
⎦⎠(2.9)<br />
Graduate Summer Session in Epidemiology Slide 94
CHAPTER 2 Epid <strong>766</strong>, D. Zhang<br />
⋆ The SAS program and its output for fitting above model are as<br />
follows:<br />
title "Framingham data: do males have more stable (true) baseline";<br />
title2 "cholesterol level and change rate than females?";<br />
proc mixed data=cholst;<br />
class newid gender;<br />
model cholst = sex year sex*year / s;<br />
random intercept year / type=un subject=newid group=gender g;<br />
repeated / type=vc subject=newid;<br />
run;<br />
Framingham data: do males have more stable (true) baseline 1<br />
cholesterol level and change rate than females?<br />
The Mixed Procedure<br />
Iteration History<br />
Iteration Evaluations -2 Res Log Like Criterion<br />
0 1 10889.09479529<br />
1 3 9939.57691271 0.00000317<br />
2 1 9939.56399905 0.00000000<br />
The Mixed Procedure<br />
Convergence criteria met.<br />
Graduate Summer Session in Epidemiology Slide 95
CHAPTER 2 Epid <strong>766</strong>, D. Zhang<br />
Estimated G Matrix<br />
Row Effect newid gender Col1 Col2 Col3 Col4<br />
1 Intercept 1 0 1402.47 -4.7015<br />
2 year 1 0 -4.7015 1.8279<br />
3 Intercept 1 1 1532.81 3.6119<br />
4 year 1 1 3.6119 4.7970<br />
Covariance Parameter Estimates<br />
Cov Parm Subject Group Estimate<br />
UN(1,1) newid gender 0 1402.47<br />
UN(2,1) newid gender 0 -4.7015<br />
UN(2,2) newid gender 0 1.8279<br />
UN(1,1) newid gender 1 1532.81<br />
UN(2,1) newid gender 1 3.6119<br />
UN(2,2) newid gender 1 4.7970<br />
Residual newid 433.71<br />
Fit <strong>Statistics</strong><br />
-2 Res Log Likelihood 9939.6<br />
AIC (smaller is better) 9953.6<br />
AICC (smaller is better) 9953.7<br />
BIC (smaller is better) 9976.7<br />
Graduate Summer Session in Epidemiology Slide 96
CHAPTER 2 Epid <strong>766</strong>, D. Zhang<br />
⋆ In order to test H0 : the two variance matrices are the<br />
same using the likelihood ratio test, we need to fit a model with<br />
the same fixed and random effects but under H0. The following<br />
is the SAS program and its output under H0. This null model is<br />
called model (2.90).<br />
title "Framingham data under H0: males and females have the same variance";<br />
title2 "matrices <strong>of</strong> baseline cholesterol level and change rate";<br />
proc mixed data=cholst;<br />
class newid gender;<br />
model cholst = sex year sex*year / s;<br />
random intercept year / type=un subject=newid g;<br />
repeated / type=vc subject=newid;<br />
run;<br />
Framingham data under H0: males and females have the same variance 1<br />
matrices <strong>of</strong> baseline cholesterol level and change rate<br />
The Mixed Procedure<br />
Model Information<br />
<strong>Data</strong> Set WORK.CHOLST<br />
Dependent Variable cholst<br />
Covariance Structures Unstructured, Variance<br />
The Mixed Procedure<br />
Convergence criteria met.<br />
Graduate Summer Session in Epidemiology Slide 97
CHAPTER 2 Epid <strong>766</strong>, D. Zhang<br />
Estimated G Matrix<br />
Row Effect newid Col1 Col2<br />
1 Intercept 1 1465.85 -0.2516<br />
2 year 1 -0.2516 3.2618<br />
Covariance Parameter Estimates<br />
Cov Parm Subject Estimate<br />
UN(1,1) newid 1465.85<br />
UN(2,1) newid -0.2516<br />
UN(2,2) newid 3.2618<br />
Residual newid 434.17<br />
Fit <strong>Statistics</strong><br />
-2 Res Log Likelihood 9943.0<br />
AIC (smaller is better) 9951.0<br />
AICC (smaller is better) 9951.1<br />
BIC (smaller is better) 9964.2<br />
⋆ The difference <strong>of</strong> -2 residual log likelihood is 9943 -<br />
9939.6 = 3.4 (between models (2.9) and (2.90)) and the P-value<br />
= P[χ 2 3 ≥ 3.4] = 0.33.<br />
Graduate Summer Session in Epidemiology Slide 98
CHAPTER 2 Epid <strong>766</strong>, D. Zhang<br />
⋆ Note: We can also test H0: whether or not males and females<br />
have the same variance matrices <strong>of</strong> true baseline cholesterol<br />
level and change rate <strong>of</strong> cholesterol level by adjusting for<br />
baseline age and sex. We already fit the model under H0 (model<br />
(2.8)) and -2 residual log likelihood is 9907.9. The<br />
alternative model can be fit using the following SAS program<br />
(called model (2.8A)).<br />
title "Framingham data: do males have more stable (true) baseline cholesterol";<br />
title2 "level and change rate than females adjusting for sex and baseline age";<br />
proc mixed data=cholst;<br />
class newid gender;<br />
model cholst = sex age year sex*year age*year / s;<br />
random intercept year / type=un subject=newid group=gender g;<br />
repeated / type=vc subject=newid;<br />
run;<br />
Graduate Summer Session in Epidemiology Slide 99
CHAPTER 2 Epid <strong>766</strong>, D. Zhang<br />
⋆ Part <strong>of</strong> the output <strong>from</strong> above program is<br />
Framingham data: do males have more stable (true) baseline cholester 20<br />
level and change rate than females adjusting for sex and baseline age<br />
The Mixed Procedure<br />
Model Information<br />
<strong>Data</strong> Set WORK.CHOLST<br />
Dependent Variable cholst<br />
Covariance Structures Unstructured, Variance<br />
The Mixed Procedure<br />
Convergence criteria met.<br />
Estimated G Matrix<br />
Row Effect newid gender Col1 Col2 Col3 Col4<br />
1 Intercept 1 0 1403.04 -2.6077<br />
2 year 1 0 -2.6077 1.5955<br />
3 Intercept 1 1 1021.77 30.7768<br />
4 year 1 1 30.7768 3.3214<br />
Covariance Parameter Estimates<br />
Cov Parm Subject Group Estimate<br />
UN(1,1) newid gender 0 1403.04<br />
UN(2,1) newid gender 0 -2.6077<br />
UN(2,2) newid gender 0 1.5955<br />
UN(1,1) newid gender 1 1021.77<br />
Graduate Summer Session in Epidemiology Slide 100
CHAPTER 2 Epid <strong>766</strong>, D. Zhang<br />
UN(2,1) newid gender 1 30.7768<br />
UN(2,2) newid gender 1 3.3214<br />
Residual newid 434.93<br />
Fit <strong>Statistics</strong><br />
-2 Res Log Likelihood 9901.6<br />
AIC (smaller is better) 9915.6<br />
AICC (smaller is better) 9915.7<br />
BIC (smaller is better) 9938.7<br />
⋆ The -2 residual log likelihood is 9901.6 so difference is<br />
9907.9-9901.6 = 6.3. The P-value = P[χ 2 3 ≥ 6.3] = 0.09, more<br />
evidence against H0.<br />
Graduate Summer Session in Epidemiology Slide 101
CHAPTER 2 Epid <strong>766</strong>, D. Zhang<br />
Comparison <strong>of</strong> fit statistics among models<br />
Model AIC BIC<br />
Model (2.1) 9968.1 9981.3<br />
Model (2.5) 9937. 9950.9<br />
Model (2.8) 9915.9 9929.1<br />
Model (2.9) 9953.6 9976.7<br />
Model (2.90) 9951.0 9964.2<br />
Model (2.8A) 9915.6 9938.7<br />
Graduate Summer Session in Epidemiology Slide 102
CHAPTER 2 Epid <strong>766</strong>, D. Zhang<br />
• Note:<br />
1. The choice <strong>of</strong> model, especially the fixed effects terms, depends<br />
on the questions we need to answer. However, we can use AIC or<br />
BIC to determine the random effects and the error structure.<br />
2. If we want a model with the most prediction power, we can<br />
consider a complicated model with AIC or BIC as a guide for<br />
model selection.<br />
3. It seems that model (2.8) is the winner among the above models<br />
if we are looking for a model with the most prediction power.<br />
Graduate Summer Session in Epidemiology Slide 103
CHAPTER 2 Epid <strong>766</strong>, D. Zhang<br />
2.5 GEE for linear mixed models<br />
• When the variation pattern in data is so complicated that you don’t<br />
feel comfortable in the random effects and their variance structure<br />
you imposed, you can use the model you posed to estimate the fixed<br />
effects (β’s) and use GEE approach to calculate the standard errors<br />
for the fixed effect estimates. These SE estimates will be valid<br />
regardless <strong>of</strong> the validity <strong>of</strong> the random effects structure you put. So<br />
these SE estimates are robust (we will talk more on Thursday).<br />
• For example, you can use the following model to estimate β’s:<br />
yij = β0 + β1tij + β2sexi + β3age i + β4sexitij + β5age itij<br />
+bi0 + bi1tij + ǫij.<br />
If you specify empirical in Proc mixed, you will get robust SE<br />
estimates. See the following SAS program and output.<br />
Graduate Summer Session in Epidemiology Slide 104
CHAPTER 2 Epid <strong>766</strong>, D. Zhang<br />
title "Using GEE to fit Framingham data";<br />
proc mixed data=cholst empirical;<br />
class newid;<br />
model cholst = year sex age sex*year age*year / s;<br />
random intercept year / type=un subject=newid;<br />
repeated / type=vc subject=newid;<br />
run;<br />
Output <strong>of</strong> the above program<br />
Using GEE to fit Framingham data 24<br />
The Mixed Procedure<br />
Model Information<br />
<strong>Data</strong> Set WORK.CHOLST<br />
Dependent Variable cholst<br />
Covariance Structures Unstructured, Variance<br />
Components<br />
Subject Effects newid, newid<br />
Estimation Method REML<br />
Residual Variance Method Parameter<br />
Fixed Effects SE Method Empirical<br />
Degrees <strong>of</strong> Freedom Method Containment<br />
Iteration History<br />
Iteration Evaluations -2 Res Log Like Criterion<br />
0 1 10813.99587154<br />
1 2 9907.89014721 0.00000655<br />
2 1 9907.86364103 0.00000000<br />
Convergence criteria met.<br />
Graduate Summer Session in Epidemiology Slide 105
CHAPTER 2 Epid <strong>766</strong>, D. Zhang<br />
The Mixed Procedure<br />
Covariance Parameter Estimates<br />
Cov Parm Subject Estimate<br />
UN(1,1) newid 1209.89<br />
UN(2,1) newid 13.5502<br />
UN(2,2) newid 2.5211<br />
Residual newid 434.15<br />
Fit <strong>Statistics</strong><br />
-2 Res Log Likelihood 9907.9<br />
AIC (smaller is better) 9915.9<br />
AICC (smaller is better) 9915.9<br />
BIC (smaller is better) 9929.1<br />
Null Model Likelihood Ratio Test<br />
DF Chi-Square Pr > ChiSq<br />
3 906.13 |t|<br />
Intercept 138.18 15.4017 197 8.97
CHAPTER 2 Epid <strong>766</strong>, D. Zhang<br />
What we observe:<br />
1. Fixed effects estimates and variance-covariance parameter estimates<br />
are exactly the same as those <strong>from</strong> model (2.8).<br />
2. The SE for the fixed effects estimates are different <strong>from</strong> those <strong>from</strong><br />
model (2.8). However, they are very close, indicating model (2.8)<br />
has reasonably good fit to the data and we don’t have to use GEE<br />
approach.<br />
Graduate Summer Session in Epidemiology Slide 107
CHAPTER 2 Epid <strong>766</strong>, D. Zhang<br />
2.6 Missing data issues<br />
However, GEE will be less efficient if a correct model can be specified;<br />
and if there are missing data, then the missing data mechanism has to be<br />
missing completely at random (MCAR) for GEE inference to be valid.<br />
Missing data mechanism:<br />
1. missing completely at random (MCAR): The reason that the data<br />
are missing has nothing to do with anything, i.e., at each time<br />
point, the observed data can be viewed as a random sample <strong>from</strong><br />
the population.<br />
2. missing at random (MAR): The reason that a subject has missing<br />
data may depend only on his/her observed data. Mixed model<br />
inference is valid under this condition. MCAR implies MAR.<br />
3. missing not at random (MNAR): The reason that a subject has<br />
missing data depends on his/her unobserved data. Special<br />
assumption (untestable) has to be made for inference.<br />
Graduate Summer Session in Epidemiology Slide 108
CHAPTER 2 Epid <strong>766</strong>, D. Zhang<br />
Ways to assess MCAR<br />
1. Suppose the missing data pattern (for y) looks like<br />
Time points<br />
1 2 3<br />
?<br />
? ?<br />
and assume x (such as age) is a completely observed variable.<br />
2. Compare x for the two groups with observed y and missing y at<br />
times 2 and 3 (using, say, two-sample t-test). A significant<br />
difference indicates the violation <strong>of</strong> MCAR. Otherwise, you may feel<br />
comfortable about the MCAR assumption.<br />
Remark: MAR cannot be tested.<br />
Graduate Summer Session in Epidemiology Slide 109
CHAPTER 2 Epid <strong>766</strong>, D. Zhang<br />
options ls=72 ps=72;<br />
Use age to test MCAR for Framingham data:<br />
data cholst;<br />
infile "cholst.dat";<br />
input newid id cholst sex age year;<br />
if year = . then delete;<br />
run;<br />
data base; set cholst;<br />
if year=0;<br />
keep newid age;<br />
run;<br />
data year;<br />
do newid=1 to 200;<br />
do year=0 to 10 by 2;<br />
output;<br />
end;<br />
end;<br />
run;<br />
data cholst; merge cholst year;<br />
by newid year;<br />
if cholst=. then yobs=0;<br />
else yobs=1;<br />
drop age;<br />
run;<br />
data cholst; merge cholst base;<br />
by newid;<br />
run;<br />
proc sort;<br />
by year;<br />
run;<br />
Graduate Summer Session in Epidemiology Slide 110
CHAPTER 2 Epid <strong>766</strong>, D. Zhang<br />
title "Test equality <strong>of</strong> age between missing and non-missing groups";<br />
proc ttest;<br />
var age;<br />
class yobs;<br />
by year;<br />
run;<br />
SAS output:<br />
Test equality <strong>of</strong> age between missing and non-missing groups 1<br />
-------------------------------- year=2 --------------------------------<br />
The TTEST Procedure<br />
T-Tests<br />
Variable Method Variances DF t Value Pr > |t|<br />
age Pooled Equal 198 0.35 0.7298<br />
age Satterthwaite Unequal 29.6 0.35 0.7325<br />
-------------------------------- year=4 --------------------------------<br />
The TTEST Procedure<br />
T-Tests<br />
Variable Method Variances DF t Value Pr > |t|<br />
age Pooled Equal 198 -0.23 0.8172<br />
age Satterthwaite Unequal 39.5 -0.22 0.8304<br />
Graduate Summer Session in Epidemiology Slide 111
CHAPTER 2 Epid <strong>766</strong>, D. Zhang<br />
-------------------------------- year=6 ---------------------------------<br />
T-Tests<br />
Variable Method Variances DF t Value Pr > |t|<br />
age Pooled Equal 198 1.43 0.1536<br />
age Satterthwaite Unequal 40.3 1.37 0.1774<br />
-------------------------------- year=8 --------------------------------<br />
T-Tests<br />
Variable Method Variances DF t Value Pr > |t|<br />
age Pooled Equal 198 0.47 0.6418<br />
age Satterthwaite Unequal 47 0.50 0.6179<br />
------------------------------- year=10 --------------------------------<br />
T-Tests<br />
Variable Method Variances DF t Value Pr > |t|<br />
age Pooled Equal 198 0.24 0.8071<br />
age Satterthwaite Unequal 63.3 0.27 0.7879<br />
Graduate Summer Session in Epidemiology Slide 112
CHAPTER 3 Epid <strong>766</strong>, D. Zhang<br />
3 Modeling and design issues<br />
• How to handle baseline response?<br />
• Do we model previous responses as covariates?<br />
• Modeling response vs. modeling the change <strong>of</strong> response<br />
• A simulation study comparing modeling response to modeling its<br />
change<br />
• Design a longitudinal study. Sample size calculation<br />
1. Comparing time-averaged means<br />
2. Comparing slopes<br />
Graduate Summer Session in Epidemiology Slide 113
CHAPTER 3 Epid <strong>766</strong>, D. Zhang<br />
3.1 How to handle baseline response?<br />
• Model baseline outcome as part <strong>of</strong> the response. For example,<br />
yij = β0 + β1xij + eij, i = 1, ..., m, j = 1, 2, ..., ni, (3.1)<br />
where the errors eij include random effects and other errors, and<br />
hence are correlated. For example, eij = bi + ǫij for a random<br />
intercept model.<br />
• Model baseline outcome as a covariate. For example,<br />
yij = β0 + β1xij + β2yi1 + ǫij, i = 1, ..., m, j = 2, ..., ni. (3.2)<br />
Comments:<br />
1. There are some subtle difference between these two models. The<br />
regression parameters β0, β1 and the variance components have<br />
different interpretation and hence we will get different estimates<br />
<strong>from</strong> two models. β1 in model (3.1) is the overall effect <strong>of</strong> x on y,<br />
Graduate Summer Session in Epidemiology Slide 114
CHAPTER 3 Epid <strong>766</strong>, D. Zhang<br />
while β1 in model (3.2) is the adjusted covariate effect <strong>of</strong> x on y<br />
adjusting for baseline response.<br />
2. Model (3.2) is more convenient for prediction. Although one can<br />
also get a prediction model similar to model (3.2) by conditioning on<br />
the baseline response <strong>from</strong> model (3.1).<br />
3. When baseline response yi1 is used as a covariate, it CANNOT be<br />
re-used in the outcome variable. For model (3.2), index j goes <strong>from</strong><br />
2 to ni. Because <strong>of</strong> this, the estimates <strong>from</strong> model (3.1) may be<br />
more efficient.<br />
4. It is obvious that in the presence <strong>of</strong> missing data, the subjects with<br />
baseline measurements only will be deleted <strong>from</strong> analysis if model<br />
(3.2) is used. In the case where missingness depends on the baseline<br />
measurements, inference using model (3.2) will be invalid. However,<br />
model (3.1) will still give valid inference. We will see a simulation<br />
study later.<br />
Graduate Summer Session in Epidemiology Slide 115
CHAPTER 3 Epid <strong>766</strong>, D. Zhang<br />
3.2 Do we model previous responses as<br />
covariates?<br />
One might consider an auto-regressive type <strong>of</strong> model like the following<br />
one instead <strong>of</strong> (3.1):<br />
yij = β0 + β1xij + β2yi,j−1 + ǫij, i = 1, ..., m, j = 2, ..., ni. (3.3)<br />
Comments:<br />
1. This model is different <strong>from</strong> models (3.1) and (3.2). Here β1 is the<br />
adjusted effect <strong>of</strong> x on y after adjusting for the previous response.<br />
Therefore, they have different interpretation.<br />
2. Since we allow the current response depends on the previous<br />
response in this model, part <strong>of</strong> the correlation among responses is<br />
taken away by the coefficient β2. Hence the errors may have much<br />
simpler variance structure than the errors in model (3.1). In fact,<br />
people <strong>of</strong>ten assume ǫij in (3.3) to be independent. This is an<br />
Graduate Summer Session in Epidemiology Slide 116
CHAPTER 3 Epid <strong>766</strong>, D. Zhang<br />
example <strong>of</strong> transition models. Consequently, the variance<br />
component parameters in this model are different and have different<br />
interpretation <strong>from</strong> those in model (3.1).<br />
3. We can obtain a similar model to this one if we assume the errors in<br />
model (3.1) have an AR(1) variance structure.<br />
4. Similar to model (3.2), this model is more convenient for prediction.<br />
5. Similar to model (3.2), subjects with baseline measurements only<br />
will be deleted <strong>from</strong> the analysis. If missingness <strong>of</strong> subsequent<br />
measurements depends on the baseline measurements, this model<br />
will give invalid inference on the parameters <strong>of</strong> interest.<br />
Graduate Summer Session in Epidemiology Slide 117
CHAPTER 3 Epid <strong>766</strong>, D. Zhang<br />
3.3 Modeling outcome vs. modeling the change <strong>of</strong><br />
outcome<br />
Define change <strong>from</strong> baseline:<br />
and consider model<br />
Comments:<br />
Dij = yij − yi1, i = 1, ..., m, j = 2, ..., ni<br />
Dij = β0 + β1xij + ǫij, i = 1, ..., m, j = 2, ..., ni. (3.4)<br />
1. This model emphasizes the effect <strong>of</strong> x on the change (<strong>from</strong> baseline<br />
value) <strong>of</strong> outcome. Therefore, β1 has different interpretation than<br />
the β1’s in previous models.<br />
2. Since we are modeling the difference, part <strong>of</strong> the correlation in the<br />
responses due to among individual variation is removed. Therefore,<br />
the errors in this model will have a simpler variance structure than<br />
Graduate Summer Session in Epidemiology Slide 118
CHAPTER 3 Epid <strong>766</strong>, D. Zhang<br />
model (3.1), and the parameters in the variance structures have<br />
different interpretation.<br />
3. Baseline outcome yi1 can be used as a covariate.<br />
4. It cannot model how x affects the overall mean <strong>of</strong> outcome.<br />
5. Similar to models (3.2) and (3.3), subjects with baseline<br />
measurements only will be deleted <strong>from</strong> the analysis, and if<br />
missingness depends on the baseline measurements, the inference<br />
will be invalid.<br />
6. Which model to use depends on the scientific questions we want to<br />
address.<br />
Graduate Summer Session in Epidemiology Slide 119
CHAPTER 3 Epid <strong>766</strong>, D. Zhang<br />
A simulation study<br />
Generate data <strong>from</strong> the following model:<br />
yij = β0 + β1tj + bi + ǫij, i = 1, ..., 50, j = 1, 2,<br />
where β0 = 1, β1 = 2, t1 = 0, t2 = 1, bi ∼ N(0, 1), ǫij ∼ N(0, 1).<br />
1. yi1 can be viewed as pre-test (or baseline) score, yi2 can be viewed<br />
as post-test score for subject i.<br />
2. In the simulation, we let yi2 be missing whenever the baseline<br />
measurement yi1 is negative.<br />
3. β1 = E(yi2) − E(yi1). We would like to make inference on β1 in the<br />
presence <strong>of</strong> missing data.<br />
Graduate Summer Session in Epidemiology Slide 120
CHAPTER 3 Epid <strong>766</strong>, D. Zhang<br />
One simulated data set:<br />
Obs id score0 score1 scoredif<br />
1 1 1.33662 1.96479 0.62816<br />
2 2 0.17404 1.93052 1.75648<br />
3 3 1.45672 5.07021 3.61349<br />
4 4 1.08229 3.71837 2.63608<br />
5 5 0.55392 2.51172 1.95780<br />
6 6 1.73579 3.43906 1.70327<br />
7 7 -0.27640 . .<br />
8 8 0.78154 1.60275 0.82121<br />
9 9 -0.33015 . .<br />
10 10 -1.11409 . .<br />
11 11 1.54039 2.02123 0.48084<br />
12 12 1.20696 2.19839 0.99143<br />
13 13 1.35767 2.33060 0.97293<br />
14 14 0.68858 1.55404 0.86545<br />
15 15 0.81951 3.78494 2.96542<br />
16 16 0.49849 1.40747 0.90897<br />
17 17 -1.68078 . .<br />
18 18 2.31063 3.70494 1.39431<br />
19 19 1.05800 2.22613 1.16813<br />
20 20 1.00388 4.72160 3.71773<br />
21 21 4.45060 7.63933 3.18873<br />
22 22 2.20755 2.18365 -0.02390<br />
23 23 1.02019 1.81962 0.79943<br />
24 24 2.30880 4.09571 1.78691<br />
25 25 1.93793 3.26014 1.32222<br />
26 26 -1.30937 . .<br />
27 27 -0.80651 . .<br />
28 28 0.65134 4.66953 4.01819<br />
29 29 0.72529 0.77726 0.05197<br />
30 30 1.00030 4.76540 3.76511<br />
31 31 2.75257 5.03208 2.27951<br />
32 32 -1.71925 . .<br />
33 33 0.65070 3.11335 2.46265<br />
34 34 0.23703 2.03079 1.79376<br />
35 35 -1.32099 . .<br />
Graduate Summer Session in Epidemiology Slide 121
CHAPTER 3 Epid <strong>766</strong>, D. Zhang<br />
36 36 0.50320 1.96533 1.46214<br />
37 37 4.41193 5.55117 1.13924<br />
38 38 -0.60138 . .<br />
39 39 -0.24154 . .<br />
40 40 2.31534 3.74849 1.43315<br />
41 41 1.55065 5.14498 3.59433<br />
42 42 1.32359 5.46448 4.14089<br />
43 43 1.08330 4.74553 3.66223<br />
44 44 0.14231 3.23607 3.09376<br />
45 45 -0.08897 . .<br />
46 46 -1.03434 . .<br />
47 47 3.75676 4.16679 0.41004<br />
48 48 3.19876 4.32866 1.12990<br />
49 49 1.02650 2.97035 1.94386<br />
50 50 1.39603 1.75847 0.36244<br />
1. If we take difference as we did in the previous model, then we would<br />
use the sample mean <strong>of</strong> the non-missing difference (only 38<br />
differences) to estimate β1, this will give � β1 = 1.85 (SE=0.20).<br />
Obviously, this estimate is biased (here it is biased towards zero).<br />
This is a special case <strong>of</strong> two-stage analyses.<br />
2. Since we have a special case <strong>of</strong> longitudinal studies, we can use<br />
mixed model approach to estimate β1. For this purpose, let us<br />
re-arrange data in the right format for Proc mixed.<br />
Graduate Summer Session in Epidemiology Slide 122
CHAPTER 3 Epid <strong>766</strong>, D. Zhang<br />
3. The data for the first 20 subjects are given below:<br />
Obs id score time<br />
1 1 1.33662 0<br />
2 1 1.96479 1<br />
3 2 0.17404 0<br />
4 2 1.93052 1<br />
5 3 1.45672 0<br />
6 3 5.07021 1<br />
7 4 1.08229 0<br />
8 4 3.71837 1<br />
9 5 0.55392 0<br />
10 5 2.51172 1<br />
11 6 1.73579 0<br />
12 6 3.43906 1<br />
13 7 -0.27640 0<br />
14 7 . 1<br />
15 8 0.78154 0<br />
16 8 1.60275 1<br />
17 9 -0.33015 0<br />
18 9 . 1<br />
19 10 -1.11409 0<br />
20 10 . 1<br />
4. We use the following SAS program for estimating β1<br />
proc mixed data=maindat;<br />
class id;<br />
model score = time / s;<br />
random int / subject=id type=vc;<br />
repeated / subject=id type=vc;<br />
run;<br />
Graduate Summer Session in Epidemiology Slide 123
CHAPTER 3 Epid <strong>766</strong>, D. Zhang<br />
5. Part <strong>of</strong> the output <strong>from</strong> the above SAS program:<br />
The Mixed Procedure<br />
Model Information<br />
<strong>Data</strong> Set WORK.MAINDAT<br />
Dependent Variable score<br />
Covariance Structure Variance Components<br />
Subject Effects id, id<br />
Estimation Method REML<br />
Residual Variance Method Parameter<br />
Fixed Effects SE Method Model-Based<br />
Degrees <strong>of</strong> Freedom Method Containment<br />
Class Level Information<br />
Class Levels Values<br />
id 50 1 2 ..<br />
Dimensions<br />
Covariance Parameters 2<br />
Columns in X 2<br />
Columns in Z Per Subject 1<br />
Subjects 50<br />
Max Obs Per Subject 2<br />
Observations Used 88<br />
Observations Not Used 12<br />
Total Observations 100<br />
Convergence criteria met.<br />
Covariance Parameter Estimates<br />
Graduate Summer Session in Epidemiology Slide 124
CHAPTER 3 Epid <strong>766</strong>, D. Zhang<br />
Cov Parm Subject Estimate<br />
Intercept id 1.4573<br />
Residual id 0.7828<br />
Fit <strong>Statistics</strong><br />
-2 Res Log Likelihood 300.6<br />
AIC (smaller is better) 304.6<br />
AICC (smaller is better) 304.8<br />
BIC (smaller is better) 308.4<br />
The SAS System 5<br />
The Mixed Procedure<br />
Solution for Fixed Effects<br />
Standard<br />
Effect Estimate Error DF t Value Pr > |t|<br />
Intercept 0.9146 0.2117 49 4.32
CHAPTER 3 Epid <strong>766</strong>, D. Zhang<br />
• The following table gives the simulation results comparing the<br />
longitudinal approach modeling all responses simultaneously and the<br />
two-stage approach modeling the difference based on 1000<br />
simulation runs:<br />
Method Mean SE SD Cov. prob.<br />
<strong>Longitudinal</strong> approach 2.002 0.222 0.257 0.91<br />
Two-stage approach 1.712 0.214 0.217 0.72<br />
where Mean is the sample mean <strong>of</strong> 1000 � β1’s <strong>from</strong> both approaches;<br />
SE is the sample mean <strong>of</strong> 1000 estimated SEs <strong>of</strong> � β1; SD is the sample<br />
standard deviation <strong>of</strong> 1000 � β1’s; Cov. prob. is the empirical coverage<br />
probability <strong>of</strong> 95% CI <strong>of</strong> β1.<br />
Graduate Summer Session in Epidemiology Slide 126
CHAPTER 3 Epid <strong>766</strong>, D. Zhang<br />
What we see <strong>from</strong> this table:<br />
1. The estimate � β1 using longitudinal approach by modeling all<br />
responses simultaneously is unbiased; however, if we take difference<br />
<strong>of</strong> the responses (here we are forced to delete all subjects with<br />
missing measurements), the estimate � β1 is biased.<br />
2. Although the estimate � β1 <strong>from</strong> the two-stage approach has slightly<br />
smaller SE or SD, since the estimate itself is biased, the coverage<br />
probability <strong>of</strong> the 95% CI <strong>of</strong> β1 is too low, making invalid inference<br />
on β1. However, the coverage probability <strong>of</strong> the 95% CI <strong>of</strong> β1 <strong>from</strong><br />
the longitudinal approach is almost right at the nominal level (0.95).<br />
3. With mixed model approach, we can estimate other quantities.<br />
Graduate Summer Session in Epidemiology Slide 127
CHAPTER 3 Epid <strong>766</strong>, D. Zhang<br />
3.4 Design a longitudinal study: Sample size<br />
estimation<br />
Recall that in the classical setting, sample size estimation is posed as a<br />
hypothesis testing problem such as the following one<br />
H0 : µ1 = µ2 vs HA : µ1 �= µ2.<br />
Assume y1k, ..., ymk ∼ N(µk, σ 2 ), k = 1, 2. Given significance level α,<br />
power γ, and the difference ∆ = (µ1 − µ2)/σ we wish to detect, the<br />
required total sample size (number <strong>of</strong> subjects) in each group should be<br />
�<br />
zα/2 + z1−γ<br />
m = 2<br />
∆<br />
Graduate Summer Session in Epidemiology Slide 128<br />
� 2<br />
.
CHAPTER 3 Epid <strong>766</strong>, D. Zhang<br />
Design a longitudinal study (cont’d):<br />
I: Compare time-averaged means between two groups.<br />
Assume model for the data to be collected:<br />
Group A : yij = µA + ǫij, i = 1, ..., m, j = 1, ..., n<br />
Group B : yij = µB + ǫij, i = 1, ..., m, j = 1, ..., n<br />
m =# <strong>of</strong> subjects, n =# <strong>of</strong> observations/subject, ǫij normally<br />
distributed errors with mean zero, variance σ 2 and correlation ρ.<br />
We want to test<br />
H0 : µA = µB vs HA : µA �= µB<br />
at level α with power γ to detect difference ∆ = (µA − µB)/σ. The<br />
quantities m and n have to satisfy<br />
m = 2(1 + (n − 1)ρ) (zα/2 + z1−γ) 2<br />
.<br />
n∆ 2<br />
Graduate Summer Session in Epidemiology Slide 129
CHAPTER 3 Epid <strong>766</strong>, D. Zhang<br />
Comments:<br />
1. When n = 1, the study reduces to a cross-sectional study and the<br />
sample size formula reduces to the classical one.<br />
2. When ρ = 0 (responses are independent), the required sample size is<br />
1/n <strong>of</strong> that for classical study.<br />
3. When ρ = 1, required sample size is the same as that <strong>of</strong> the classical<br />
study.<br />
4. For fixed n, smaller ρ gives smaller sample size.<br />
5. If correlation is high, use more subjects and less obs/subject; if<br />
correlation is low, use less subjects and more obs/subject.<br />
6. The sample size formula depends on information on σ 2 and ρ.<br />
7. One can choose a combination <strong>of</strong> m and n to meet one’s specific<br />
needs.<br />
8. The above formula is for two-sided test.<br />
Graduate Summer Session in Epidemiology Slide 130
CHAPTER 3 Epid <strong>766</strong>, D. Zhang<br />
• An example: If n = 3, α = 0.05, γ = 0.8, then the number <strong>of</strong><br />
subjects (m) per group is<br />
m = 2(1 + 2ρ)<br />
(1.96 + 0.84)2<br />
3∆ 2<br />
ρ 0.1 0.2 0.3 0.4 0.5 0.6 0.7 0.8<br />
0.2 733 184 82 46 30 21 15 12<br />
0.3 838 210 94 53 34 24 18 14<br />
0.4 942 236 105 59 38 27 20 15<br />
0.5 1047 262 117 66 42 30 22 17<br />
0.6 1152 288 128 72 47 32 24 18<br />
0.7 1256 314 140 79 51 35 26 20<br />
0.8 1361 341 152 86 55 38 28 22<br />
Graduate Summer Session in Epidemiology Slide 131<br />
∆
CHAPTER 3 Epid <strong>766</strong>, D. Zhang<br />
Design a longitudinal study (cont’d):<br />
II: Compare slopes between two groups.<br />
Model for the data to be collected:<br />
Group A : yij = β0A + β1Atj + ǫij, i = 1, ..., m, j = 1, ..., n<br />
Group B : yij = β0B + β1Btj + ǫij, i = 1, ..., m, j = 1, ..., n<br />
m =# <strong>of</strong> subjects, n =# <strong>of</strong> observations/subject, ǫij are normal errors<br />
with mean zero, variance σ 2 and correlation ρ.<br />
We are interested in testing<br />
H0 : β1A = β1B vs HA : β1A �= β1B<br />
at level α with power γ to detect difference ∆ = (β1A − β1B)/σ. The<br />
quantities m and n have to satisfy<br />
, s 2 �n j=1<br />
t =<br />
(tj − ¯t) 2<br />
.<br />
n<br />
m = 2(1 − ρ)(z α/2 + z1−γ) 2<br />
n∆ 2 s 2 t<br />
Graduate Summer Session in Epidemiology Slide 132
CHAPTER 3 Epid <strong>766</strong>, D. Zhang<br />
Comments:<br />
1. For fixed time points tj, larger ρ gives smaller sample size m.<br />
2. If ρ = 1, one subject <strong>from</strong> each group is enough.<br />
3. ρ = 0 will require maximum sample size m.<br />
4. If correlation is low, use more subjects and less obs/subject; if<br />
correlation is high, use less subjects and more obs/subject.<br />
5. The sample size formula depends on information on σ 2 and ρ and<br />
the placement <strong>of</strong> time points tj’s.<br />
6. One can choose a combination <strong>of</strong> m and n to meet one’s specific<br />
needs.<br />
7. The above formula is for two-sided test.<br />
Graduate Summer Session in Epidemiology Slide 133
CHAPTER 3 Epid <strong>766</strong>, D. Zhang<br />
• An example: If n = 3, α = 0.05, γ = 0.8, t = (0, 2, 5) so s 2 t = 4.222,<br />
then the number <strong>of</strong> subjects (m) per group is<br />
m =<br />
2(1 − ρ)(1.96 + 0.84)2<br />
3 × 4.222∆ 2<br />
ρ 0.02 0.03 0.04 0.05 0.06 0.07 0.08 0.09 0.10<br />
0.2 2479 1102 620 397 276 203 155 123 100<br />
0.3 2169 964 543 348 241 178 136 108 87<br />
0.4 1859 827 465 298 207 152 117 92 75<br />
0.5 1550 689 388 248 173 127 97 77 62<br />
0.6 1240 551 310 199 138 102 78 62 50<br />
0.7 930 414 233 149 104 76 59 46 38<br />
0.8 620 276 155 100 69 51 39 31 25<br />
Graduate Summer Session in Epidemiology Slide 134<br />
∆
CHAPTER 4 Epid <strong>766</strong>, D. Zhang<br />
4 Modeling discrete longitudinal data<br />
• Generalized estimating equations (GEEs)<br />
1. Why GEEs?<br />
2. Key features <strong>of</strong> GEEs<br />
3. Some popular GEE models<br />
4. Some basics <strong>of</strong> GEEs<br />
5. Interpretation <strong>of</strong> GEEs<br />
6. Analyze infectious disease data using GEE<br />
7. Analyze epileptic data using GEE<br />
• Generalized linear mixed models (GLMMs)<br />
1. Model specification & implementation<br />
2. Analyze infectious disease data using a GLMM<br />
3. Analyze epileptic data using a GLMM<br />
Graduate Summer Session in Epidemiology Slide 135
CHAPTER 4 Epid <strong>766</strong>, D. Zhang<br />
4.1 Generalized estimating equations (GEEs) for<br />
continuous and discrete longitudinal data<br />
4.1.1 Why GEEs?<br />
• Recall that a linear mixed model for longitudinal data may take the<br />
form:<br />
yij = β0 + β1tij + β2xij2 + · · · + βpxijp + bi0 + bi1tij + ǫij.<br />
• Key features:<br />
1. Outcome yij is continuous and normally distributed.<br />
2. Correlation in outcome observations <strong>from</strong> the same individuals is<br />
directly modeled using random effects (e.g., random intercept<br />
and slope).<br />
• However,<br />
1. in many biomedical studies, the outcome variables are discrete<br />
Graduate Summer Session in Epidemiology Slide 136
CHAPTER 4 Epid <strong>766</strong>, D. Zhang<br />
(not continuous). For example, the outcome is binary (yes/no) in<br />
Indonesian children study, and the outcome is count in the<br />
Epileptic clinical trial.<br />
2. sometimes, we are mainly interested in the covariate effects, not<br />
in correlation among the outcome observations <strong>from</strong> the same<br />
subject. A partial reason is that it is much harder to know how<br />
the discrete observations are correlated to each other over time<br />
than continuous outcomes.<br />
3. we might also want to model the correlation in a natural way<br />
jointly with the estimation <strong>of</strong> covariate effects <strong>of</strong> interest.<br />
Graduate Summer Session in Epidemiology Slide 137
CHAPTER 4 Epid <strong>766</strong>, D. Zhang<br />
What is wrong with the classical regression approach such<br />
as the logistic regression for binary outcomes?<br />
• Classical logistic regression model:<br />
yi ∼ Binomial(1, πi(xi)), yi = 1/0, πi(xi) = E[yi|xi]<br />
� �<br />
πi(xi)<br />
logit{πi(xi)} = log<br />
1 − πi(xi)<br />
• Key features:<br />
= β0 + β1xi1 + · · · + βpxip.<br />
1. Each subject contributes only one binary observation.<br />
2. It is reasonable to assume that the outcomes <strong>from</strong> different<br />
subjects are independent.<br />
• However, in a longitudinal study,<br />
1. Each subject has multiple binary (1/0) responses over time.<br />
2. The subjects with higher probability to get disease will tend to<br />
have more 1’s, resulting a correlation.<br />
3. Even though a classical regression by ignoring correlation will<br />
Graduate Summer Session in Epidemiology Slide 138
CHAPTER 4 Epid <strong>766</strong>, D. Zhang<br />
give us correct and meaningful regression coefficient estimates,<br />
their SEs are <strong>of</strong>ten too small, resulting invalid inference.<br />
4. The correlation has to be taken into account for valid inference<br />
(to get correct standard errors <strong>of</strong> the regression coefficient<br />
estimates).<br />
• Generalized estimating equations (GEEs) is an approach<br />
that allows us to make valid inference by implicitly taken into<br />
account the correlation.<br />
Graduate Summer Session in Epidemiology Slide 139
CHAPTER 4 Epid <strong>766</strong>, D. Zhang<br />
4.1.2 Key features <strong>of</strong> GEEs for analyzing longitudinal data<br />
1. We only need to correctly specify how the mean <strong>of</strong> the outcome<br />
variable is related to the covariates <strong>of</strong> interest. For example, for the<br />
infection disease study,<br />
yij ∼ Binomial(1, πij(xij))<br />
logit{πij(xij)} = β0 + β1seasonij + β2Xeroij + β3age i<br />
+β4timeij + β5sexi + β6height ij,<br />
πij(xij) = P[yij = 1|xij] = E(yij|xij) is the population<br />
probability <strong>of</strong> respiratory infection for the population defined by<br />
the specific covariate values (i.e., xij).<br />
2. The correlation among the observations <strong>from</strong> the same subject over<br />
time is not the major interest and is treated as nuisance.<br />
3. We can specify a correlation structure. The validity <strong>of</strong> the inference<br />
does not depend on the correct specification <strong>of</strong> this structure. GEE<br />
Graduate Summer Session in Epidemiology Slide 140
CHAPTER 4 Epid <strong>766</strong>, D. Zhang<br />
will give us a robust inference on the regression coefficients, which is<br />
valid regardless whether or not the correlation structure we specified<br />
is right.<br />
4. GEE calculates correct SEs for the regression coefficient estimates<br />
using sandwich estimates that will take into account the possibility<br />
that the correlation structure is misspecified.<br />
5. The regression coefficients in GEE have population-average<br />
interpretation.<br />
6. A fundamental assumption on missing data is that missing data<br />
mechanism has to be MCAR, while a likelihood-based approach only<br />
requires MAR. The GEE approach will also be less efficient than a<br />
likelihood-based approach if the likelihood can be correctly specified.<br />
Graduate Summer Session in Epidemiology Slide 141
CHAPTER 4 Epid <strong>766</strong>, D. Zhang<br />
4.1.3 Some popular GEE Models<br />
• Continuous (Normal):<br />
µ(x) = β0 + β1x1 + · · · + βpxp<br />
where µ(x) = E(y|x) is the mean <strong>of</strong> outcome variable at<br />
x = (x1, ..., xp), such as mean <strong>of</strong> cholesterol level.<br />
• Proportion (Binomial, Binary):<br />
logit{π(x)} = β0 + β1x1 + · · · + βpxp<br />
π(x) = P[y = 1|x] = E(y|x) such as disease risk.<br />
logit(π) = log{π/(1 − π)} is the logit link function. Other link<br />
functions are possible.<br />
Graduate Summer Session in Epidemiology Slide 142
CHAPTER 4 Epid <strong>766</strong>, D. Zhang<br />
• Count or rate (Poisson-type)<br />
log{λ(x)} = β0 + β1x1 + · · · + βpxp<br />
λ(x) is the rate (e.g. λ(x) is the incidence rate <strong>of</strong> a disease) for the<br />
count data (number <strong>of</strong> events) y over a (time, space) region T such<br />
that<br />
y|x ∼ Poisson{λ(x)T }<br />
Here log(.) link is used. Other link functions are possible.<br />
Note: For count data, we have to be concerned the possible<br />
over-dispersion in the data. That is<br />
var(y|x) > E(y|x).<br />
One way to model this phenomenon is to use an over-dispersion<br />
parameter φ and model the variance-mean relationship as follows:<br />
var(y|x) = φE(y|x).<br />
Graduate Summer Session in Epidemiology Slide 143
CHAPTER 4 Epid <strong>766</strong>, D. Zhang<br />
4.1.4 Some basics <strong>of</strong> GEEs<br />
• <strong>Data</strong>: yij, i = 1, ..., m, j = 1, ..., ni with mean<br />
Denote<br />
yi =<br />
⎛<br />
⎜<br />
⎝<br />
yi1<br />
yi2<br />
.<br />
yini<br />
µij = E(yij|xij).<br />
⎞<br />
⎛<br />
⎟ ⎜<br />
⎟ ⎜<br />
⎟ ⎜<br />
⎟ , µi = ⎜<br />
⎟ ⎜<br />
⎠ ⎝<br />
µi1<br />
µi2<br />
.<br />
µini<br />
⎞<br />
⎟ .<br />
⎟<br />
⎠<br />
• Suppose we correctly specify the mean structure for data yij:<br />
g(µij) = β0 + x1ijβ1 + ... + xpijβp,<br />
where g(µ) is the link function such as logit function for binary<br />
response and log link for count data.<br />
Graduate Summer Session in Epidemiology Slide 144
CHAPTER 4 Epid <strong>766</strong>, D. Zhang<br />
• A GEE solves the following generalized estimating equation for β<br />
(Liang and Zeger, 1986):<br />
Sβ(α, β) =<br />
m�<br />
i=1<br />
� ∂µi<br />
∂β<br />
� T<br />
V −1<br />
i (yi − µi) = 0, (4.1)<br />
where Vi is some matrix (intended to specify for var(yi|xi)) and α is<br />
the possible parameters in the correlation structure.<br />
• The above estimating equation is unbiased no matter what matrix<br />
Vi we use as long as the mean structure is right. That is<br />
E[Sβ(α, β)] = 0.<br />
• Under some regularity conditions, the solution � β <strong>from</strong> the GEE<br />
equation (4.1) has asymptotic distribution<br />
�β a ∼ N(β, Σ),<br />
Graduate Summer Session in Epidemiology Slide 145
CHAPTER 4 Epid <strong>766</strong>, D. Zhang<br />
where<br />
Σ = I −1<br />
I0 =<br />
I1 =<br />
=<br />
0<br />
m�<br />
i=1<br />
m�<br />
i=1<br />
m�<br />
i=1<br />
I1I −1<br />
0<br />
D T i V −1<br />
i Di<br />
D T i V −1<br />
−1<br />
i var(yi|xi)Vi Di<br />
D T i V −1<br />
i (yi − µi( � β))(yi − µi( � β)) T V −1<br />
i Di<br />
Σ is called the empirical or robust variance estimate.<br />
• If Vi is correctly specified, then I1 ≈ I0 and Σ ≈ I −1<br />
0 (model based).<br />
In this case, � β is the most efficient estimate. Otherwise, Σ �= I −1<br />
0 .<br />
Graduate Summer Session in Epidemiology Slide 146
CHAPTER 4 Epid <strong>766</strong>, D. Zhang<br />
• Vi, the working variance matrix for yi (at xi), can be decomposed as<br />
where<br />
Γi =<br />
⎛<br />
⎜<br />
⎝<br />
Vi = Γ 1/2 1/2<br />
i RiΓi ,<br />
var(yi1|xi1) 0 · · · 0<br />
0 var(yi2|xi2) · · · 0<br />
.<br />
.<br />
0 · · · 0 var(yini|xini)<br />
and Ri is the correlation structure.<br />
.<br />
.<br />
⎞<br />
⎟<br />
⎟,<br />
⎟<br />
⎠<br />
• We may try to specify Ri so that it is close to the “true”. This Ri<br />
is called the working correlation matrix and may be mis-specified.<br />
Graduate Summer Session in Epidemiology Slide 147
CHAPTER 4 Epid <strong>766</strong>, D. Zhang<br />
• Some working correlation structures<br />
1. Independent: Ri(α) = Ini×ni. No α needs to be estimated.<br />
2. Exchangeable (compound symmetric):<br />
Ri =<br />
⎡<br />
⎢<br />
⎣<br />
1 α · · · α<br />
α 1 · · · α<br />
.<br />
.<br />
.<br />
.<br />
α α · · · 1<br />
Let eij = yij − �µij. Since E(eijeik) = φα (at true β), =⇒<br />
�α =<br />
1<br />
(N ∗ − p − 1) � φ<br />
m� �<br />
i=1<br />
j
CHAPTER 4 Epid <strong>766</strong>, D. Zhang<br />
3. AR(1):<br />
Ri =<br />
⎡<br />
⎢<br />
⎣<br />
1 α · · · α ni−1<br />
α 1 · · · α ni−2<br />
.<br />
.<br />
α ni−1 α ni−2 · · · 1<br />
Since E(eijei,j+1) = φα (at true β), =⇒<br />
�α =<br />
1<br />
(N ∗∗ − p − 1) � φ<br />
m�<br />
i=1<br />
.<br />
ni−1 �<br />
j=1<br />
.<br />
⎤<br />
⎥<br />
⎦<br />
eijei,j+1,<br />
where N ∗∗ = � m<br />
i=1 (ni − 1) (total # <strong>of</strong> adjacent pairs).<br />
4. Many more can be found in SAS.<br />
• S<strong>of</strong>tware: Proc Genmod in SAS<br />
Graduate Summer Session in Epidemiology Slide 149
CHAPTER 4 Epid <strong>766</strong>, D. Zhang<br />
4.1.5 Interpretation <strong>of</strong> regression coefficients in a GEE<br />
Model<br />
• A classical logistic model: y = indicator <strong>of</strong> lung cancer ∼ Bin(1, π)<br />
where<br />
XE =<br />
⎧<br />
⎨<br />
⎩<br />
logit(π) = β0 + β1XE + β2XC<br />
1 exposure = yes<br />
0 exposure = no<br />
XC =<br />
⎧<br />
⎨<br />
⎩<br />
1 confounder = yes<br />
0 confounder = no<br />
For example, XE = smoking (yes/no), XC = Age (> 50 vs. ≤ 50).<br />
Then<br />
β1 = age-adjusted log(OR) (≈ log(RR)) <strong>of</strong> lung cancer comparing the<br />
population <strong>of</strong> smokers and the population <strong>of</strong> non-smokers.<br />
Graduate Summer Session in Epidemiology Slide 150
CHAPTER 4 Epid <strong>766</strong>, D. Zhang<br />
• In general, βk in a logistic regression can be interpreted as<br />
βk = log(OR) <strong>of</strong> disease under consideration for two populations with<br />
covariate values xk + 1 and xk while other covariates are held fixed.<br />
• The regression coefficients in a GEE logistic model have the same<br />
population-averaged interpretation as those in a classical logistic<br />
model.<br />
• GEE combines information <strong>from</strong> a sample <strong>of</strong> subjects to estimate<br />
these population-averaged estimates. These will be contrasted with<br />
subject-specific regression coefficients later.<br />
Graduate Summer Session in Epidemiology Slide 151
CHAPTER 4 Epid <strong>766</strong>, D. Zhang<br />
4.1.6 Analyze Infectious disease data using GEE<br />
• <strong>Data</strong>:<br />
⋆ 275 Indonesian preschool children.<br />
⋆ Each was followed over 6 consecutive quarters.<br />
⋆ Outcome = respiratory infection (yes/no)<br />
⋆ Covariates: Xero (xerophthalmia (yes/no)), season, age, sex,<br />
height (height for age)<br />
• GEE logistic model: yij(1/0) = infection indicator ∼ Bin(1, πij),<br />
logit(πij) = β0 + β1seasonij + β2Xeroij + β3age i<br />
+β4timeij + β5sexi + β6height ij<br />
See the SAS program indon gee.sas and its output<br />
indon gee.lst for details.<br />
Graduate Summer Session in Epidemiology Slide 152
CHAPTER 4 Epid <strong>766</strong>, D. Zhang<br />
options ls=72 ps=72;<br />
SAS program: indon gee.sas<br />
/*------------------------------------------------------*/<br />
/* */<br />
/* Proc Genmod to fit population average (marginal) */<br />
/* model using GEE approach for the Indonesia children */<br />
/* infection disease data */<br />
/* */<br />
/*------------------------------------------------------*/<br />
data indon;<br />
infile "indon.dat";<br />
input id infect intercept age xero cosv sinv sex height stunted<br />
visit baseage season visitsq;<br />
time = age-baseage;<br />
run;<br />
data indon; set indon;<br />
nobs=_n_;<br />
run;<br />
title "Print the first 20 observations";<br />
proc print data=indon (obs=20);<br />
var id infect season xero age sex height visit;<br />
run;<br />
title "Model 1: Use exchangeable working correlation";<br />
proc genmod descending;<br />
class id;<br />
model infect = season xero baseage time sex height<br />
/ dist=bin link=logit;<br />
repeated subject=id / type=exch corrw;<br />
run;<br />
Graduate Summer Session in Epidemiology Slide 153
CHAPTER 4 Epid <strong>766</strong>, D. Zhang<br />
SAS output: indon gee.lst<br />
Model 1: Use exchangeable working correlation 2<br />
Class Levels Values<br />
id 275 121013 ...<br />
The GENMOD Procedure<br />
Model Information<br />
<strong>Data</strong> Set WORK.INDON<br />
Distribution Binomial<br />
Link Function Logit<br />
Dependent Variable infect<br />
Observations Used 1200<br />
Class Level Information<br />
Response Pr<strong>of</strong>ile<br />
Ordered Total<br />
Value infect Frequency<br />
1 1 107<br />
2 0 1093<br />
PROC GENMOD is modeling the probability that infect=’1’.<br />
Graduate Summer Session in Epidemiology Slide 154
CHAPTER 4 Epid <strong>766</strong>, D. Zhang<br />
Criteria For Assessing Goodness Of Fit<br />
Criterion DF Value Value/DF<br />
Deviance 1193 685.3920 0.5745<br />
Scaled Deviance 1193 694.9775 0.5825<br />
Pearson Chi-Square 1193 1176.5455 0.9862<br />
Scaled Pearson X2 1193 1193.0000 1.0000<br />
Log Likelihood -347.4888<br />
Algorithm converged.<br />
<strong>Analysis</strong> Of Initial Parameter Estimates<br />
Standard Wald 95% Chi-<br />
Parameter DF Estimate Error Confidence Limits Square Pr > ChiSq<br />
Intercept 1 -2.3572 0.3435 -3.0305 -1.6838 47.08
CHAPTER 4 Epid <strong>766</strong>, D. Zhang<br />
Algorithm converged.<br />
GEE Model Information<br />
Correlation Structure Exchangeable<br />
Subject Effect id (275 levels)<br />
Number <strong>of</strong> Clusters 275<br />
Correlation Matrix Dimension 6<br />
Maximum Cluster Size 6<br />
Minimum Cluster Size 1<br />
Working Correlation Matrix<br />
Col1 Col2 Col3 Col4 Col5 Col6<br />
Row1 1.0000 0.0462 0.0462 0.0462 0.0462 0.0462<br />
Row2 0.0462 1.0000 0.0462 0.0462 0.0462 0.0462<br />
Row3 0.0462 0.0462 1.0000 0.0462 0.0462 0.0462<br />
Row4 0.0462 0.0462 0.0462 1.0000 0.0462 0.0462<br />
Row5 0.0462 0.0462 0.0462 0.0462 1.0000 0.0462<br />
Row6 0.0462 0.0462 0.0462 0.0462 0.0462 1.0000<br />
<strong>Analysis</strong> Of GEE Parameter Estimates<br />
Empirical Standard Error Estimates<br />
Standard 95% Confidence<br />
Parameter Estimate Error Limits Z Pr > |Z|<br />
Intercept -2.3504 0.3332 -3.0036 -1.6973 -7.05
CHAPTER 4 Epid <strong>766</strong>, D. Zhang<br />
Some remarks:<br />
• Proc Genmod in SAS always fits the model using independence<br />
correlation structure to get initial parameter estimate and get the<br />
estimate <strong>of</strong> over-dispersion parameter. We should read the output<br />
under “<strong>Analysis</strong> Of GEE Parameter Estimates”, which is valid<br />
even if the correlation structure we specified (it is exchangeable<br />
here) may not be true.<br />
• Given other characteristics, the odds-ratio <strong>of</strong> getting respiratory<br />
infection between two populations with or without Vitamin A<br />
deficiency is estimated to be e 0.5525 = 1.74. If respiratory infection<br />
could be viewed as a rare disease, kids with Vitamin A deficiency<br />
would be 74% more likely to develop respiratory infection. However,<br />
p-value=0.2167 indicates that there is no significant difference in<br />
infection risk for these two populations.<br />
Graduate Summer Session in Epidemiology Slide 157
CHAPTER 4 Epid <strong>766</strong>, D. Zhang<br />
4.1.7 Analyze epileptic seizure count data using GEE<br />
• <strong>Data</strong>:<br />
⋆ 59 patients, 28 in control group, 31 in treatment (progabide)<br />
group.<br />
⋆ 5 seizure counts (including baseline) were obtained.<br />
⋆ Covariates: treatment (covariate <strong>of</strong> interest), age.<br />
• GEE Poisson model: yij =seizure counts obtained at the jth<br />
(j = 0, 1, ..., 4) time point for patient i, yij ∼ over-dispersed<br />
Poisson(µij), µij = E(yij) = tijλij, where tij is the length <strong>of</strong> time<br />
<strong>from</strong> which the seizure count yij was observed, λij is hence the rate<br />
to have a seizure. First consider model<br />
log(λij) = β0 + β1I(j > 0) + β2trti + β3trtiI(j > 0)<br />
log(µij) = log(tij) + β0 + β1I(j > 0) + β2trti + β3trtiI(j > 0)<br />
Note that log(tij) is <strong>of</strong>ten called an <strong>of</strong>fset.<br />
Graduate Summer Session in Epidemiology Slide 158
CHAPTER 4 Epid <strong>766</strong>, D. Zhang<br />
• Interpretation <strong>of</strong> β’s:<br />
log <strong>of</strong> seizure rate λ<br />
Group Before randomization After randomization<br />
Control (trt=0) β0 β0 + β1<br />
Treatment (trt=1) β0 + β2 β0 + β1 + β2 + β3<br />
Therefore, β1 = time effect, β2 = difference in seizure rates at<br />
baseline between two groups, β3 = treatment effect <strong>of</strong> interest.<br />
If randomization is taken into account (β2 = 0), we can consider the<br />
following model<br />
log(µij) = log(tij) + β0 + β1I(j > 0) + β2trtiI(j > 0)<br />
• See the SAS program seize gee.sas and its output<br />
seize gee.lst for details.<br />
Graduate Summer Session in Epidemiology Slide 159
CHAPTER 4 Epid <strong>766</strong>, D. Zhang<br />
options ls=80 ps=1000 nodate;<br />
First part <strong>of</strong> seize gee.sas<br />
/*------------------------------------------------------*/<br />
/* */<br />
/* Proc Genmod to fit population average (marginal) */<br />
/* model using GEE approach for the epileptic seizure */<br />
/* count data */<br />
/* */<br />
/*------------------------------------------------------*/<br />
data seizure;<br />
infile "seize.dat";<br />
input id seize visit trt age;<br />
nobs=_n_;<br />
interval = 2;<br />
if visit=0 then interval=8;<br />
logtime = log(interval);<br />
assign = (visit>0);<br />
run;<br />
title "Model 1: overall effect <strong>of</strong> the treatment";<br />
proc genmod data=seizure;<br />
class id;<br />
model seize = assign trt assign*trt<br />
/ dist=poisson link=log <strong>of</strong>fset=logtime;<br />
repeated subject=id / type=exch;<br />
run;<br />
Graduate Summer Session in Epidemiology Slide 160
CHAPTER 4 Epid <strong>766</strong>, D. Zhang<br />
Class Levels Values<br />
Output <strong>of</strong> the above program:<br />
Model 1: overall effect <strong>of</strong> the treatment 1<br />
id 59 101 102 ...<br />
The GENMOD Procedure<br />
Model Information<br />
<strong>Data</strong> Set WORK.SEIZURE<br />
Distribution Poisson<br />
Link Function Log<br />
Dependent Variable seize<br />
Offset Variable logtime<br />
Observations Used 295<br />
Class Level Information<br />
Criteria For Assessing Goodness Of Fit<br />
Criterion DF Value Value/DF<br />
Deviance 291 3577.8316 12.2950<br />
Scaled Deviance 291 3577.8316 12.2950<br />
Pearson Chi-Square 291 5733.4815 19.7027<br />
Scaled Pearson X2 291 5733.4815 19.7027<br />
Log Likelihood 6665.9803<br />
Algorithm converged.<br />
Graduate Summer Session in Epidemiology Slide 161
CHAPTER 4 Epid <strong>766</strong>, D. Zhang<br />
<strong>Analysis</strong> Of Initial Parameter Estimates<br />
Standard Wald 95% Chi-<br />
Parameter DF Estimate Error Confidence Limits Square Pr > ChiSq<br />
Intercept 1 1.3476 0.0341 1.2809 1.4144 1565.44 |Z|<br />
Intercept 1.3476 0.1574 1.0392 1.6560 8.56
CHAPTER 4 Epid <strong>766</strong>, D. Zhang<br />
Second part <strong>of</strong> seize gee.sas<br />
title "Model 2: take randomization into account";<br />
proc genmod data=seizure;<br />
class id;<br />
model seize = assign assign*trt<br />
/ dist=poisson link=log <strong>of</strong>fset=logtime scale=pearson aggregate=nobs;<br />
repeated subject=id / type=exch;<br />
run;<br />
Class Levels Values<br />
Output <strong>from</strong> the above program:<br />
Model 2: take randomization into account 2<br />
id 59 101 102 ...<br />
The GENMOD Procedure<br />
Model Information<br />
<strong>Data</strong> Set WORK.SEIZURE<br />
Distribution Poisson<br />
Link Function Log<br />
Dependent Variable seize<br />
Offset Variable logtime<br />
Observations Used 295<br />
Class Level Information<br />
Graduate Summer Session in Epidemiology Slide 163
CHAPTER 4 Epid <strong>766</strong>, D. Zhang<br />
Criteria For Assessing Goodness Of Fit<br />
Criterion DF Value Value/DF<br />
Deviance 292 3578.1542 12.2540<br />
Scaled Deviance 292 182.1888 0.6239<br />
Pearson Chi-Square 292 5734.8269 19.6398<br />
Scaled Pearson X2 292 292.0000 1.0000<br />
Log Likelihood 339.4033<br />
Algorithm converged.<br />
<strong>Analysis</strong> Of Initial Parameter Estimates<br />
Standard Wald 95% Chi-<br />
Parameter DF Estimate Error Confidence Limits Square Pr > ChiSq<br />
Intercept 1 1.3616 0.1033 1.1592 1.5640 173.89
CHAPTER 4 Epid <strong>766</strong>, D. Zhang<br />
Algorithm converged.<br />
GEE Model Information<br />
Correlation Structure Exchangeable<br />
Subject Effect id (59 levels)<br />
Number <strong>of</strong> Clusters 59<br />
Correlation Matrix Dimension 5<br />
Maximum Cluster Size 5<br />
Minimum Cluster Size 5<br />
<strong>Analysis</strong> Of GEE Parameter Estimates<br />
Empirical Standard Error Estimates<br />
Standard 95% Confidence<br />
Parameter Estimate Error Limits Z Pr > |Z|<br />
Intercept 1.3616 0.1111 1.1438 1.5794 12.25
CHAPTER 4 Epid <strong>766</strong>, D. Zhang<br />
A program to adjust for age<br />
title "Model 3: adjusting for other covariates (age)";<br />
proc genmod data=seizure;<br />
class id;<br />
model seize = assign trt assign*trt age<br />
/ dist=poisson link=log <strong>of</strong>fset=logtime scale=pearson;<br />
repeated subject=id / type=exch;<br />
run;<br />
Output <strong>of</strong> the program to adjust for all covariates<br />
Class Levels Values<br />
id 59 101 ...<br />
Model 3: adjusting for other covariates 3<br />
The GENMOD Procedure<br />
Model Information<br />
<strong>Data</strong> Set WORK.SEIZURE<br />
Distribution Poisson<br />
Link Function Log<br />
Dependent Variable seize<br />
Offset Variable logtime<br />
Observations Used 295<br />
Class Level Information<br />
Graduate Summer Session in Epidemiology Slide 166
CHAPTER 4 Epid <strong>766</strong>, D. Zhang<br />
Criteria For Assessing Goodness Of Fit<br />
Criterion DF Value Value/DF<br />
Deviance 290 3523.4645 12.1499<br />
Scaled Deviance 290 186.4540 0.6429<br />
Pearson Chi-Square 290 5480.1978 18.8972<br />
Scaled Pearson X2 290 290.0000 1.0000<br />
Log Likelihood 354.1875<br />
Algorithm converged.<br />
<strong>Analysis</strong> Of Initial Parameter Estimates<br />
Standard Wald 95% Chi-<br />
Parameter DF Estimate Error Confidence Limits Square Pr > ChiSq<br />
Intercept 1 1.9085 0.3614 1.2002 2.6168 27.89
CHAPTER 4 Epid <strong>766</strong>, D. Zhang<br />
Algorithm converged.<br />
GEE Model Information<br />
Correlation Structure Exchangeable<br />
Subject Effect id (59 levels)<br />
Number <strong>of</strong> Clusters 59<br />
Correlation Matrix Dimension 5<br />
Maximum Cluster Size 5<br />
Minimum Cluster Size 5<br />
<strong>Analysis</strong> Of GEE Parameter Estimates<br />
Empirical Standard Error Estimates<br />
Standard 95% Confidence<br />
Parameter Estimate Error Limits Z Pr > |Z|<br />
Intercept 2.2601 0.4330 1.4113 3.1088 5.22
CHAPTER 4 Epid <strong>766</strong>, D. Zhang<br />
4.2 Generalized linear mixed models (GLMMs)<br />
4.2.1 Model specification and implementation<br />
• Generalized linear mixed models (GLMMs) are an extension <strong>of</strong><br />
1. linear mixed models (continuous ⇒ discrete)<br />
2. logistic (Poisson) models (independent discrete data ⇒<br />
discrete longitudinal data)<br />
• Consider a special linear mixed model:<br />
yij = β0 + β1xij1 + · · · + βpxijp + bi + ǫij,<br />
where bi ∼ N(0, σ2 b ) and ǫij<br />
iid<br />
∼ N(0, σ 2 ǫ).<br />
Let µ b ij = E[yij|bi]. Then the above model is equivalent to<br />
yij|bi, xi<br />
ind<br />
∼ N(µ b ij , σ 2 ǫ),<br />
µ b ij = β0 + β1xij1 + · · · + βpxijp + bi.<br />
(4.2)<br />
Graduate Summer Session in Epidemiology Slide 169
CHAPTER 4 Epid <strong>766</strong>, D. Zhang<br />
• Extend above model (4.2) to logistic model for longitudinal binary<br />
data:<br />
yij|bi, xi<br />
ind<br />
b ∼ Binomial(1, πij (xi)),<br />
logit{π b ij (xi)} = log<br />
bi ∼ N(0, σ 2 b ),<br />
� π b ij (xi)<br />
1−π b ij (xi)<br />
�<br />
= β0 + β1xij1 + · · · + βpxijp + bi<br />
(4.3)<br />
where bi are the (normal) subject-specific random effects. This is a<br />
special GLMM (logistic-normal).<br />
• Remarks:<br />
1. In this model the correlation is modeled through random effects<br />
bi. A subject with higher bi will have higher disease probability<br />
(if other covariate values are kept the same).<br />
π b ij<br />
2. Random effects bi vary <strong>from</strong> subject to subject and are assumed<br />
to be independent. Hence the data {yij} <strong>from</strong> the same<br />
Graduate Summer Session in Epidemiology Slide 170
CHAPTER 4 Epid <strong>766</strong>, D. Zhang<br />
individuals are correlated.<br />
3. The random effects bi are usually assumed to have a normal<br />
distribution N(0, θ). The variance θ measures the<br />
between-subject variation, and also measures the strength <strong>of</strong> the<br />
correlation. If θ = 0, no correlation. When θ increases, the<br />
correlation increases.<br />
is subject-specific, so the parameters<br />
β’s in (4.3) have a subject-specific interpretation (more detail in<br />
the infectious disease example).<br />
4. The success probability π b ij<br />
5. For given x, π(x) (the success probability for the population with<br />
covariate x) can be obtained through<br />
π(x) = E[π b �<br />
(x)] = π b (x)f(b)db.<br />
Graduate Summer Session in Epidemiology Slide 171
CHAPTER 4 Epid <strong>766</strong>, D. Zhang<br />
6. Even though π b (x) has a logistic form in model (4.3), π(x) does<br />
NOT have a logistic form. In particular:<br />
logit{π(x)} �= β0 + β1x1 + · · · + βpxp.<br />
7. However, approximately we have<br />
logit{π(x)} ≈ (1+0.346θ) −1/2 ×(β0+β1x1+· · ·+βpxp). (4.4)<br />
That is, (1 + 0.346θ) −1/2 βk has a population-level interpretation<br />
in terms <strong>of</strong> log odds-ratio.<br />
Graduate Summer Session in Epidemiology Slide 172
CHAPTER 4 Epid <strong>766</strong>, D. Zhang<br />
• Extend above model (4.2) to log-linear model for longitudinal<br />
Poisson (count) data:<br />
yij|bi<br />
ind<br />
∼ Poisson(µ b ij = Tijλ b ij ),<br />
log(λ b ij ) = β0 + β1xij1 + · · · + βpxijp + bi<br />
log(µ b ij ) = log(Tij) + β0 + β1xij1 + · · · + βpxijp + bi<br />
bi ∼ N(0, σ 2 b ),<br />
(4.5)<br />
where bi are the (normal) subject-specific random effects. This is a<br />
special GLMM (Poisson-normal).<br />
• Remarks:<br />
1. In this model, the correlation is modeled through random effects<br />
bi. A subject with higher bi will have larger rate λb ij (if other<br />
covariate values are kept the same), and tend to have larger<br />
responses.<br />
2. Random effects bi vary <strong>from</strong> subject to subject and are assumed<br />
to be independent. Hence the data {yij} <strong>from</strong> the same<br />
Graduate Summer Session in Epidemiology Slide 173
CHAPTER 4 Epid <strong>766</strong>, D. Zhang<br />
individuals are correlated.<br />
3. The random effects bi are usually assumed to have a normal<br />
distribution N(0, θ). The variance θ measures the<br />
between-subject variation, and also measures the strength <strong>of</strong> the<br />
correlation. If θ = 0, no correlation. When θ increases, the<br />
correlation increases.<br />
is subject-specific, so the parameters β’s in<br />
(4.5) have a subject-specific interpretation (more detail in the<br />
Epileptic seizure count example).<br />
4. The event rate λ b ij<br />
5. There still may be overdispersion for yij|bi. That is<br />
var(yij|bi) > E(yij|bi). So we may take the over-dispersion into<br />
account by assuming<br />
var(yij|bi) = φE(yij|bi).<br />
Note: This φ is different <strong>from</strong> the φ in GEE.<br />
Graduate Summer Session in Epidemiology Slide 174
CHAPTER 4 Epid <strong>766</strong>, D. Zhang<br />
⋆ One way to account for overdispersion is to use statement<br />
random residual in Glimmix.<br />
⋆ The other way is to assume yij|bi has the following log<br />
quasi-likelihood function:<br />
ℓq(yij, µ b ij) = yij(log µ b ij − log yij) − (µ b ij<br />
φ<br />
− yij)<br />
− 1<br />
2<br />
⋆ Or to assume yij|bi has a generalized Poisson distribution:<br />
log φ.<br />
f(yij|bi) = (1 − ξ)µb ij {(1 − ξ)µb ij + ξyij} yij−1 e −(1−ξ)µ b ij −ξyij<br />
yij!<br />
In this case,<br />
E(yij|bi) = µ b ij, var(yij|bi) = µ b ij/(1 − ξ) 2 .<br />
Graduate Summer Session in Epidemiology Slide 175<br />
.
CHAPTER 4 Epid <strong>766</strong>, D. Zhang<br />
6. For given x, the population event rate λ(x) (the event rate for<br />
the population with covariate x) can be obtained through<br />
λ(x) = E[λ b (x)]<br />
= E � �<br />
β0+β1x1+···+βpxp+b<br />
e<br />
= e β0+β1x1+···+βpxp E(e b )<br />
= e β0+β1x1+···+βpxp e θ/2<br />
= e θ/2+β0+β1x1+···+βpxp<br />
= e ˜ β0+β1x1+···+βpxp<br />
=⇒<br />
log{λ(x)} = ˜ β0 + β1x1 + · · · + βpxp, (4.6)<br />
therefore, the regression coefficients β’s (except β0) in model<br />
(4.5) also have population average interpretation.<br />
Graduate Summer Session in Epidemiology Slide 176
CHAPTER 4 Epid <strong>766</strong>, D. Zhang<br />
• For a liner mixed model like the following<br />
where ǫij<br />
yij = β T xij + bi0 + ǫij,<br />
iid<br />
∼ N(0, σ 2 ǫ), we have<br />
E(yij|bi) = β T xij + bi0 and E(yij) = β T xij.<br />
So the β’s (except the intercept β0) always have population-average<br />
interpretation as well as subject-specific interpretation.<br />
Graduate Summer Session in Epidemiology Slide 177
CHAPTER 4 Epid <strong>766</strong>, D. Zhang<br />
• Why GLMMs?<br />
1. We are interested in how the outcome variable is related to the<br />
independent variables (covariates).<br />
2. We are also interested in how individuals’ data vary <strong>from</strong> subject<br />
to subject (between-subject variation). This can be modeled<br />
through the use <strong>of</strong> random effects. The random effects have a<br />
natural interpretation.<br />
3. A GLMM is a likelihood-based model. So it requires much less<br />
strong assumption for missing data mechanism. Only MAR<br />
mechanism is required for a GLMM to make valid inference,<br />
compared to MCAR for GEE approach.<br />
4. The regression coefficients have a subject-specific interpretation,<br />
and for some special GLMMs we can still (approximately) make<br />
population level inference.<br />
Graduate Summer Session in Epidemiology Slide 178
CHAPTER 4 Epid <strong>766</strong>, D. Zhang<br />
• Implementation: Proc Glimmix for GLMMs in SAS where<br />
approximate integration is used for approximate maximum<br />
quasi-likelihood estimation. Or Proc Nlmixed (non-linear mixed<br />
model) in SAS where numerical integration is used for maximum<br />
likelihood estimation.<br />
Graduate Summer Session in Epidemiology Slide 179
CHAPTER 4 Epid <strong>766</strong>, D. Zhang<br />
4.3 Analyze infectious disease data using a<br />
GLMM<br />
• Assume infection indicator yij (1 = infection, 0 = no infection):<br />
yij|bi<br />
ind<br />
∼ Binomial(1, π b ij),<br />
logit(π b ij) = β0 + β1seasonij + β2Xeroij + β3age i<br />
where bi ∼ N(0, θ).<br />
+β4timeij + β5sexi + β6height ij + bi,<br />
• Interpretation <strong>of</strong> β2 (coefficient <strong>of</strong> a time-varying covariate<br />
Xero): Let π b 1, π b 0 be the infection probability for any subject i (the<br />
same kid) when Xero is 1 and 0 (while other covariate values are<br />
fixed). Then<br />
logit(π b 1) − logit(π b 0) = β2,<br />
Graduate Summer Session in Epidemiology Slide 180
CHAPTER 4 Epid <strong>766</strong>, D. Zhang<br />
that is<br />
β2 = log<br />
� b π1/(1 − πb 1)<br />
πb 0 /(1 − πb 0 )<br />
�<br />
.<br />
That is, β2 is the log odds-ratio <strong>of</strong> getting respiratory infection if a<br />
subject becomes Vitamin A deficiency (<strong>from</strong> Vitamin A sufficiency).<br />
Similar interpretation holds for continuous time-varying covariates.<br />
• Interpretation <strong>of</strong> β5 (coefficient <strong>of</strong> a one-time covariate sex): Let<br />
π bi<br />
1<br />
be the infection probability for subject i who is a boy and πbj<br />
0 be<br />
the infection probability for subject j who is a girl. Assume they<br />
have the same covariate values (except sex). Then<br />
logit(π bi<br />
1 ) − logit(πbj 0 ) = β5 + (bi − bj).<br />
Graduate Summer Session in Epidemiology Slide 181
CHAPTER 4 Epid <strong>766</strong>, D. Zhang<br />
If bi ≈ bj, then<br />
logit(π bi<br />
1<br />
β5 ≈ log<br />
) − logit(πbj 0 ) ≈ β5,<br />
�<br />
π bi<br />
1 /(1 − πbi 1 )<br />
/(1 − πbj 0 )<br />
�<br />
.<br />
That is, β5 is the log odds-ratio <strong>of</strong> getting respiratory infection<br />
comparing a boy and a girl who are similar in other subject<br />
characteristics except gender. Similar interpretation holds for<br />
continuous one-time covariates.<br />
π bj<br />
0<br />
See the SAS program indon mix.sas and its output<br />
indon mix.lst for details.<br />
Graduate Summer Session in Epidemiology Slide 182
CHAPTER 4 Epid <strong>766</strong>, D. Zhang<br />
• Remark 1: As indicated by (4.4), (1 + 0.346θ) −1/2 β have<br />
population log odds-ratio interpretation:<br />
logit(πij) ≈ (1 + 0.346θ) −1/2 β T xij<br />
= ˜ β T xij,<br />
where ˜ β = (1 + 0.346θ) −1/2 β. Therefore, ˜ β has population-average<br />
interpretation. That is, we can use ˜ β to compare two populations.<br />
Graduate Summer Session in Epidemiology Slide 183
CHAPTER 4 Epid <strong>766</strong>, D. Zhang<br />
options ls=80 ps=1000 nodate;<br />
SAS program indon mix.sas<br />
/*------------------------------------------------------*/<br />
/* */<br />
/* Proc Glimmix to fit subject-specific (random effect) */<br />
/* model for the Indonesian children infection disease */<br />
/* data */<br />
/* */<br />
/*------------------------------------------------------*/<br />
data indon;<br />
infile "indon.dat";<br />
input id infect intercep age xero cosv sinv sex height stunted<br />
visit baseage season visitsq;<br />
time = age - baseage;<br />
run;<br />
title "Random intercept model for infection disease data";<br />
proc glimmix data=indon method=quad;<br />
class id;<br />
model infect = season xero age time sex height / dist=bin link=logit s;<br />
random int / subject=id type=vc;<br />
run;<br />
Graduate Summer Session in Epidemiology Slide 184
CHAPTER 4 Epid <strong>766</strong>, D. Zhang<br />
SAS output indon mix.lst<br />
Random intercept model for infection disease data 1<br />
The GLIMMIX Procedure<br />
Model Information<br />
<strong>Data</strong> Set WORK.INDON<br />
Response Variable infect<br />
Response Distribution Binomial<br />
Link Function Logit<br />
Variance Function Default<br />
Variance Matrix Blocked By id<br />
Estimation Technique Maximum Likelihood<br />
Likelihood Approximation Gauss-Hermite Quadrature<br />
Degrees <strong>of</strong> Freedom Method Containment<br />
Class Levels Values<br />
Class Level Information<br />
id 275 121013 121113 121114 121140 121215 121315<br />
121316 ...<br />
Number <strong>of</strong> Observations Read 1200<br />
Number <strong>of</strong> Observations Used 1200<br />
Graduate Summer Session in Epidemiology Slide 185
CHAPTER 4 Epid <strong>766</strong>, D. Zhang<br />
Dimensions<br />
G-side Cov. Parameters 1<br />
Columns in X 7<br />
Columns in Z per Subject 1<br />
Subjects (Blocks in V) 275<br />
Max Obs per Subject 6<br />
Optimization Information<br />
Optimization Technique Dual Quasi-Newton<br />
Parameters in Optimization 8<br />
Lower Boundaries 1<br />
Upper Boundaries 0<br />
Fixed Effects Not Pr<strong>of</strong>iled<br />
Starting From GLM estimates<br />
Quadrature Points 9<br />
Graduate Summer Session in Epidemiology Slide 186
CHAPTER 4 Epid <strong>766</strong>, D. Zhang<br />
Iteration History<br />
Objective Max<br />
Iteration Restarts Evaluations Function Change Gradient<br />
0 0 4 711.85214926 . 370.248<br />
1 0 4 705.17377387 6.67837539 325.4556<br />
2 0 4 701.66091706 3.51285681 63.11033<br />
3 0 2 698.22850425 3.43241282 133.8429<br />
4 0 2 694.02433064 4.20417361 29.58844<br />
5 0 4 688.64294661 5.38138403 44.45273<br />
6 0 2 684.7338452 3.90910141 36.74223<br />
7 0 3 682.76342298 1.97042222 5.605872<br />
8 0 2 680.11119418 2.65222880 49.52205<br />
9 0 3 679.63453452 0.4<strong>766</strong>5966 37.21899<br />
10 0 2 679.03086357 0.60367095 34.80307<br />
11 0 3 678.8643414 0.16652217 7.530059<br />
12 0 3 678.86037714 0.00396426 2.913637<br />
13 0 3 678.85888563 0.00149150 2.037862<br />
14 0 2 678.85638762 0.00249801 1.749602<br />
15 0 3 678.8553423 0.00104532 0.4<strong>766</strong>05<br />
16 0 3 678.85532391 0.00001839 0.072154<br />
17 0 3 678.8553228 0.00000111 0.005773<br />
Convergence criterion (GCONV=1E-8) satisfied.<br />
Fit <strong>Statistics</strong><br />
-2 Log Likelihood 678.86<br />
AIC (smaller is better) 694.86<br />
AICC (smaller is better) 694.98<br />
BIC (smaller is better) 723.79<br />
CAIC (smaller is better) 731.79<br />
HQIC (smaller is better) 706.47<br />
Graduate Summer Session in Epidemiology Slide 187
CHAPTER 4 Epid <strong>766</strong>, D. Zhang<br />
Fit <strong>Statistics</strong> for Conditional<br />
Distribution<br />
-2 log L(infect | r. effects) 579.13<br />
Pearson Chi-Square 880.70<br />
Pearson Chi-Square / DF 0.73<br />
Covariance Parameter Estimates<br />
Standard<br />
Cov Parm Subject Estimate Error<br />
Intercept id 0.7187 0.3656<br />
Solutions for Fixed Effects<br />
Standard<br />
Effect Estimate Error DF t Value Pr > |t|<br />
Intercept -2.6258 0.3892 273 -6.75
CHAPTER 4 Epid <strong>766</strong>, D. Zhang<br />
• Remark 1 (subject-specific interpretation): Since<br />
�β2 = 0.5015, so if a child becomes Vitamin A deficiency <strong>from</strong><br />
Vitamin A sufficiency, his/her odds-ratio <strong>of</strong> getting respiratory<br />
infection will be e 0.5015 = 1.65, that is, about 65% increase in risk.<br />
• Remark 2 (approximate population-average<br />
interpretation): � θ = 0.7187, so (0.346 × � θ + 1) −1/2 = 0.89. So<br />
the population-average effect <strong>of</strong> Vitamin A deficiency is<br />
0.89 × 0.5015 = 0.446. That is, given other covariates, the<br />
population <strong>of</strong> children with Vitamin A deficiency will be 56%<br />
(odds-ratio e 0.446 = 1.56 ≈ relative risk if respiratory infection can<br />
be viewed as a rare event) more likely to have respiratory infection<br />
than the population <strong>of</strong> children without Vitamin A deficiency.<br />
Graduate Summer Session in Epidemiology Slide 189
CHAPTER 4 Epid <strong>766</strong>, D. Zhang<br />
The population-average effect <strong>of</strong> sex is 0.89 × (−0.4374) = −0.39<br />
(odds-ratio = 0.65). So boys are less likely to have respiratory<br />
infection than girls. Other effects can be obtained similarly.<br />
• Remark 3: When the response yij is binary, we don’t have to<br />
worry about over-dispersion for the conditional distribution <strong>of</strong> yij|bi.<br />
Graduate Summer Session in Epidemiology Slide 190
CHAPTER 4 Epid <strong>766</strong>, D. Zhang<br />
4.4 Analyze epileptic count data using a GLMM<br />
• Assume seizure counts<br />
where<br />
λ b ij<br />
yij|bi ∼ Overdispersed − Poisson(µ b ij),<br />
µ b ij = E(yij|bi) = tijλ b ij,<br />
is the rate to have a seizure for subject i. Consider model<br />
log(λ b ij) = β0 + β1I(j > 0) + β2trtiI(j > 0) + bi<br />
log(µ b ij) = log(tij) + β0 + β1I(j > 0) + β2trtiI(j > 0) + bi,<br />
where bi ∼ N(0, θ) is a random intercept describing the<br />
between-subject variation.<br />
Graduate Summer Session in Epidemiology Slide 191
CHAPTER 4 Epid <strong>766</strong>, D. Zhang<br />
• Interpretation <strong>of</strong> β’s:<br />
log(λ b ) for random subject i<br />
Group Before randomization After randomization<br />
Control (trt=0) β0 + bi β0 + β1 + bi<br />
Treatment (trt=1) β0 + bi β0 + β1 + β2 + bi<br />
β1: difference in log <strong>of</strong> rate <strong>of</strong> seizure counts comparing after<br />
randomization and before randomization for a random subject in<br />
control group (time effect).<br />
β2: difference in log <strong>of</strong> rate <strong>of</strong> seizure counts for a treated subject<br />
compared to if he/she received a placebo (treatment effect).<br />
• For more details <strong>of</strong> the result, see SAS program seize mix.sas and<br />
its output seize mix.lst<br />
• Remark: Since here we used the Poisson GLMM with log link and<br />
a random intercept, so the regression coefficients (except the<br />
intercept) also have population-average interpretation.<br />
Graduate Summer Session in Epidemiology Slide 192
CHAPTER 4 Epid <strong>766</strong>, D. Zhang<br />
options ls=80 ps=1000 nodate;<br />
SAS program seize mix.sas<br />
/*------------------------------------------------------*/<br />
/* */<br />
/* Proc Glimmix to fit random intercept model to the */<br />
/* epileptic seizure count data */<br />
/* */<br />
/*------------------------------------------------------*/<br />
data seizure;<br />
infile "seize.dat";<br />
input id seize visit trt age;<br />
nobs=_n_;<br />
interval = 2;<br />
if visit=0 then interval=8;<br />
logtime = log(interval);<br />
assign = (visit>0);<br />
agn_trt = assign*trt;<br />
run;<br />
title "Random intercept model for seizure data with conditional overdispersion";<br />
proc glimmix data=seizure;<br />
class id;<br />
model seize = assign agn_trt / dist=poisson link=log <strong>of</strong>fset=logtime s;<br />
random int / subject=id type=vc;<br />
random _residual_; *for conditional overdispersion;<br />
run;<br />
Graduate Summer Session in Epidemiology Slide 193
CHAPTER 4 Epid <strong>766</strong>, D. Zhang<br />
SAS output seize mix.lst<br />
Random intercept model for seizure data with conditional overdispersion 1<br />
The GLIMMIX Procedure<br />
Model Information<br />
<strong>Data</strong> Set WORK.SEIZURE<br />
Response Variable seize<br />
Response Distribution Poisson<br />
Link Function Log<br />
Variance Function Default<br />
Offset Variable logtime<br />
Variance Matrix Blocked By id<br />
Estimation Technique Residual PL<br />
Degrees <strong>of</strong> Freedom Method Containment<br />
Class Levels Values<br />
Class Level Information<br />
id 59 101 102 103 104 106 107 108 110 111 112 113<br />
114 ...<br />
Number <strong>of</strong> Observations Read 295<br />
Number <strong>of</strong> Observations Used 295<br />
Graduate Summer Session in Epidemiology Slide 194
CHAPTER 4 Epid <strong>766</strong>, D. Zhang<br />
Dimensions<br />
G-side Cov. Parameters 1<br />
R-side Cov. Parameters 1<br />
Columns in X 3<br />
Columns in Z per Subject 1<br />
Subjects (Blocks in V) 59<br />
Max Obs per Subject 5<br />
Optimization Information<br />
Optimization Technique Dual Quasi-Newton<br />
Parameters in Optimization 1<br />
Lower Boundaries 1<br />
Upper Boundaries 0<br />
Fixed Effects Pr<strong>of</strong>iled<br />
Residual Variance Pr<strong>of</strong>iled<br />
Starting From <strong>Data</strong><br />
Iteration History<br />
Objective Max<br />
Iteration Restarts Subiterations Function Change Gradient<br />
0 0 4 609.19264304 0.49414053 0.000205<br />
1 0 5 671.59595217 0.14411653 3.061E-6<br />
2 0 3 675.96769701 0.01612221 0.000016<br />
3 0 2 675.86073055 0.00032842 1.901E-8<br />
4 0 1 675.85749753 0.00000336 3.111E-8<br />
5 0 0 675.85746125 0.00000000 5.906E-6<br />
Convergence criterion (PCONV=1.11022E-8) satisfied.<br />
Graduate Summer Session in Epidemiology Slide 195
CHAPTER 4 Epid <strong>766</strong>, D. Zhang<br />
Fit <strong>Statistics</strong><br />
-2 Res Log Pseudo-Likelihood 675.86<br />
Generalized Chi-Square 822.08<br />
Gener. Chi-Square / DF 2.82<br />
Covariance Parameter Estimates<br />
Standard<br />
Cov Parm Subject Estimate Error<br />
Intercept id 0.5704 0.1169<br />
Residual (VC) 2.8154 0.2591<br />
Solutions for Fixed Effects<br />
Standard<br />
Effect Estimate Error DF t Value Pr > |t|<br />
Intercept 1.0655 0.1079 58 9.88
CHAPTER 4 Epid <strong>766</strong>, D. Zhang<br />
• Remark: There is considerable amount <strong>of</strong> over-dispersion for<br />
yij|bi. It is estimated that<br />
var(yij|bi) = 2.82E(yij|bi).<br />
• There is considerable between-patient variance in log-seizure rate.<br />
That variation is estimated to be 0.57.<br />
• The regression coefficient estimates (except the intercept) have<br />
population-average interpretation except the intercept, and they are<br />
almost the same as those <strong>from</strong> the GEE model.<br />
For example, � β2 = −0.1063 with SE = 0.1054. Then if a subject<br />
switches <strong>from</strong> control to treatment, the rate <strong>of</strong> having seizure will<br />
decrease by 10% (since e −0.1063 = 0.9). The same rate deduction<br />
can also be used to compare treatment and control groups (i.e.,<br />
population interpretation).<br />
Graduate Summer Session in Epidemiology Slide 197
CHAPTER 4 Epid <strong>766</strong>, D. Zhang<br />
• If we would like to fit the data using the conditional quasi-likelihood<br />
approach, we need to use Proc Nlmixed:<br />
proc nlmixed qpoints=15;<br />
parms beta0=-1.4 beta1=0.12 beta2=-0.12 theta=0.1 phi=1;<br />
eta = beta0 + beta1*assign + beta2*agn_trt + b;<br />
mu = interval*exp(eta);<br />
if seize=0 then<br />
l = -(mu - seize)/phi - log(phi)/2;<br />
else<br />
l = (seize*(log(mu) - log(seize)) - (mu - seize))/phi - log(phi)/2;<br />
model seize ~ general(l);<br />
random b ~ normal(0, theta) subject=id;<br />
run;<br />
Graduate Summer Session in Epidemiology Slide 198
CHAPTER 4 Epid <strong>766</strong>, D. Zhang<br />
The relevent output is<br />
Parameter Estimates<br />
Standard<br />
Parameter Estimate Error DF t Value Pr > |t| Alpha Lower<br />
beta0 1.0350 0.1100 58 9.41
CHAPTER 4 Epid <strong>766</strong>, D. Zhang<br />
• If we would like to fit a generalized Poisson distribution for the<br />
conditional distribution, we can use the following Proc Nlmixed<br />
program<br />
proc nlmixed; * qpoints=15;<br />
parms beta0=-1.4 beta1=0.12 beta2=-0.12 theta=0.1 xi=0.5;<br />
bound theta>0, xi>-1, xi
CHAPTER 4 Epid <strong>766</strong>, D. Zhang<br />
The relevant output is<br />
Parameter Estimates<br />
Standard<br />
Parameter Estimate Error DF t Value Pr > |t| Alpha Lower<br />
beta0 1.0635 0.1061 58 10.02
CHAPTER 5 Epid <strong>766</strong>, D. Zhang<br />
5 Summary: what we covered<br />
1. Advantages <strong>of</strong> longitudinal studies over other classical studies.<br />
2. Challenge in analyzing data <strong>from</strong> longitudinal studies: correlation,<br />
within-subject and between-subject variation.<br />
3. Linear mixed models for analyzing continuous longitudinal data:<br />
random effects are explicitly used to model the between-subject<br />
variation.<br />
4. Generalized estimating equations (GEEs) for analyzing discrete<br />
longitudinal data when the correlation is not <strong>of</strong> major interest.<br />
Population-average interpretation.<br />
5. Generalized linear mixed model for analyzing discrete longitudinal<br />
data where random effects are used to model the correlation.<br />
Subject-specific interpretation.<br />
Graduate Summer Session in Epidemiology Slide 202