The 2012 Channel Preference Survey (PDF) - Prisa Digital
The 2012 Channel Preference Survey (PDF) - Prisa Digital
The 2012 Channel Preference Survey (PDF) - Prisa Digital

Create successful ePaper yourself
Turn your PDF publications into a flip-book with our unique Google optimized e-Paper software.
4.<br />
2.1<br />
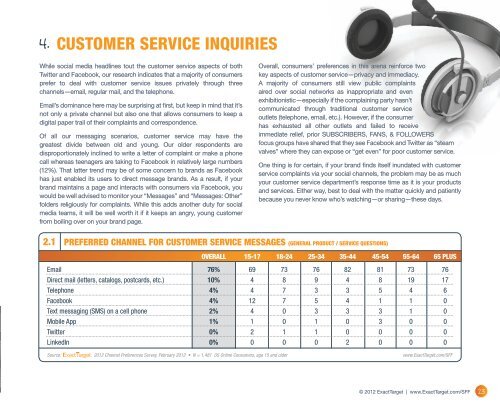
CUSTOMER SERvICE INQUIRIES<br />
While social media headlines tout the customer service aspects of both<br />
Twitter and Facebook, our research indicates that a majority of consumers<br />
prefer to deal with customer service issues privately through three<br />
channels—email, regular mail, and the telephone.<br />
Email’s dominance here may be surprising at first, but keep in mind that it’s<br />
not only a private channel but also one that allows consumers to keep a<br />
digital paper trail of their complaints and correspondence.<br />
Of all our messaging scenarios, customer service may have the<br />
greatest divide between old and young. Our older respondents are<br />
disproportionately inclined to write a letter of complaint or make a phone<br />
call whereas teenagers are taking to Facebook in relatively large numbers<br />
(12%). That latter trend may be of some concern to brands as Facebook<br />
has just enabled its users to direct message brands. As a result, if your<br />
brand maintains a page and interacts with consumers via Facebook, you<br />
would be well advised to monitor your “Messages” and “Messages: Other”<br />
folders religiously for complaints. While this adds another duty for social<br />
media teams, it will be well worth it if it keeps an angry, young customer<br />
from boiling over on your brand page.<br />
Overall, consumers’ preferences in this arena reinforce two<br />
key aspects of customer service—privacy and immediacy.<br />
A majority of consumers still view public complaints<br />
aired over social networks as inappropriate and even<br />
exhibitionistic—especially if the complaining party hasn’t<br />
communicated through traditional customer service<br />
outlets (telephone, email, etc.). However, if the consumer<br />
has exhausted all other outlets and failed to receive<br />
immediate relief, prior SUBSCRIBERS, FANS, & FOLLOWERS<br />
focus groups have shared that they see Facebook and Twitter as “steam<br />
valves” where they can expose or “get even” for poor customer service.<br />
One thing is for certain, if your brand finds itself inundated with customer<br />
service complaints via your social channels, the problem may be as much<br />
your customer service department’s response time as it is your products<br />
and services. Either way, best to deal with the matter quickly and patiently<br />
because you never know who’s watching—or sharing—these days.<br />
PREFERRED CHANNEL FOR CUSTOMER SERVICE MESSAGES (GENERAL PRODUCT / SERVICE QUESTIONS)<br />
OVERALL 15-17 18-24 25-34 35-44 45-54 55-64 65 PLUS<br />
Email 76% 69 73 76 82 81 73 76<br />
Direct mail (letters, catalogs, postcards, etc.) 10% 4 8 9 4 8 19 17<br />
Telephone 4% 4 7 3 3 5 4 6<br />
Facebook 4% 12 7 5 4 1 1 0<br />
Text messaging (sMs) on a cell phone 2% 4 0 3 3 3 1 0<br />
Mobile app 1% 1 0 1 0 3 0 0<br />
Twitter 0% 2 1 1 0 0 0 0<br />
linkedIn 0% 0 0 0 2 0 0 0<br />
Source: <strong>2012</strong> <strong>Channel</strong> <strong>Preference</strong>s <strong>Survey</strong>, February <strong>2012</strong> • N = 1,481 US Online Consumers, age 15 and older www.ExactTarget.com/SFF<br />
© <strong>2012</strong> ExactTarget | www.ExactTarget.com/SFF<br />
23