Cordlife Group Ltd - Phillip Securities Pte Ltd
Cordlife Group Ltd - Phillip Securities Pte Ltd
Cordlife Group Ltd - Phillip Securities Pte Ltd

You also want an ePaper? Increase the reach of your titles
YUMPU automatically turns print PDFs into web optimized ePapers that Google loves.
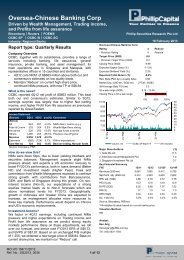
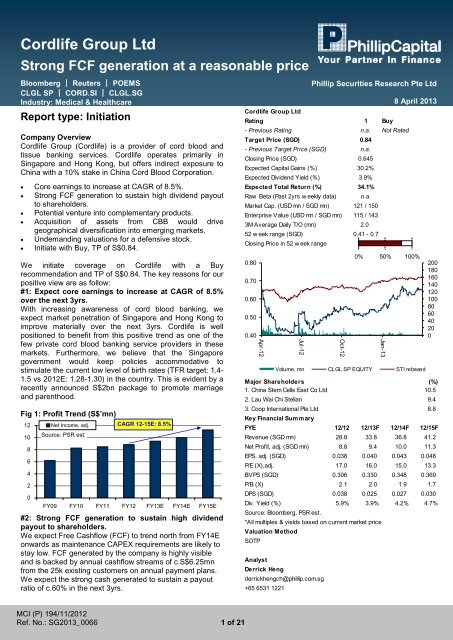
<strong>Cordlife</strong> <strong>Group</strong> <strong>Ltd</strong><br />
Strong FCF generation at a reasonable price<br />
Bloomberg │ Reuters │ POEMS<br />
CLGL SP │ CORD.SI │ CLGL.SG<br />
Industry: Medical & Healthcare<br />
Report type: Initiation<br />
Company Overview<br />
<strong>Cordlife</strong> <strong>Group</strong> (<strong>Cordlife</strong>) is a provider of cord blood and<br />
tissue banking services. <strong>Cordlife</strong> operates primarily in<br />
Singapore and Hong Kong, but offers indirect exposure to<br />
China with a 10% stake in China Cord Blood Corporation.<br />
Core earnings to increase at CAGR of 8.5%.<br />
Strong FCF generation to sustain high dividend payout<br />
to shareholders.<br />
Potential venture into complementary products.<br />
Acquisition of assets from CBB would drive<br />
geographical diversification into emerging markets.<br />
Undemanding valuations for a defensive stock.<br />
Initiate with Buy, TP of S$0.84.<br />
We initiate coverage on <strong>Cordlife</strong> with a Buy<br />
recommendation and TP of S$0.84. The key reasons for our<br />
positive view are as follow:<br />
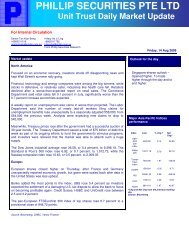
#1: Expect core earnings to increase at CAGR of 8.5%<br />
over the next 3yrs.<br />
With increasing awareness of cord blood banking, we<br />
expect market penetration of Singapore and Hong Kong to<br />
improve materially over the next 3yrs. <strong>Cordlife</strong> is well<br />
positioned to benefit from this positive trend as one of the<br />
few private cord blood banking service providers in these<br />
markets. Furthermore, we believe that the Singapore<br />
government would keep policies accommodative to<br />
stimulate the current low level of birth rates (TFR target: 1.4-<br />
1.5 vs 2012E: 1.28-1.30) in the country. This is evident by a<br />
recently announced S$2bn package to promote marriage<br />
and parenthood.<br />
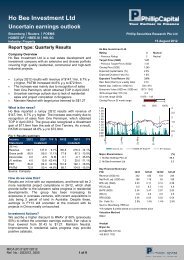
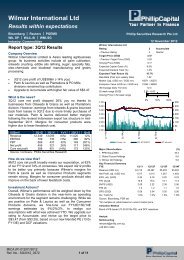
Fig 1: Profit Trend (S$’mn)<br />
12<br />
10<br />
8<br />
6<br />
4<br />
2<br />
0<br />
Net Income, adj.<br />
Source: PSR est.<br />
CAGR 12-15E: 8.5%<br />
FY09 FY10 FY11 FY12 FY13E FY14E FY15E<br />
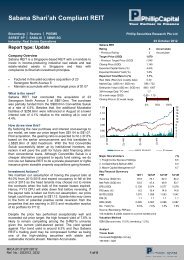
#2: Strong FCF generation to sustain high dividend<br />
payout to shareholders.<br />
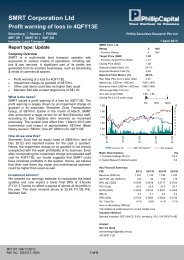
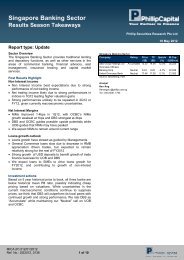
We expect Free Cashflow (FCF) to trend north from FY14E<br />
onwards as maintenance CAPEX requirements are likely to<br />
stay low. FCF generated by the company is highly visible<br />
and is backed by annual cashflow streams of c.S$6.25mn<br />
from the 25k existing customers on annual payment plans.<br />
We expect the strong cash generated to sustain a payout<br />
ratio of c.60% in the next 3yrs.<br />
MCI (P) 194/11/2012<br />
Ref. No.: SG2013_0066 1 of 21<br />
<strong>Cordlife</strong> <strong>Group</strong> <strong>Ltd</strong><br />
Raw Beta (Past 2yrs w eekly data) n.a.<br />
<strong>Phillip</strong> <strong>Securities</strong> Research <strong>Pte</strong> <strong>Ltd</strong><br />
Rating 1 Buy<br />
- Previous Rating n.a. Not Rated<br />
Target Price (SGD) 0.84<br />
- Previous Target Price (SGD) n.a.<br />
Closing Price (SGD) 0.645<br />
Expected Capital Gains (%) 30.2%<br />
Expected Dividend Yield (%) 3.9%<br />
Expected Total Return (%) 34.1%<br />
Market Cap. (USD mn / SGD mn) 121 / 150<br />
Enterprise Value (USD mn / SGD mn) 115 / 143<br />
3M Average Daily T/O (mn) 2.0<br />
52 w eek range (SGD) 0.41 - 0.7<br />
Closing Price in 52 w eek range<br />
0.80<br />
0.70<br />
0.60<br />
0.50<br />
0.40<br />
Apr-12<br />
8 April 2013<br />
Major Shareholders (%)<br />
1. China Stem Cells East Co <strong>Ltd</strong><br />
10.5<br />
2. Lau Wai Chi Stellan<br />
Jul-12<br />
Oct-12<br />
0% 50% 100%<br />
200<br />
180<br />
160<br />
140<br />
120<br />
100<br />
80<br />
60<br />
40<br />
20<br />
0<br />
3. Coop International <strong>Pte</strong> <strong>Ltd</strong> 8.8<br />
Jan-13<br />
Volume, mn CLGL SP EQUITY STI rebased<br />
Key Financial Summary<br />
FYE 12/12 12/13F 12/14F 12/15F<br />
Revenue (SGD mn) 28.8 33.8 36.8 41.2<br />
Net Profit, adj. (SGD mn) 8.8 9.4 10.0 11.3<br />
EPS, adj. (SGD) 0.038 0.040 0.043 0.048<br />
P/E (X),adj. 17.0 16.0 15.0 13.3<br />
BVPS (SGD) 0.306 0.330 0.348 0.369<br />
P/B (X) 2.1 2.0 1.9 1.7<br />
DPS (SGD) 0.038 0.025 0.027 0.030<br />
Div. Yield (%) 5.9% 3.9% 4.2% 4.7%<br />
Source: Bloomberg, PSR est.<br />
*All multiples & yields based on current market price<br />
Valuation Method<br />
SOTP<br />
Analyst<br />
Derrick Heng<br />
derrickhengch@phillip.com.sg<br />
+65 6531 1221<br />
9.4
<strong>Cordlife</strong> <strong>Group</strong> <strong>Ltd</strong><br />
Singapore Equities Research<br />
8 April 2013<br />
Fig 2: Free Cashflow (S$’mn)<br />
8<br />
7<br />
6<br />
5<br />
4<br />
3<br />
2<br />
1<br />
0<br />
Free Cashflow<br />
Source: PSR est.<br />
FY09 FY10 FY11 FY12 FY13E FY14E FY15E<br />
#3: Potential venture into complementary products.<br />
<strong>Cordlife</strong> announced a strategic alliance with Cordlabs Asia<br />
to offer umbilical cord tissue banking services beyond its<br />
current market in Hong Kong. The alliance would allow<br />
<strong>Cordlife</strong> to provide the services in India, Indonesia, Malaysia,<br />
Philippines, Singapore and Hong Kong on an exclusive<br />
basis and in Thailand on a non-exclusive basis. We believe<br />
that this alliance would leverage on the company’s existing<br />
network and open up new growth markets for the group.<br />
#4: Acquisition of assets from CBB would drive<br />
geographical diversification into emerging markets.<br />
<strong>Cordlife</strong> has a Right of First Refusal (ROFR) for the<br />
acquisition of various operating assets in Philippines,<br />
Indonesia & India from <strong>Cordlife</strong> <strong>Ltd</strong> (CBB), the Australia<br />
listed entity that owned <strong>Cordlife</strong> <strong>Group</strong> prior to its demerger<br />
in June 2011, should the company decide to divest.<br />
Acquisition of these entities would provide <strong>Cordlife</strong> with<br />
geographical diversification into emerging markets that have<br />
higher birth rates and lower market penetration. The recent<br />
results of CBB suggest that its operations in the emerging<br />
markets could start turning profitable soon. As long as they<br />
do not overpay for these emerging assets, we view any<br />
potential acquisition as a positive catalyst for the stock.<br />
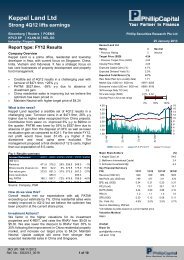
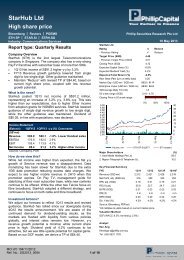
#5: Undemanding valuations for a defensive stock.<br />
Lastly, we find the valuations for the stock of <strong>Cordlife</strong> as<br />
undemanding on various matrices. Despite the defensive<br />
nature of its business, the stock of <strong>Cordlife</strong> trades at a<br />
forward P/E of only 15X. Adjusting for the cash, liquid<br />
investments and market value of <strong>Cordlife</strong>’s stake in China<br />
Cord Blood Banking Corp, the core business of the company<br />
would offer a market leading FCF yield of c.7% in FY14E<br />
and beyond. With the stock trading at our bear case<br />
valuation level, we see limited downside at this entry point.<br />
2 of 21<br />
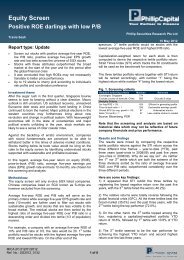
Fig 3: Forward P/E of 15X<br />
20<br />
18<br />
16<br />
14<br />
12<br />
10<br />
Feb-12<br />
Mar-12<br />
Apr-12<br />
Forward P/E (X)<br />
May-12<br />
Jun-12<br />
Fig 4: High levels of FCF yield (%)<br />
10%<br />
8%<br />
6%<br />
4%<br />
2%<br />
0%<br />
Adjusted FCF yield (%)<br />
Source: PSR est.<br />
3.5%<br />
Jul-12<br />
Aug-12<br />
4.0%<br />
Sep-12<br />
Oct-12<br />
Nov-12<br />
Dec-12<br />
7.0%<br />
Source: Bloomberg, PSR<br />
Jan-13<br />
Feb-13<br />
Mar-13<br />
15.2<br />
Apr-13<br />
7.6%<br />
FY12 FY13E FY14E FY15E<br />
May-13<br />
Jun-13
<strong>Cordlife</strong> <strong>Group</strong> <strong>Ltd</strong><br />
Singapore Equities Research<br />
8 April 2013<br />
Financial Summary<br />
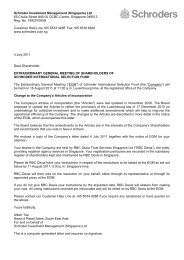
Deeper market penetration in Singapore to drive<br />
revenue growth<br />
After building in increased client deliveries from deeper<br />
market penetration in Singapore, we expect revenue to<br />
increase by 13% p.a. till FY15E. Our revenue growth<br />
forecasts are conservative and already lower than the 18%<br />
y-y revenue growth in 1HFY13 that is driven by 550 more<br />
deliveries.<br />
Hong Kong market to contract, mitigated by price hikes<br />
We expect <strong>Cordlife</strong>’s business in Hong Kong to contract in<br />
CY13 due to the negative impact of policy restrictions on<br />
deliveries by mainland women in Hong Kong. While the<br />
policy measures are negative for <strong>Cordlife</strong>, we opine that the<br />
impact would be softened by a price hike of c.7-9% (PSR<br />
est.) over the past yr. As its business in Singapore had been<br />
the main earnings driver, we believe that the impact of a<br />
contraction in the Hong Kong would not be material to the<br />
group.<br />
Fig 5: Forecasting CAGR growth of 13% to FY13E<br />
45<br />
40<br />
35<br />
30<br />
25<br />
20<br />
15<br />
10<br />
5<br />
0<br />
Revenue CAGR 12-15E: 13%<br />
Source: PSR est.<br />
FY09 FY10 FY11 FY12 FY13E FY14E FY15E<br />
Cost components<br />
We estimate that 35% of the company’s cost structure is in<br />
items that are variable in nature (mainly expenses<br />
associated with the conduct of the procedure). As the<br />
company had effectively locked in longer term overheads<br />
after moving into the new facility in Yishun, we expect<br />
administrative expenses to stabilize at S$8-10mn p.a. in the<br />
next 3yrs. While marketing expenses could continue<br />
trending higher, we believe that it should stabilize at c.23%<br />
of sales.<br />
Fig 6: Cost Structure<br />
Cost of Sales<br />
35%<br />
Source: PSR est.<br />
Selling and<br />
marketing<br />
expenses<br />
28%<br />
Administrative<br />
expenses<br />
37%<br />
3 of 21<br />
EBITDA margins to expand on better product mix and<br />
economies of scale<br />
EBITDA margins have contracted over the past 4 yrs as the<br />
company stepped up its marketing efforts and incurred<br />
higher variable costs to comply with a change in the AABB<br />
(an association involved in the field of transfusion medicine<br />
and cellular therapies, formerly known as American<br />
Association of Blood Banks) standards. However, we expect<br />
profitability to improve over the next 3yrs due to economies<br />
of scale and bigger contributions from the higher margin<br />
business in Singapore.<br />
Fig 7: Margins should expand on economies of scale<br />
14<br />
12<br />
10<br />
8<br />
6<br />
4<br />
2<br />
0<br />
Source: PSR est.<br />
EBITDA<br />
EBITDA margin (%)<br />
FY09 FY10 FY11 FY12 FY13E FY14E FY15E<br />
38%<br />
36%<br />
34%<br />
32%<br />
30%<br />
28%<br />
26%<br />
Profit contribution by geography<br />
After stripping out contributions from its mainland associates,<br />
<strong>Cordlife</strong>’s business in North Asia (mainly Hong Kong) had<br />
not been a meaningful profit contributor. South Asia (mainly<br />
from Singapore) remains a key profit driver with PBT<br />
contributions of c.S$7-9mn a year. With positive underlying<br />
business trends, we believe that its operations in South Asia<br />
will continue to be a driver of profits for the group.<br />
Fig 8: Revenue by geography (S$’mn)<br />
30<br />
25<br />
20<br />
15<br />
10<br />
5<br />
0<br />
South Asia<br />
North Asia<br />
16.9<br />
5.7<br />
20.3<br />
Source: <strong>Cordlife</strong><br />
19.2<br />
21.7<br />
7.9 6.5 7.1<br />
FY09 FY10 FY11 FY12<br />
Fig 9: Profit by geography (S$’mn)<br />
12<br />
10<br />
8<br />
6<br />
4<br />
2<br />
0<br />
(2)<br />
Source: <strong>Cordlife</strong>, PSR est.<br />
6.9<br />
9.0<br />
0.8 0.2<br />
8.3 7.5<br />
(0.1)<br />
South Asia<br />
North Asia<br />
(0.0)<br />
FY09 FY10 FY11 FY12<br />
*Profit contributions adjusted to remove contributions from<br />
associates and added IPO expenses to South Asia for FY12.
<strong>Cordlife</strong> <strong>Group</strong> <strong>Ltd</strong><br />
Singapore Equities Research<br />
8 April 2013<br />
Stable FCF to sustain dividend payout to shareholders<br />
We expect CAPEX to decline significantly in FY14E onwards<br />
as we estimate that its existing facilities in Singapore &<br />
Hong Kong would only have a blended utilization of 10% by<br />
the end of FY15E (based on facility space). Consequently,<br />
we have forecasted increasing Free Cashflows (FCF) of<br />
more than S$7mn/yr from FY14E onwards. FCF generated<br />
by the company is highly visible and is backed by annual<br />
cashflow streams of c.S$6.25mn from the 25k existing<br />
customers on annual payment plans. Furthermore, we<br />
expect recurring income stream to grow over time as the<br />
number of units stored at the company increases. Hence,<br />
we explicitly modeled in payout ratios of c.60% till FY15E,<br />
which would use up c.S$6mn/yr of cash inflow (c.80% of<br />
FCF). Our payout ratio assumption of 60% is higher than<br />
management guidance of at least 25% in its IPO prospectus<br />
as we believe that the strong cash generation and low<br />
gearing of its balance sheet should allow them to sustain a<br />
higher level of payout to shareholders.<br />
Fig 10: FCF to sustain at >S$8mn/yr after FY15E<br />
10<br />
8<br />
6<br />
4<br />
2<br />
0<br />
(2)<br />
(4)<br />
(6)<br />
Source: PSR est.<br />
FY09 FY10 FY11 FY12 FY13E FY14E FY15E<br />
Fig 11: DPS (S$)<br />
0.050<br />
0.040<br />
0.030<br />
0.020<br />
0.010<br />
0.000<br />
CFO CAPEX, net FCF<br />
100%<br />
DPS Payout Ratio (%)<br />
Source: PSR est.<br />
62% 63% 62%<br />
0.038 0.025 0.027 0.030<br />
FY12 FY13E FY14E FY15E<br />
120%<br />
100%<br />
80%<br />
60%<br />
40%<br />
20%<br />
0%<br />
4 of 21
<strong>Cordlife</strong> <strong>Group</strong> <strong>Ltd</strong><br />
Singapore Equities Research<br />
8 April 2013<br />
Valuation<br />
With strong cash generation from its matured business units,<br />
we believe that it is most appropriate to value the core<br />
business using a DCF approach. <strong>Cordlife</strong> also holds a<br />
significant 10% stake in China Cord Blood Corp that forms<br />
c.13% of our valuation of the stock. Due to its unique<br />
business model, we opine that <strong>Cordlife</strong> is not comparable to<br />
other healthcare stocks listed on the SGX on a relative<br />
valuation basis. As the cord blood banking business is highly<br />
dependent on local market conditions, we believe that<br />
comparing companies that operate in different countries is<br />
far from meaningful. There are no comparable global peers<br />
that operate in similar geography to <strong>Cordlife</strong>.<br />
Fig 12: 34% upside to our target price of S$0.84<br />
Sum of the parts Value Percent Per shr Remarks<br />
(Base case valuation) S$'mn S$<br />
Core Value of Company, DCF 145.3 74% 0.62 DCF (WACC: 9.0%, terminal g: 1%)<br />
Stake in China Cord Blood Corp. 26.2 13% 0.11 Market Value (US$2.87/shr)<br />
Enterprise Value 171.6 88% 0.74 Basis: FY14E<br />
Add: Investments 19.9 10% 0.09<br />
Add: Cash 10.1 5% 0.04<br />
Less: Debt (5.5) -3% (0.02)<br />
Equity Value 196.0 100% 0.84<br />
Outstanding no. of shares ('mn) 232.7<br />
Target Price (S$') 0.84<br />
Current Market Price (S$) 0.645<br />
F12M DPS (S$) 0.025<br />
Price upside (%) 30.2%<br />
Dividend yield (%) 3.9%<br />
Total return (%)<br />
Source: PSR est.<br />
34.1%<br />
Undemanding at P/E of 15X<br />
Given the defensive nature and positive growth outlook, we<br />
believe that the current P/E multiple of 15X undervalues the<br />
stock of <strong>Cordlife</strong>. Furthermore, the company has a very<br />
visible stream of future cashflows from its long term<br />
contracts with customers. At our target price of S$0.84, the<br />
stock would trade at a FY14/15E P/E of 19.6/17.4X<br />
respectively.<br />
Fig 13: Forward P/E of 15X<br />
20<br />
18<br />
16<br />
14<br />
12<br />
10<br />
Feb-12<br />
Mar-12<br />
Apr-12<br />
Forward P/E (X)<br />
May-12<br />
Jun-12<br />
Jul-12<br />
Aug-12<br />
Sep-12<br />
Oct-12<br />
Nov-12<br />
Dec-12<br />
Source: Bloomberg, PSR<br />
Jan-13<br />
Feb-13<br />
Mar-13<br />
15.2<br />
Apr-13<br />
May-13<br />
Jun-13<br />
5 of 21
<strong>Cordlife</strong> <strong>Group</strong> <strong>Ltd</strong><br />
Singapore Equities Research<br />
8 April 2013<br />
SWOT Analysis<br />
Strength<br />
Brand awareness and goodwill in matured market<br />
With significant operating history in Singapore and Hong<br />
Kong, we believe that <strong>Cordlife</strong> has a well established brand<br />
name in these core markets. Marketing efforts over the<br />
years have led to strong brand recognition and significant<br />
amount of goodwill in the countries.<br />
Strong cash generative business<br />
After incurring significant CAPEX from moving into its new<br />
facility in Yishun, we expect minimal CAPEX needs for its<br />
business in Singapore over the next few years. Hence, we<br />
expect high levels of free cashflows to be generated by its<br />
business in Singapore, which should allow <strong>Cordlife</strong> to<br />
provide a stable stream of dividends to shareholders and<br />
supply the cash for investments into other areas of growth.<br />
Opportunities<br />
Leveraging on rich database of client information<br />
With its existing pool of cord blood under storage, <strong>Cordlife</strong><br />
holds a rich database of client information. Hence, we<br />
believe that the company would be able to engage them as<br />
repeat customers for their subsequent babies or offer<br />
complementary products to them in the future.<br />
Expansion into emerging markets<br />
If <strong>Cordlife</strong> successfully acquires the operating assets from<br />
CBB, the company would be able to gain an exposure to the<br />
fast growing emerging markets. These emerging markets<br />
have lower levels of penetration and higher birth rates.<br />
Umbilical cord tissue banking<br />
Currently, <strong>Cordlife</strong> only offers umbilical cord tissue banking<br />
services in Hong Kong. However, the company recently<br />
announced a partnership with Cordlab Asia to offer umbilical<br />
cord banking services in Singapore, Hong Kong, Malaysia,<br />
Indonesia, Philippines and India on an exclusive basis and<br />
in Thailand on a non-exclusive basis. If successfully<br />
executed, this new business would open up a new source of<br />
income for the group.<br />
Revenue streams beyond existing contractual period<br />
Existing contracts for cord blood banking are for 21yrs and<br />
18yrs in Singapore and Hong Kong respectively. Hence, we<br />
believe that upon contract expiry, there is the opportunity for<br />
contract renewal with the children of its existing clients.<br />
6 of 21<br />
Weakness<br />
Key markets have been experiencing low fertility rates<br />
As discussed below, the core markets of Singapore and<br />
Hong Kong had been experiencing fairly low fertility rates.<br />
Hence, growth in market size would likely be limited if this<br />
trend continues.<br />
Dependent on discretionary spending<br />
While there are merits associated with storing one’s cord<br />
blood, cord blood banking remains a discretionary form of<br />
spending. Hence, we expect the market size to shrink in<br />
times of weak economic conditions, when discretionary<br />
spending is scaled back.<br />
Threats<br />
Threat of substitute from public cord blood banks<br />
Cord blood units from public banks could be used for<br />
treatment as well. We believe that a significant increase in<br />
funding to administer public banks would increase the<br />
availability of samples and reduce the need for private<br />
storage of cord blood.<br />
Obsolescence of cord blood as a source of stem cells<br />
The cord blood banking business exists as cord blood is a<br />
rich source of stem cells. However, if advances in medical<br />
technology allow alternatives to develop, the business model<br />
could be under threat.<br />
Entrance of new players<br />
There are currently very few players providing private cord<br />
blood banking services in the countries that <strong>Cordlife</strong><br />
operates in. Hence, competition is less aggressive in the<br />
oligopolistic market structure. Entrance of new players could<br />
disrupt the competitive landscape.
<strong>Cordlife</strong> <strong>Group</strong> <strong>Ltd</strong><br />
Singapore Equities Research<br />
8 April 2013<br />
Porter’s Five Forces<br />
On the whole, we believe that <strong>Cordlife</strong> has a fairly strong<br />
competitive business position. While supplier power is<br />
generally strong as <strong>Cordlife</strong> is a price taker of fees charged<br />
by hospitals and doctors, we believe that the company has<br />
the ability to pass on any price hikes to its customers. Entry<br />
barriers are fairly high as marketing efforts over the years<br />
have built significant amount of goodwill and brand<br />
recognition in the core markets. We believe that this makes<br />
it prohibitively costly for new entrants to penetrate their<br />
markets.<br />
7 of 21
<strong>Cordlife</strong> <strong>Group</strong> <strong>Ltd</strong><br />
Singapore Equities Research<br />
8 April 2013<br />
Board of Directors and Senior Management<br />
Name Position Remarks<br />
Board of Directors<br />
Dr. Ho Choon Hou Chairman, Non-Executive<br />
Director<br />
- Appointed in June 2011.<br />
- Director at Southern Capital <strong>Group</strong> <strong>Ltd</strong>, Private Equity Firm.<br />
- Bachelor of Medicine & Bachelor of Surgery (The University of<br />
Sheffield), Masters in Medicine (Surgery) (National University of<br />
Singapore), MBA (Honours) (The University of Chicago)<br />
Ms. Jin Lu Non-Executive Director - Appointed in July 2011.<br />
- Executive Director of Golden Meditech Holdings (2000-2012)<br />
- Bachelor in Foreign Language (Beijing International Studies University),<br />
Executive MBA (Peking University).<br />
Mr. Ho Sheng Lead Independent Director - Appointed in July 2011.<br />
- Partner at Banamai Capital.<br />
- Bachelor of Economics (University of Tasmania), Master of Applied<br />
Finance (Macquarie University), an associate of the Institute of Chartered<br />
Secretaries and Administrators (UK), senior associate of the Australian<br />
Institute of Finance and Banking.<br />
Dr. Goh Jin Hian Independent Director - Appointed in July 2011.<br />
- Executive Consultant of Parkw ayHealth, Singapore.<br />
- <strong>Group</strong> Executive Director of IAG Heathsciences <strong>Pte</strong> <strong>Ltd</strong>.<br />
- Bachelor of Medicine and Bachelor of Surgery (National University of<br />
Singapore), MBA (University of Hull), The Wharton Advanced<br />
Management Program.<br />
Mr. Ng Tiak Soon<br />
Senior Management<br />
Independent Director - Appointed in November 2011.<br />
- Self employed consultant<br />
- Non-practicing member of the Institute of Certified Public Accountants,<br />
member of Association of Chartered Certified Accountants (UK), member<br />
of the Singapore Institute of Directors.<br />
Mr. Yee Pinh Jeremy CEO, Execuitive Director - Appointed CEO in June 2011, Executive Director since Jan 2004.<br />
- CFO of CBB prior to demerger in June 2011.<br />
- Bachelor of Arts in Economic and Social Studies (Victoria University of<br />
Manchester), Bachelor of Commerce (Murdoch University), Master of<br />
Commerce (University of Sydney), MBA (Nanyang Technological<br />
University), MBA (University of Chicago Booth School of Business).<br />
Ms. Gw endolene Yeo<br />
Teck Geok<br />
Ms. Cheung Wai Yee,<br />
Emily<br />
General Manager,<br />
Singapore<br />
General Manager, Hong<br />
Kong<br />
- Joined the group in Dec 2002.<br />
- Diploma in Mass Communication (Ngee Ann Polytechnic), Bachelor of<br />
Arts (Royal Melbourne Institute of Technology).<br />
- Joined the group in 2005.<br />
- Graduate Certificate in Business Administration, MBA (University of<br />
South Australia).<br />
Ms. Thet Hnin Yi Financial Controller - Joined group in June 2011.<br />
- Joined CBB as Senior Finance Manager in Dec 2007.<br />
- Diploma in Accountancy (Ngee Ann Polytechnic), a fellow of The<br />
Association of Chartered Certified Accountants (UK), non-practising<br />
member of the Institute of Certified Public Accountants of Singapore.<br />
Source: <strong>Cordlife</strong><br />
8 of 21
<strong>Cordlife</strong> <strong>Group</strong> <strong>Ltd</strong><br />
Singapore Equities Research<br />
8 April 2013<br />
Company Overview<br />
<strong>Cordlife</strong> <strong>Group</strong> (<strong>Cordlife</strong>) is a provider of cord blood and<br />
tissue banking services. <strong>Cordlife</strong> operates primarily in<br />
Singapore and Hong Kong, but offers indirect exposure to<br />
China with a 10% stake in China Cord Blood Corporation.<br />
The stock was listed on the mainboard of the Singapore<br />
Exchange on 29 th March 2012.<br />
Business Segments<br />
<strong>Cordlife</strong> generates approximately 75% and 25% of its group<br />
revenue from businesses in South Asia (mainly Singapore)<br />
and North Asia (mainly Hong Kong) respectively. South Asia<br />
contributes almost all the profits for the group with its<br />
business in North Asia only marginally profitable. Majority of<br />
its existing revenue is attributable to the cord blood banking<br />
services as the umbilical cord tissue banking services was<br />
only started recently (launched in Hong Kong: Mar 2011).<br />
This makes <strong>Cordlife</strong> a single product company that is highly<br />
dependent on the cord blood banking industry.<br />
Fig 14: Revenue by geography (S$’mn)<br />
30<br />
25<br />
20<br />
15<br />
10<br />
5<br />
0<br />
South Asia<br />
North Asia<br />
16.9<br />
5.7<br />
20.3<br />
Source: <strong>Cordlife</strong><br />
19.2<br />
21.7<br />
7.9 6.5 7.1<br />
FY09 FY10 FY11 FY12<br />
Fig 15: Profit by geography (S$’mn)<br />
12<br />
10<br />
8<br />
6<br />
4<br />
2<br />
0<br />
(2)<br />
Source: <strong>Cordlife</strong>, PSR est.<br />
6.9<br />
9.0<br />
0.8 0.2<br />
8.3 7.5<br />
(0.1)<br />
South Asia<br />
North Asia<br />
(0.0)<br />
FY09 FY10 FY11 FY12<br />
*Profit contributions adjusted to remove contributions from<br />
associates and added IPO expenses to South Asia for FY12.<br />
What is cord blood banking?<br />
Cord blood is the blood that is removed from a baby’s<br />
umbilical cord at birth and is a rich source of stem cells. This<br />
provides an alternative to bone marrow as a source of stem<br />
cells that can be used for the treatment of various diseases.<br />
The risk free extraction is the main advantage of using cord<br />
blood, as compared to using bone marrow that requires a<br />
surgery. The process of collecting cord blood can be found<br />
on the company’s website: collection process.<br />
Subsequently, the cord blood that is extracted would need to<br />
be stored at very low temperatures for retrieval at a later<br />
date.<br />
9 of 21<br />
The cord blood that is stored is a perfect match for the baby,<br />
but it also has a high chance being compatible for the family<br />
members. Conceptually, we see it as similar to purchasing<br />
insurance for the baby and his/her family members.<br />
Public vs private cord blood banks<br />
Apart from private cord blood banking, such as services<br />
provided by <strong>Cordlife</strong>, public cord blood banks are also a<br />
source of cord blood. Cord blood samples that are stored at<br />
public banks are usually donated and could be used to<br />
support requirements from around the world. As such, unlike<br />
storing the person’s own cord blood at birth, a patient who<br />
requires cord blood for treatment may not be able to find a<br />
perfect match from public banks in the future.<br />
Singapore<br />
Singapore currently has 1 public and 2 private cord blood<br />
banking service providers. Singapore Cord Blood Bank<br />
(SCBB), the public cord blood bank in the country, holds<br />
inventories of 8,943 samples with diversity similar to the<br />
profile of Singapore’s ethnic groups. The samples held by<br />
the public bank are approximately 0.23% of the resident<br />
population (c.3.8mn) and 0.17% of the total population<br />
(c.5.3mn) in Singapore. <strong>Cordlife</strong> is the only AABB accredited<br />
private cord blood bank in Singapore.<br />
Fig 16: SCBB Cord Blood Inventory, as of 30 Sep 2012<br />
(‘k)<br />
Indian, 0.7 ,<br />
8%<br />
Others, 1.0 ,<br />
11%<br />
Malay, 1.7 ,<br />
19%<br />
Chinese, 5.5 ,<br />
62%<br />
Source: SCBB, PSR est.<br />
Fig 17: Singapore Resident Pop., as of 30 June 2012 (‘k)<br />
Others, 126 ,<br />
3%<br />
Indian, 351 ,<br />
9%<br />
Malay, 510 ,<br />
13%<br />
Chinese,<br />
2,832 , 75%<br />
Source: Singstat, PSR est.
<strong>Cordlife</strong> <strong>Group</strong> <strong>Ltd</strong><br />
Singapore Equities Research<br />
8 April 2013<br />
Population trends<br />
As with many developed nations, Singapore is currently<br />
experiencing a low level of fertility rate. At 2012’s Total<br />
Fertility Rate (TFR) of 1.28-1.30, Singapore is significantly<br />
below the replacement rate of 2.1. Consequently,<br />
Singapore’s government recently set a target to move the<br />
country’s TFR to 1.4-1.5 and had introduced an enhanced<br />
S$2bn “Marriage and Parenthood packages” to support this<br />
objective. Parents would receive a cash gift of S$6-8k for<br />
their newborn (1 st /2 nd : S$6k; 3 rd /4 th : S$8k) from the<br />
government and savings to a Child Development Account<br />
(CDA) would be matched dollar-for-dollar by S$6-18k (1 st /2 nd :<br />
S$6k; 3 rd /4 th : S$12k; >5 th : S$18k). This significantly<br />
subsidizes the cost of child rearing and benefits the private<br />
cord blood banking industry by supplementing the cost of<br />
using their services.<br />
Fig 18: Birth rates in Singapore<br />
55<br />
50<br />
45<br />
40<br />
35<br />
CY12<br />
CY11<br />
CY10<br />
CY09<br />
CY08<br />
CY07<br />
CY06<br />
CY05<br />
CY04<br />
CY03<br />
CY02<br />
CY01<br />
CY00<br />
CY99<br />
CY98<br />
CY97<br />
CY96<br />
CY95<br />
CY94<br />
CY93<br />
CY92<br />
CY91<br />
CY90<br />
Live birth in Singapore ('k), LHS<br />
TFR, RHS<br />
Source: SingStat<br />
42.6<br />
2.0<br />
1.9<br />
1.8<br />
1.7<br />
1.6<br />
1.5<br />
1.4<br />
1.3<br />
1.2<br />
1.1<br />
1.0<br />
Market share<br />
There is currently 2 private cord blood banking service<br />
providers in Singapore. While both <strong>Cordlife</strong> & StemCord do<br />
not breakdown the exact number of samples held in the<br />
country, <strong>Cordlife</strong> was estimated to have a market share of<br />
62% by deliveries in 2010. According to the company’s<br />
website StemCord stored more than 30k samples since<br />
2002, which is marginally lower than the > 40k samples held<br />
between Singapore and Hong Kong for <strong>Cordlife</strong>.<br />
Fig 19: Market share of private cord blood banks by<br />
deliveries in 2010 (‘k)<br />
Stemcord, 3.5<br />
, 38%<br />
<strong>Cordlife</strong>, 5.8 ,<br />
62%<br />
Source: <strong>Cordlife</strong>, PSR (for CY2010)<br />
10 of 21<br />
Hong Kong<br />
Hong Kong has 1 public and 5 private cord blood banking<br />
service providers. There is very limited information on Hong<br />
Kong Red Cross, the only public cord blood bank in the<br />
country. However, according to a news article on the South<br />
China Morning Post, dated 18 th Sep 2012, the bank stored<br />
about 3,600 samples and had been in operation since 1998.<br />
The number of samples held by the public bank is<br />
approximately 0.05% of the total population of Hong Kong<br />
(c.7.2mn).<br />
Population trends<br />
Similar to Singapore’s population trend, TFR in Hong Kong<br />
remained below replacement levels at 1.25 in 2012. The<br />
birth rates in Hong Kong have improved significantly due to<br />
the influx of mainland women giving birth in Hong Kong.<br />
Within this group, babies born in Hong Kong, due to<br />
mainland women whose spouses are not Hong Kong’s<br />
permanent residence, increased significantly over the years<br />
(2011: 35.7k vs 2001: 0.6k). This was due to a court ruling in<br />
2001 stating that babies born in Hong Kong to mainland<br />
nationals have a right of abode in the country. However, this<br />
trend of increasing birth rates in Hong Kong had put a<br />
significant strain on the resources in the country.<br />
Consequently, a policy to restrict mainland women from<br />
giving birth in Hong Kong was imposed (2012 quota: private<br />
hosp. - 31.0k; public hosp. - 3.4k). This restriction is<br />
probably the reason for a decline in birth rates in 2012,<br />
despite the seasonally stronger birth rates in the dragon<br />
year. The Hong Kong government tightened this regulation<br />
further in mid 2012 and imposed a “zero delivery quota”<br />
policy for mainland women whose spouse are not Hong<br />
Kong resident from 2013 onwards.<br />
Fig 20: Birth rates in Hong Kong<br />
110<br />
100<br />
90<br />
80<br />
70<br />
60<br />
50<br />
40<br />
CY12<br />
CY11<br />
CY10<br />
CY09<br />
CY08<br />
CY07<br />
CY06<br />
CY05<br />
CY04<br />
CY03<br />
CY02<br />
CY01<br />
CY00<br />
CY99<br />
CY98<br />
CY97<br />
CY96<br />
CY95<br />
CY94<br />
CY93<br />
CY92<br />
CY91<br />
CY90<br />
Live birth in Hong Kong ('k), LHS<br />
TFR, RHS<br />
Source: HK Census & Statistics Dept<br />
Fig 21: Composition of live birth in Hong Kong<br />
110<br />
100<br />
90<br />
80<br />
70<br />
60<br />
50<br />
40<br />
30<br />
20<br />
10<br />
0<br />
Live birth due to Mainland women ('k)<br />
Live birth ex-Mainland woman ('k)<br />
% Mainland women<br />
Source: HK Census & Statistics Dept<br />
CY01<br />
CY02<br />
CY03<br />
CY04<br />
CY05<br />
91.3<br />
*Detailed breakdown of composition is not available for CY12.<br />
CY06<br />
CY07<br />
CY08<br />
CY09<br />
CY10<br />
CY11<br />
1.5<br />
1.4<br />
1.3<br />
1.2<br />
1.1<br />
1.0<br />
0.9<br />
0.8<br />
60%<br />
50%<br />
40%<br />
30%<br />
20%<br />
10%
<strong>Cordlife</strong> <strong>Group</strong> <strong>Ltd</strong><br />
Singapore Equities Research<br />
8 April 2013<br />
Market share<br />
There is currently 5 private cord blood banking service<br />
providers in Hong Kong. Based on 2010 figures, <strong>Cordlife</strong><br />
has a market share of 28% by deliveries in the year. Among<br />
these players, only the 3 largest players, Cryolife, <strong>Cordlife</strong><br />
and Healthbaby have attained AABB accreditation.<br />
Fig 22: Market share of private cord blood banks by<br />
deliveries in 2010 (‘k)<br />
Smart Cells &<br />
Asia Pacific<br />
Stem Cells,<br />
0.2 , 4%<br />
Cryolife, 1.2 ,<br />
23%<br />
Healthbaby,<br />
2.3 , 45%<br />
<strong>Cordlife</strong>, 1.5 ,<br />
28%<br />
Source: <strong>Cordlife</strong>, PSR (for CY2010)<br />
Low fertility rate in core markets<br />
According to data from Central Intelligence Agency (CIA),<br />
Hong Kong and Singapore have among the lowest fertility<br />
rates in the world. However, these countries tend to have a<br />
higher level of wealth and disposable income, which we<br />
opine is a more important gauge of cord blood banking<br />
adoption levels. According to data from World Bank,<br />
Singapore has the highest level of healthcare expenditure<br />
per capita in the markets relevant to <strong>Cordlife</strong>.<br />
Fig 23: Fertility rate<br />
5.0<br />
4.0<br />
3.0<br />
2.0<br />
1.0<br />
0.0<br />
Philippines<br />
53 78 81 104 175 184 221 223 224<br />
3.10<br />
Malaysia<br />
2.61 2.55<br />
India<br />
Indonesia<br />
2.20<br />
Thailand<br />
1.66 1.55<br />
China<br />
Children Born per Woman<br />
Ranking<br />
Hong Kong^<br />
Source: CIA<br />
1.11 0.93 0.79<br />
Macao^<br />
Singapore<br />
*CIA’s measure of fertility rates could differ from national standards<br />
as a result of factors including data availability, assessment, and<br />
methods and protocols.<br />
11 of 21<br />
Fig 24: Healthcare exp. & GDP per capita, 2010 (US$)<br />
2,000<br />
1,500<br />
1,000<br />
500<br />
0<br />
Philippines<br />
Healthcare exp. per capita (US$), LHS<br />
GDP per capita (US$'k), RHS<br />
Source: World Bank, PSR<br />
77<br />
368<br />
Malaysia<br />
India<br />
54<br />
Indonesia<br />
77<br />
Thailand<br />
179 221<br />
China<br />
1,563<br />
Hong Kong^<br />
Macao^<br />
1,733<br />
Singapore<br />
^Healthcare expenditure data for Hong Kong estimated from HK<br />
DOH & data for Macao not available.<br />
Insurance penetration rate as a gauge<br />
We believe that cord blood banking is conceptually similar to<br />
life insurance policies. The “insured” pays a premium to<br />
receive a “payout” when a situation arose. However, there<br />
are two distinct differences. While insurance policies can be<br />
bought at anytime in a person’s life, the decision to adopt<br />
cord blood banking can only be made once in a person’s life<br />
(i.e. at birth). Hence, the decision to bank one’s cord blood is<br />
highly time sensitive. The second difference is that while the<br />
“payout” for insurance policies is money; the “payout” for<br />
cord blood banking is the opportunity to utilize one’s stem<br />
cell to save his/her life. Due to the conceptual similarity, we<br />
believe that one can use insurance penetration history as a<br />
guide to the potential for cord blood banking. As compared<br />
to a population of 5.3mn, 4.9mn lives were insured in<br />
Singapore at the end of 2012. The no. of lives insured as a<br />
proportion of population in Singapore trended higher over<br />
the years at a rate of 3.2% p.a. from 25% in 1991 to 92% in<br />
2012. Hence, if the adoption of private cord blood banking<br />
takes a similar path as that of insurance penetration, there<br />
would be significant upside to the 24% market penetration<br />
rate for Singapore in 2010.<br />
Fig 25: Lives Insured vs Population in Singapore<br />
6,000<br />
5,000<br />
4,000<br />
3,000<br />
2,000<br />
1,000<br />
0<br />
2012<br />
2011<br />
2010<br />
2009<br />
2008<br />
2007<br />
2006<br />
2005<br />
2004<br />
2003<br />
2002<br />
2001<br />
2000<br />
1999<br />
1998<br />
1997<br />
1996<br />
1995<br />
1994<br />
1993<br />
1992<br />
1991<br />
No. of Lives Insured ('k)<br />
as % of Population<br />
Source: CEIC, PSR<br />
0%<br />
80<br />
70<br />
60<br />
50<br />
40<br />
30<br />
20<br />
10<br />
0<br />
100%<br />
80%<br />
60%<br />
40%<br />
20%
<strong>Cordlife</strong> <strong>Group</strong> <strong>Ltd</strong><br />
Singapore Equities Research<br />
8 April 2013<br />
We believe that our target price of S$0.84 is<br />
conservative for the following reasons:<br />
1) Market penetration assumed to stagnate from CY15E.<br />
As shown in the discussion of our modeling assumptions,<br />
we have conservatively assumed stagnant market<br />
penetration after CY15E (Singapore: 38%; Hong Kong: 21%)<br />
and prefer to leave further penetration beyond CY15E as an<br />
upside risk to our valuation of the stock.<br />
2) Potential introduction of Umbilical Cord Tissue<br />
Banking in Singapore, yet to be built in. Currently,<br />
<strong>Cordlife</strong> only offers umbilical cord tissue banking services in<br />
Hong Kong. In Feb 2013, the company announced that it<br />
has entered into a strategic alliance agreement with<br />
CordLabs Asia to co-operate on providing similar services<br />
across various countries. With management currently<br />
exploring the possibility of introducing this service in<br />
Singapore, we believe that this could open up an additional<br />
revenue stream in the near future. However, until there is<br />
greater clarity on adoption of this new product, we prefer to<br />
leave this future revenue stream out of our model.<br />
3) Conservative valuation of its stake in CCBC. We were<br />
conservative in using the market price of CCBC as our<br />
valuation inputs. Our valuation of <strong>Cordlife</strong> would have<br />
increased by S$0.10 to S$0.94, if we had used consensus<br />
target price of US$5.50 as our valuation input.<br />
Fig 26: Market Price of CCBC<br />
3.40<br />
3.20<br />
3.00<br />
2.80<br />
2.60<br />
2.40<br />
2.20<br />
2.00<br />
Mar-12<br />
Apr-12<br />
May-12<br />
3.20<br />
Jun-12<br />
Jul-12<br />
2.41<br />
Aug-12<br />
Source: Bloomberg<br />
Sep-12<br />
Oct-12<br />
Nov-12<br />
Dec-12<br />
Jan-13<br />
Feb-13<br />
Stock Price (US$)<br />
4) Potential acquisition of fast growing emerging assets<br />
from CBB not factored in. <strong>Cordlife</strong> has a Right of First<br />
Refusal (ROFR) for the acquisition of various operating<br />
assets in Philippines, Indonesia & India from CBB, should<br />
the company decide to divest. Acquisition of these entities<br />
would provide <strong>Cordlife</strong> with geographical diversification into<br />
emerging markets that have higher birth rates and lower<br />
market penetration. As observed from the recent results of<br />
CBB, the Philippines portfolio had turned profitable with its<br />
sales in 1HFY13 (A$1.3mn) almost matching that of FY12<br />
(A$1.4mn). This implies that cash burn rate in the emerging<br />
markets could slow as its units start to turn profitable. So,<br />
what price to pay these assets? We believe that a reference<br />
point for these assets would be CBB’s market value of<br />
c.S$11.6mn (A$8.6mn based on market price of A$0.050),<br />
which could be fully funded with less than 2yrs of operating<br />
cashflow.<br />
Mar-13<br />
Apr-13<br />
May-13<br />
Jun-13<br />
12 of 21<br />
Fig 27: Revenue of emerging market in CBB (A$’mn)<br />
6.0<br />
5.0<br />
4.0<br />
3.0<br />
2.0<br />
1.0<br />
0.0<br />
Philippines<br />
India<br />
Indonesia<br />
0.1<br />
0.5<br />
1.2<br />
1.7<br />
1.4<br />
3.4<br />
1.3 1.0 1.0 0.7<br />
Source: CBB<br />
1.3<br />
2.2<br />
FY10 FY11 FY12 HY13<br />
Fig 28: Profits of emerging market in CBB (A$’mn)<br />
0.5<br />
0.0<br />
(0.5)<br />
(1.0)<br />
(1.5)<br />
(2.0)<br />
(2.5)<br />
(3.0)<br />
(3.5)<br />
Source: CBB<br />
(0.7)<br />
(0.8)<br />
(0.6)<br />
(1.5)<br />
(0.9)<br />
(0.6)<br />
(1.0)<br />
(0.8)<br />
(0.4)<br />
FY10 FY11 FY12 HY13<br />
Fig 29: Market Price of CBB<br />
0.10<br />
0.08<br />
0.06<br />
0.04<br />
0.02<br />
0.00<br />
Mar-12<br />
Apr-12<br />
0.080<br />
May-12<br />
Jun-12<br />
Jul-12<br />
Aug-12<br />
Source: Bloomberg<br />
Sep-12<br />
Oct-12<br />
Nov-12<br />
Dec-12<br />
Jan-13<br />
0.030<br />
Feb-13<br />
Mar-13<br />
0.3<br />
(0.1)<br />
(0.2)<br />
Philippines<br />
India<br />
Indonesia<br />
Market Price (A$)<br />
Apr-13<br />
May-13<br />
Jun-13
<strong>Cordlife</strong> <strong>Group</strong> <strong>Ltd</strong><br />
Singapore Equities Research<br />
8 April 2013<br />
Key Drivers:<br />
We expect the number of live births in Singapore to<br />
moderate in CY13E to 38.0k, as we build in moderation after<br />
the seasonally stronger dragon year of 42.6k live births in<br />
CY12. In line with the long term population growth of<br />
Singapore, live births are assumed to increase at 1% a year.<br />
We modeled higher penetration rates and a 62% market<br />
share for <strong>Cordlife</strong> over the next few years and assumed that<br />
penetration rate sustain at 38% in CY15E and beyond.<br />
For the Hong Kong market, we expect live births at private<br />
hospitals to decline to 20.0k in CY13E due to restrictions on<br />
deliveries by mainland women as explained earlier. Similar<br />
to Singapore, live births are assumed to increase at 1% a<br />
year. We modeled a 28% market share and higher<br />
penetration rates over the next few years to a sustained<br />
level of 21% in CY15E and beyond.<br />
Our assumptions on the market penetration in Singapore<br />
and Hong Kong are in line with the market research report in<br />
<strong>Cordlife</strong>’s IPO prospectus by Deloitte & Touche Financial<br />
Advisory Services Limited.<br />
Fig 30: Key Model Assumptions<br />
13 of 21<br />
Key risks to our view:<br />
Market Penetration - While market penetration is<br />
expected to deepen for <strong>Cordlife</strong>’s core markets of<br />
Singapore and Hong Kong, actual increase in<br />
penetration rate may slow or not take place.<br />
Overpaying for emerging assets held by CBB - While<br />
acquisition of emerging assets held by CBB could<br />
provide growth beyond the matured markets, we believe<br />
that there is a risk of overpaying for them as it depends<br />
on the negotiation between the two parties.<br />
Regulatory - We believe that a change in regulatory<br />
regimes would have a significant impact on the business<br />
of <strong>Cordlife</strong>. For example, recent measures by the Hong<br />
Kong government to ban mainland women, who are not<br />
spouses of Hong Kong residents, from delivering in the<br />
country have effectively shrunk the number of live births<br />
and market size for the cord blood banking players.<br />
Model Build:<br />
Key assumptions CY13E CY14E CY15E CY16E CY17E CY18E CY19E CY20E CY21E CY22E CY23E CY24E<br />
Singapore<br />
Live Birth ('k) 38.0 38.4 38.8 39.2 39.5 39.9 40.3 40.7 41.1 41.6 42.0 42.4<br />
y-y (%) 1.0% 1.0% 1.0% 1.0% 1.0% 1.0% 1.0% 1.0% 1.0% 1.0% 1.0%<br />
Penetration (%) 32.0% 35.0% 38.0% 38.0% 38.0% 38.0% 38.0% 38.0% 38.0% 38.0% 38.0% 38.0%<br />
Cordblood bank deliveries ('k) 12.2 13.4 14.7 14.9 15.0 15.2 15.3 15.5 15.6 15.8 16.0 16.1<br />
<strong>Cordlife</strong> Market share (%) 62% 62% 62% 62% 62% 62% 62% 62% 62% 62% 62% 62%<br />
Hong Kong<br />
Live Birth ('k) 20.0 20.2 20.4 20.6 20.8 21.0 21.2 21.4 21.7 21.9 22.1 22.3<br />
y-y (%) 1.0% 1.0% 1.0% 1.0% 1.0% 1.0% 1.0% 1.0% 1.0% 1.0% 1.0%<br />
Penetration (%) 16.9% 18.7% 21.0% 21.0% 21.0% 21.0% 21.0% 21.0% 21.0% 21.0% 21.0% 21.0%<br />
Cordblood bank deliveries ('k) 3.4 3.8 4.3 4.3 4.4 4.4 4.5 4.5 4.5 4.6 4.6 4.7<br />
<strong>Cordlife</strong> Market share (%) 28% 28% 28% 28% 28% 28% 28% 28% 28% 28% 28% 28%<br />
Key model inputs FY13E FY14E FY15E FY16E FY17E FY18E FY19E FY20E FY21E FY22E FY23E FY24E<br />
Client delivery ('k) 8.4 8.9 9.9 10.4 10.5 10.6 10.7 10.8 10.9 11.0 11.1 11.2<br />
Units stored ('k) 49.3 58.2 68.1 78.5 89.0 99.6 110.3 121.1 132.0 143.0 154.1 165.4<br />
Utilisation (%) 6.9% 8.2% 9.6% 11.1% 12.5% 14.0% 15.5% 17.1% 18.6% 20.1% 21.7% 23.3%<br />
Revenue (S$'mn) 33.8 36.8 41.2 44.4 46.2 48.1 50.0 51.9 53.8 55.8 57.7 59.7<br />
y-y (%) 17.6% 8.9% 11.8% 7.7% 4.2% 4.0% 3.9% 3.8% 3.7% 3.6% 3.5% 3.4%<br />
Gross Margin (%) 70.0% 70.5% 71.0% 71.0% 71.0% 71.0% 71.0% 71.0% 71.0% 71.0% 71.0% 71.0%<br />
Gross Profit (S$'mn) 23.7 26.0 29.3 31.5 32.8 34.1 35.5 36.8 38.2 39.6 41.0 42.4<br />
FCF (S$'mn) 7.9 9.6 9.6 10.2 10.6 11.2 11.7 12.3 12.8 13.4 13.9<br />
Terminal Value (S$'mn) 169.3<br />
WACC (%) 9.0%<br />
Terminal g (%) 1.0%<br />
Discounted FCF (S$'mn) 7.5 8.4 7.7 7.5 7.2 7.0 6.7 6.4 6.2 80.6<br />
Sum of Discounted FCF (S$'mn) 145.3<br />
Source: PSR est.
<strong>Cordlife</strong> <strong>Group</strong> <strong>Ltd</strong><br />
Singapore Equities Research<br />
8 April 2013<br />
Scenarios<br />
Bullish view - Dreaming of the upside… What if cord<br />
blood banking continues to gain popularity? As with every<br />
trend, there are always tipping points that could result in<br />
mass adoption. For example, during initial introduction of<br />
mobile phones, not many would have imagined a market<br />
penetration of >100% in Singapore. In crafting our bullish<br />
view on the stock, we assumed that market penetration<br />
would continue to deepen over the next decade and sustain<br />
at 60% in Singapore and 40% in Hong Kong by 2022. We<br />
also used consensus TP of US$5.50/shr to value <strong>Cordlife</strong>’s<br />
stake in China Cord Blood. This valuation method would<br />
drive a target price of S$1.12.<br />
Fig 31: Bullish Valuation presents significant upside<br />
Sum of the parts Value Percent Per shr Remarks<br />
(Bullish view ) S$'mn S$<br />
Core Value of Company, DCF 185.2 71% 0.80 DCF (WACC: 9.0%, terminal g: 1%)<br />
Stake in China Cord Blood Corp. 50.3 19% 0.22 Consensus TP (US$5.50/shr)<br />
Enterprise Value 235.5 91% 1.01 Basis: FY14E<br />
Add: Investments 19.9 8% 0.09<br />
Add: Cash 10.1 4% 0.04<br />
Less: Debt (5.5) -2% (0.02)<br />
Equity Value 260.0 100% 1.12<br />
Outstanding no. of shares ('mn) 232.7<br />
Target Price (S$') 1.12<br />
Current Market Price (S$) 0.645<br />
F12M DPS (S$) 0.025<br />
Price upside (%) 73.6%<br />
Dividend yield (%) 3.9%<br />
Total return (%)<br />
Source: PSR est.<br />
77.5%<br />
Fig 32: Bearish Valuation close to current market price<br />
Sum of the parts Value Percent Per shr Remarks<br />
(Bearish view ) S$'mn S$<br />
Core Value of Company, DCF 100.5 67% 0.43 DCF (WACC: 9.0%, terminal g: 1%)<br />
Stake in China Cord Blood Corp. 22.0 15% 0.09 Low est price in 1yr (US$2.41/shr)<br />
Enterprise Value 122.6 82% 0.53 Basis: FY14E<br />
Add: Investments 19.9 13% 0.09<br />
Add: Cash 12.9 9% 0.06<br />
Less: Debt (5.5) -4% (0.02)<br />
Equity Value 149.9 100% 0.64<br />
Outstanding no. of shares ('mn) 232.7<br />
Target Price (S$') 0.64<br />
Current Market Price (S$) 0.645<br />
F12M DPS (S$) 0.025<br />
Price upside (%) -0.8%<br />
Dividend yield (%) 3.9%<br />
Total return (%)<br />
Source: PSR est.<br />
3.1%<br />
14 of 21<br />
Bearish view- What if the forecasted penetration did not<br />
materialize? We should also exercise caution and think<br />
about the downside. In this scenario, we assume that all the<br />
bullish views about increasing market penetration did not<br />
materialize and penetration levels stays at that of CY10<br />
(Singapore: 24.0%; Hong Kong 11.5%). We have also used<br />
the 1 year low of China Cord Blood of US$2.41/shr in this<br />
valuation model. This would lead to a valuation that is close<br />
to the current market price of S$0.64.
<strong>Cordlife</strong> <strong>Group</strong> <strong>Ltd</strong><br />
Singapore Equities Research<br />
8 April 2013<br />
FYE June FY11 FY12 FY13F FY14F FY15F<br />
Valuation Ratios<br />
P/E (X), adj. 17.7 17.0 16.0 15.0 13.3<br />
P/B (X) n.m. 2.1 2.0 1.9 1.7<br />
EV/EBITDA (X), adj. 16.2 17.6 15.0 13.4 11.5<br />
Dividend Yield (%) n.m. 5.9% 3.9% 4.2% 4.7%<br />
Per share data (SGD)<br />
EPS, reported n.m. 0.030 0.052 0.043 0.048<br />
EPS, adj. 0.036 0.038 0.040 0.043 0.048<br />
DPS n.m. 0.038 0.025 0.027 0.030<br />
BVPS n.m. 0.306 0.330 0.348 0.369<br />
Grow th & Margins (%)<br />
Grow th<br />
Revenue -8.8% 12.1% 17.6% 8.9% 11.8%<br />
EBITDA -9.5% -7.7% 17.0% 11.9% 16.9%<br />
EBIT -11.5% -9.4% 15.1% 12.0% 19.3%<br />
Net Income, adj. 2.5% 4.2% 6.5% 6.2% 13.0%<br />
Margins<br />
EBITDA margin 34.3% 28.2% 28.1% 28.8% 30.2%<br />
EBIT margin 32.0% 25.8% 25.3% 26.0% 27.8%<br />
Net Profit Margin 33.0% 24.1% 35.7% 27.1% 27.4%<br />
Key Ratios<br />
ROE (%) 23.0% 12.4% 16.3% 12.7% 13.5%<br />
ROA (%) 14.8% 9.5% 12.5% 9.4% 10.0%<br />
Net Debt/(Cash) (3) (10) (3) (5) (8)<br />
Net Gearing (X) Net Cash Net Cash Net Cash Net Cash Net Cash<br />
Income Statement (SGD mn)<br />
Revenue 25.7 28.8 33.8 36.8 41.2<br />
EBITDA 8.8 8.1 9.5 10.6 12.4<br />
Depreciation & Amortisation (0.6) (0.7) (0.9) (1.0) (1.0)<br />
EBIT 8.2 7.4 8.6 9.6 11.4<br />
Net Finance (Expense)/Income 0.0 0.2 0.5 0.4 0.1<br />
Other items 0.0 (1.9) 2.7 0.0 0.0<br />
Associates & JVs 1.7 2.1 2.0 2.0 2.1<br />
Profit Before Tax 9.9 7.8 13.7 12.0 13.6<br />
Taxation (1.5) (0.9) (1.6) (2.0) (2.3)<br />
Profit After Tax 8.5 6.9 12.1 10.0 11.3<br />
Non-controlling Interest 0.0 0.0 0.0 0.0 0.0<br />
Net Income, reported 8.5 6.9 12.1 10.0 11.3<br />
Net Income, adj. 8.5 8.8 9.4 10.0 11.3<br />
Source: PSR<br />
15 of 21
<strong>Cordlife</strong> <strong>Group</strong> <strong>Ltd</strong><br />
Singapore Equities Research<br />
8 April 2013<br />
FYE June FY11 FY12 FY13F FY14F FY15F<br />
Balance Sheet (SGD mn)<br />
PPE 4.3 6.1 10.1 9.6 9.4<br />
Intangibles 0.0 0.0 0.0 0.0 0.0<br />
Associates & JVs 15.1 17.7 27.4 29.4 31.5<br />
Investments 0.2 13.2 13.6 13.9 11.7<br />
Others 22.9 24.3 26.0 28.3 31.6<br />
Total non-current assets 42.5 61.2 77.1 81.3 84.2<br />
Inventories 0.2 0.4 0.4 0.4 0.4<br />
Accounts Receivables 7.1 9.2 10.0 10.9 12.2<br />
Investments 1.3 6.0 6.0 6.0 6.0<br />
Cash 4.0 12.9 8.5 10.1 14.0<br />
Others 0.3 0.5 0.5 0.5 0.5<br />
Total current assets 12.9 29.1 25.5 27.9 33.1<br />
Total Assets 55.4 90.4 102.6 109.2 117.4<br />
Short term loans 0.1 0.1 0.2 0.2 0.2<br />
Accounts Payables 4.3 3.9 5.5 5.9 6.5<br />
Others 3.7 4.3 4.3 4.3 4.3<br />
Total current liabilities 8.0 8.3 9.9 10.4 10.9<br />
Long term loans 0.8 2.5 5.3 5.3 5.3<br />
Others 6.0 8.5 10.7 12.6 15.2<br />
Total non-current liabilities 6.8 10.9 16.0 17.9 20.5<br />
Non-controlling interest 0.0 0.0 0.0 0.0 0.0<br />
Shareholder Equity 40.6 71.2 76.7 80.9 85.9<br />
Cashflow Statements (SGD mn)<br />
CFO<br />
PBT 9.9 7.8 13.7 12.0 13.6<br />
Adjustments (1.2) 0.5 (4.2) (1.4) (1.2)<br />
Cash from ops before WC changes 8.7 8.3 9.5 10.6 12.4<br />
WC changes 0.6 (0.6) 1.3 (0.8) (1.4)<br />
Cash generated from ops 9.4 7.7 10.8 9.8 11.0<br />
Taxes paid, net (1.4) (1.7) (1.6) (2.0) (2.3)<br />
Interest paid (0.0) (0.0) (0.1) (0.2) (0.2)<br />
Cashflow from ops 7.9 6.0 9.0 7.6 8.5<br />
CFI<br />
CAPEX, net (3.1) (2.4) (5.0) (0.5) (0.8)<br />
Dividends from associates & JVs 0.0 0.0 0.0 0.0 0.0<br />
Dividends/Interest from Investments 0.1 0.1 0.3 0.3 0.3<br />
Purchase/sale of investments (1.3) (17.7) (0.0) (0.0) 2.2<br />
Investments in subs & associates 0.0 0.0 (5.1) 0.0 0.0<br />
Others 0.0 0.0 0.0 0.0 0.0<br />
Cashflow from investments (4.3) (20.0) (9.9) (0.3) 1.7<br />
CFF<br />
Share issuance 0.0 26.0 0.0 0.0 0.0<br />
Purchase of treasury shares 0.0 0.0 0.0 0.0 0.0<br />
Loans, net of repayments 0.8 1.7 2.9 0.0 0.0<br />
Dividends to minority interests 0.0 0.0 0.0 0.0 0.0<br />
Dividends to shareholders & capital reduction 0.0 (4.7) (6.5) (5.8) (6.3)<br />
Others (8.1) 0.0 0.0 0.0 0.0<br />
Cashflow from financing (7.3) 23.0 (3.6) (5.8) (6.3)<br />
Net change in cash (3.6) 9.0 (4.4) 1.5 3.9<br />
Effects of exchange rates 0.3 (0.0) 0.0 0.0 0.0<br />
CCE, end 4.0 12.9 8.5 10.1 14.0<br />
Source: PSR<br />
16 of 21
<strong>Cordlife</strong> <strong>Group</strong> <strong>Ltd</strong><br />
Singapore Equities Research<br />
8 April 2013<br />
Ratings History<br />
0.90<br />
0.80<br />
0.70<br />
0.60<br />
0.50<br />
0.40<br />
1<br />
2<br />
3<br />
4<br />
5<br />
Mar-12<br />
Market Price<br />
Target Price<br />
Jun-12<br />
Sep-12<br />
Source: Bloomberg, PSR<br />
PSR Rating System<br />
Total Returns Recommendation Rating<br />
> +20% Buy 1<br />
+5% to +20% Accumulate 2<br />
-5% to +5% Neutral 3<br />
-5% to -20% Reduce 4<br />
<strong>Cordlife</strong> <strong>Group</strong> <strong>Ltd</strong><br />
Singapore Equities Research<br />
8 April 2013<br />
Important Information<br />
This publication is prepared by <strong>Phillip</strong> <strong>Securities</strong> Research <strong>Pte</strong> <strong>Ltd</strong>., 250 North Bridge Road, #06-00, Raffles City<br />
Tower, Singapore 179101 (Registration Number: 198803136N), which is regulated by the Monetary Authority of<br />
Singapore (“<strong>Phillip</strong> <strong>Securities</strong> Research”). By receiving or reading this publication, you agree to be bound by the terms<br />
and limitations set out below.<br />
This publication has been provided to you for personal use only and shall not be reproduced, distributed or published<br />
by you in whole or in part, for any purpose. If you have received this document by mistake, please delete or destroy it,<br />
and notify the sender immediately. <strong>Phillip</strong> <strong>Securities</strong> Research shall not be liable for any direct or consequential loss<br />
arising from any use of material contained in this publication.<br />
The information contained in this publication has been obtained from public sources, which <strong>Phillip</strong> <strong>Securities</strong> Research<br />
has no reason to believe are unreliable and any analysis, forecasts, projections, expectations and opinions<br />
(collectively, the “Research”) contained in this publication are based on such information and are expressions of belief<br />
of the individual author or the indicated source (as applicable) only. <strong>Phillip</strong> <strong>Securities</strong> Research has not verified this<br />
information and no representation or warranty, express or implied, is made that such information or Research is<br />
accurate, complete, appropriate or verified or should be relied upon as such. Any such information or Research<br />
contained in this publication is subject to change, and <strong>Phillip</strong> <strong>Securities</strong> Research shall not have any responsibility to<br />
maintain or update the information or Research made available or to supply any corrections, updates or releases in<br />
connection therewith. In no event will <strong>Phillip</strong> <strong>Securities</strong> Research or persons associated with or connected to <strong>Phillip</strong><br />
<strong>Securities</strong> Research, including but not limited its officers, directors, employees or persons involved in the preparation<br />
or issuance of this report, (i) be liable in any manner whatsoever for any consequences (including but not limited to<br />
any special, direct, indirect, incidental or consequential losses, loss of profits and damages) of any reliance or usage<br />
of this publication or (ii) accept any legal responsibility from any person who receives this publication, even if it has<br />
been advised of the possibility of such damages. You must make the final investment decision and accept all<br />
responsibility for your investment decision, including, but not limited to your reliance on the information, data and/or<br />
other materials presented in this publication.<br />
Any opinions, forecasts, assumptions, estimates, valuations and prices contained in this material are as of the date<br />
indicated and are subject to change at any time without prior notice.<br />
Past performance of any product referred to in this publication is not indicative of future results.<br />
This report does not constitute, and should not be used as a substitute for, tax, legal or investment advice. This<br />
publication should not be relied upon exclusively or as authoritative, without further being subject to the recipient’s own<br />
independent verification and exercise of judgment. The fact that this publication has been made available constitutes<br />
neither a recommendation to enter into a particular transaction, nor a representation that any product described in this<br />
material is suitable or appropriate for the recipient. Recipients should be aware that many of the products, which may<br />
be described in this publication involve significant risks and may not be suitable for all investors, and that any decision<br />
to enter into transactions involving such products should not be made, unless all such risks are understood and an<br />
independent determination has been made that such transactions would be appropriate. Any discussion of the risks<br />
contained herein with respect to any product should not be considered to be a disclosure of all risks or a complete<br />
discussion of such risks.<br />
Nothing in this report shall be construed to be an offer or solicitation for the purchase or sale of any product. Any<br />
decision to purchase any product mentioned in this research should take into account existing public information,<br />
including any registered prospectus in respect of such product.<br />
<strong>Phillip</strong> <strong>Securities</strong> Research, or persons associated with or connected to <strong>Phillip</strong> <strong>Securities</strong> Research, including but not<br />
limited to its officers, directors, employees or persons involved in the preparation or issuance of this report, may<br />
provide an array of financial services to a large number of corporations in Singapore and worldwide, including but not<br />
limited to commercial / investment banking activities (including sponsorship, financial advisory or underwriting<br />
activities), brokerage or securities trading activities. <strong>Phillip</strong> <strong>Securities</strong> Research, or persons associated with or<br />
connected to <strong>Phillip</strong> <strong>Securities</strong> Research, including but not limited to its officers, directors, employees or persons<br />
involved in the preparation or issuance of this report, may have participated in or invested in transactions with the<br />
issuer(s) of the securities mentioned in this publication, and may have performed services for or solicited business<br />
from such issuers. Additionally, <strong>Phillip</strong> <strong>Securities</strong> Research, or persons associated with or connected to <strong>Phillip</strong><br />
<strong>Securities</strong> Research, including but not limited to its officers, directors, employees or persons involved in the<br />
18 of 21
<strong>Cordlife</strong> <strong>Group</strong> <strong>Ltd</strong><br />
Singapore Equities Research<br />
8 April 2013<br />
preparation or issuance of this report, may have provided advice or investment services to such companies and<br />
investments or related investments, as may be mentioned in this publication.<br />
<strong>Phillip</strong> <strong>Securities</strong> Research or persons associated with or connected to <strong>Phillip</strong> <strong>Securities</strong> Research, including but not<br />
limited to its officers, directors, employees or persons involved in the preparation or issuance of this report may, from<br />
time to time maintain a long or short position in securities referred to herein, or in related futures or options, purchase<br />
or sell, make a market in, or engage in any other transaction involving such securities, and earn brokerage or other<br />
compensation in respect of the foregoing. Investments will be denominated in various currencies including US dollars<br />
and Euro and thus will be subject to any fluctuation in exchange rates between US dollars and Euro or foreign<br />
currencies and the currency of your own jurisdiction. Such fluctuations may have an adverse effect on the value, price<br />
or income return of the investment.<br />
To the extent permitted by law, <strong>Phillip</strong> <strong>Securities</strong> Research, or persons associated with or connected to <strong>Phillip</strong><br />
<strong>Securities</strong> Research, including but not limited to its officers, directors, employees or persons involved in the<br />
preparation or issuance of this report, may at any time engage in any of the above activities as set out above or<br />
otherwise hold a interest, whether material or not, in respect of companies and investments or related investments,<br />
which may be mentioned in this publication. Accordingly, information may be available to <strong>Phillip</strong> <strong>Securities</strong> Research,<br />
or persons associated with or connected to <strong>Phillip</strong> <strong>Securities</strong> Research, including but not limited to its officers,<br />
directors, employees or persons involved in the preparation or issuance of this report, which is not reflected in this<br />
material, and <strong>Phillip</strong> <strong>Securities</strong> Research, or persons associated with or connected to <strong>Phillip</strong> <strong>Securities</strong> Research,<br />
including but not limited to its officers, directors, employees or persons involved in the preparation or issuance of this<br />
report, may, to the extent permitted by law, have acted upon or used the information prior to or immediately following<br />
its publication. <strong>Phillip</strong> <strong>Securities</strong> Research, or persons associated with or connected to <strong>Phillip</strong> <strong>Securities</strong> Research,<br />
including but not limited its officers, directors, employees or persons involved in the preparation or issuance of this<br />
report, may have issued other material that is inconsistent with, or reach different conclusions from, the contents of<br />
this material.<br />
The information, tools and material presented herein are not directed, intended for distribution to or use by, any person<br />
or entity in any jurisdiction or country where such distribution, publication, availability or use would be contrary to the<br />
applicable law or regulation or which would subject <strong>Phillip</strong> <strong>Securities</strong> Research to any registration or licensing or other<br />
requirement, or penalty for contravention of such requirements within such jurisdiction.<br />
Section 27 of the Financial Advisers Act (Cap. 110) of Singapore and the MAS Notice on Recommendations on<br />
Investment Products (FAA-N01) do not apply in respect of this publication.<br />
This material is intended for general circulation only and does not take into account the specific investment objectives,<br />
financial situation or particular needs of any particular person. The products mentioned in this material may not be<br />
suitable for all investors and a person receiving or reading this material should seek advice from a professional and<br />
financial adviser regarding the legal, business, financial, tax and other aspects including the suitability of such<br />
products, taking into account the specific investment objectives, financial situation or particular needs of that person,<br />
before making a commitment to invest in any of such products.<br />
Please contact <strong>Phillip</strong> <strong>Securities</strong> Research at [65 65311240] in respect of any matters arising from, or in connection<br />
with, this document.<br />
This report is only for the purpose of distribution in Singapore.<br />
19 of 21
<strong>Cordlife</strong> <strong>Group</strong> <strong>Ltd</strong><br />
Singapore Equities Research<br />
8 April 2013<br />
Contact Information (Singapore Research Team)<br />
Chan Wai Chee Joshua Tan Derrick Heng<br />
CEO, Research Head of Research Deputy Head of Research<br />
Special Opportunities Global Macro, Asset Strategy<br />
SG Equity Strategist &<br />
Transport<br />
+65 6531 1231 +65 6531 1249 +65 6531 1221<br />
yebo@phillip.com.sg joshuatan@phillip.com.sg derrickhengch@phillip.com.sg<br />
Go Choon Koay, Bryan Ken Ang Ng Weiwen<br />
Investment Analyst Investment Analyst Macro Analyst<br />
Property Financials, Telecoms Global Macro, Asset Strategy<br />
+65 6531 1792 +65 6531 1793 +65 6531 1735<br />
gock@phillip.com.sg kenangwy@phillip.com.sg ngww@phillip.com.sg<br />
Roy Chen Nicholas Ong Research Assistant<br />
Macro Analyst Investment Analyst General Enquiries<br />
Global Macro, Asset Strategy Commodities, Offshore & Marine +65 6531 1240 (Phone)<br />
+65 6531 1535 +65 6531 5440 research@phillip.com.sg<br />
roychencz@phillip.com.sg nicholasonghg@phillip.com.sg<br />
20 of 21
<strong>Cordlife</strong> <strong>Group</strong> <strong>Ltd</strong><br />
Singapore Equities Research<br />
8 April 2013<br />
Contact Information (Regional Member Companies)<br />
SINGAPORE<br />
<strong>Phillip</strong> <strong>Securities</strong> <strong>Pte</strong> <strong>Ltd</strong><br />
Raffles City Tower<br />
250, North Bridge Road #06-00<br />
Singapore 179101<br />
Tel +65 6533 6001<br />
Fax +65 6535 6631<br />
Website: www.poems.com.sg<br />
HONG KONG<br />
<strong>Phillip</strong> <strong>Securities</strong> (HK) <strong>Ltd</strong><br />
Exchange Participant of the Stock Exchange of Hong Kong<br />
11/F United Centre 95 Queensway<br />
Hong Kong<br />
Tel +852 2277 6600<br />
Fax +852 2868 5307<br />
Websites: www.phillip.com.hk<br />
INDONESIA<br />
PT <strong>Phillip</strong> <strong>Securities</strong> Indonesia<br />
ANZ Tower Level 23B,<br />
Jl Jend Sudirman Kav 33A<br />
Jakarta 10220 – Indonesia<br />
Tel +62-21 5790 0800<br />
Fax +62-21 5790 0809<br />
Website: www.phillip.co.id<br />
THAILAND<br />
<strong>Phillip</strong> <strong>Securities</strong> (Thailand) Public Co. <strong>Ltd</strong><br />
15th Floor, Vorawat Building,<br />
849 Silom Road, Silom, Bangrak,<br />
Bangkok 10500 Thailand<br />
Tel +66-2 6351700 / 22680999<br />
Fax +66-2 22680921<br />
Website www.phillip.co.th<br />
UNITED KINGDOM<br />
King & Shaxson Capital Limited<br />
6th Floor, Candlewick House,<br />
120 Cannon Street,<br />
London, EC4N 6AS<br />
Tel +44-20 7426 5950<br />
Fax +44-20 7626 1757<br />
Website: www.kingandshaxson.com<br />
AUSTRALIA<br />
<strong>Phillip</strong>Capital<br />
Level 12, 15 William Street,<br />
Melbourne, Victoria 3000, Australia<br />
Tel +61-03 9629 8288<br />
Fax +61-03 9629 8882<br />
Website: www.phillipcapital.com.au<br />
21 of 21<br />
MALAYSIA<br />
<strong>Phillip</strong> Capital Management Sdn Bhd<br />
B-3-6 Block B Level 3 Megan Avenue II,<br />
No. 12, Jalan Yap Kwan Seng, 50450<br />
Kuala Lumpur<br />
Tel +603 2162 8841<br />
Fax +603 2166 5099<br />
Website: www.poems.com.my<br />
JAPAN<br />
<strong>Phillip</strong> <strong>Securities</strong> Japan, <strong>Ltd</strong>.<br />
4-2 Nihonbashi Kabuto-cho Chuo-ku,<br />
Tokyo 103-0026<br />
Tel +81-3 3666 2101<br />
Fax +81-3 3666 6090<br />
Website:www.phillip.co.jp<br />
CHINA<br />
<strong>Phillip</strong> Financial Advisory (Shanghai) Co. <strong>Ltd</strong><br />
No 550 Yan An East Road,<br />
Ocean Tower Unit 2318,<br />
Postal code 200001<br />
Tel +86-21 5169 9200<br />
Fax +86-21 6351 2940<br />
Website: www.phillip.com.cn<br />
FRANCE<br />
King & Shaxson Capital Limited<br />
3rd Floor, 35 Rue de la Bienfaisance 75008<br />
Paris France<br />
Tel +33-1 45633100<br />
Fax +33-1 45636017<br />
Website: www.kingandshaxson.com<br />
UNITED STATES<br />
<strong>Phillip</strong> Futures Inc<br />
141 W Jackson Blvd Ste 3050<br />
The Chicago Board of Trade Building<br />
Chicago, IL 60604 USA<br />
Tel +1-312 356 9000<br />
Fax +1-312 356 9005