OCBC - Under Construction Home - Phillip Securities Pte Ltd
OCBC - Under Construction Home - Phillip Securities Pte Ltd
OCBC - Under Construction Home - Phillip Securities Pte Ltd

You also want an ePaper? Increase the reach of your titles
YUMPU automatically turns print PDFs into web optimized ePapers that Google loves.
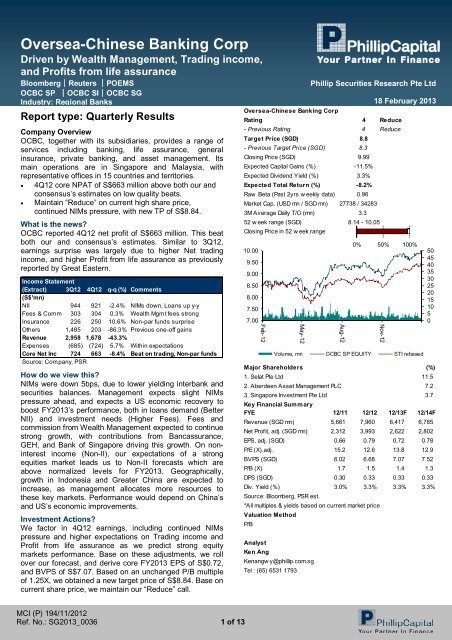
Oversea-Chinese Banking Corp<br />
Driven by Wealth Management, Trading income,<br />
and Profits from life assurance<br />
Bloomberg│Reuters │POEMS<br />
<strong>OCBC</strong> SP │<strong>OCBC</strong> SI│<strong>OCBC</strong> SG<br />
Industry: Regional Banks<br />
Report type: Quarterly Results<br />
Company Overview<br />
<strong>OCBC</strong>, together with its subsidiaries, provides a range of<br />
services including banking, life assurance, general<br />
insurance, private banking, and asset management. Its<br />
main operations are in Singapore and Malaysia, with<br />
representative offices in 15 countries and territories.<br />
4Q12 core NPAT of S$663 million above both our and<br />
consensus’s estimates on low quality beats.<br />
Maintain “Reduce” on current high share price,<br />
continued NIMs pressure, with new TP of S$8.84.<br />
What is the news?<br />
<strong>OCBC</strong> reported 4Q12 net profit of S$663 million. This beat<br />
both our and consensus’s estimates. Similar to 3Q12,<br />
earnings surprise was largely due to higher Net trading<br />
income, and higher Profit from life assurance as previously<br />
reported by Great Eastern.<br />
Income Statement<br />
(Extract) 3Q12 4Q12 q-q (%) Comments<br />
(S$'mn)<br />
NII 944 921 -2.4% NIMs down, Loans up y-y<br />
Fees & Comm 303 304 0.3% Wealth Mgmt fees strong<br />
Insurance 226 250 10.6% Non-par funds surprise<br />
Others 1,485 203 -86.3% Previous one-off gains<br />
Revenue 2,958 1,678 -43.3%<br />
Expenses (685) (724) 5.7% Within expectations<br />
Core Net Inc 724 663 -8.4% Beat on trading, Non-par funds<br />
Source: Company, PSR<br />
How do we view this?<br />
NIMs were down 5bps, due to lower yielding interbank and<br />
securities balances. Management expects slight NIMs<br />
pressure ahead, and expects a US economic recovery to<br />
boost FY2013’s performance, both in loans demand (Better<br />
NII) and investment needs (Higher Fees). Fees and<br />
commission from Wealth Management expected to continue<br />
strong growth, with contributions from Bancassurance,<br />
GEH, and Bank of Singapore driving this growth. On noninterest<br />
income (Non-II), our expectations of a strong<br />
equities market leads us to Non-II forecasts which are<br />
above normalized levels for FY2013. Geographically,<br />
growth in Indonesia and Greater China are expected to<br />
increase, as management allocates more resources to<br />
these key markets. Performance would depend on China’s<br />
and US’s economic improvements.<br />
Investment Actions?<br />
We factor in 4Q12 earnings, including continued NIMs<br />
pressure and higher expectations on Trading income and<br />
Profit from life assurance as we predict strong equity<br />
markets performance. Base on these adjustments, we roll<br />
over our forecast, and derive core FY2013 EPS of S$0.72,<br />
and BVPS of S$7.07. Based on an unchanged P/B multiple<br />
of 1.25X, we obtained a new target price of S$8.84. Base on<br />
current share price, we maintain our “Reduce” call.<br />
MCI (P) 194/11/2012<br />
Ref. No.: SG2013_0036 1 of 13<br />
Oversea-Chinese Banking Corp<br />
<strong>Phillip</strong> <strong>Securities</strong> Research <strong>Pte</strong> <strong>Ltd</strong><br />
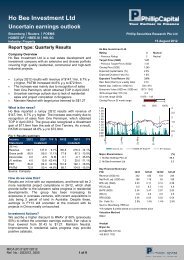
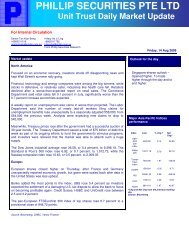
Rating 4 Reduce<br />
- Previous Rating 4 Reduce<br />
Target Price (SGD) 8.8<br />
- Previous Target Price (SGD) 8.3<br />
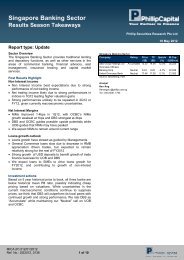
Closing Price (SGD) 9.99<br />
Expected Capital Gains (%) -11.5%<br />
Expected Dividend Yield (%) 3.3%<br />
Expected Total Return (%) -8.2%<br />
Raw Beta (Past 2yrs w eekly data) 0.96<br />
Market Cap. (USD mn / SGD mn) 27738 / 34283<br />
3M Average Daily T/O (mn) 3.3<br />
52 w eek range (SGD) 8.14 - 10.05<br />
Closing Price in 52 w eek range<br />
10.00<br />
9.50<br />
9.00<br />
8.50<br />
8.00<br />
7.50<br />
7.00<br />
18 February 2013<br />
Major Shareholders (%)<br />
1. Selat <strong>Pte</strong> <strong>Ltd</strong><br />
2. Aberdeen Asset Management PLC<br />
3. Singapore Investment <strong>Pte</strong> <strong>Ltd</strong><br />
11.5<br />
Key Financial Summary<br />
FYE 12/11 12/12 12/13F 12/14F<br />
Revenue (SGD mn) 5,661 7,960 6,417 6,785<br />
Net Profit, adj. (SGD mn) 2,312 3,993 2,622 2,802<br />
EPS, adj. (SGD) 0.66 0.79 0.72 0.78<br />
P/E (X),adj. 15.2 12.6 13.8 12.9<br />
BVPS (SGD) 6.02 6.68 7.07 7.52<br />
P/B (X) 1.7 1.5 1.4 1.3<br />
DPS (SGD) 0.30 0.33 0.33 0.33<br />
Div. Yield (%) 3.0% 3.3% 3.3% 3.3%<br />
Source: Bloomberg, PSR est.<br />
*All multiples & yields based on current market price<br />
Valuation Method<br />
P/B<br />
Feb-12<br />
Analyst<br />
Ken Ang<br />
Kenangw y@phillip.com.sg<br />
Tel : (65) 6531 1793<br />
May-12<br />
Aug-12<br />
0% 50% 100%<br />
Nov-12<br />
Volume, mn <strong>OCBC</strong> SP EQUITY STI rebased<br />
50<br />
45<br />
40<br />
35<br />
30<br />
25<br />
20<br />
15<br />
10<br />
5<br />
0<br />
7.2<br />
3.7
Oversea-Chinese Banking Corporation<br />
Singapore Equities Research<br />
18 February 2013<br />
Fig 1. Y-Y and Q-Q comparison of 4Q12 results<br />
$m 4Q12 4Q11 %y-y ch 3Q12 %q-q ch<br />
NII 921 925 -0.4% 944 -2.4%<br />
Fees & Comm 304 257 18.3% 303 0.3%<br />
Profits from insurance 250 85 194.1% 226 10.6%<br />
Other non-interest inc 203 230 -11.7% 1,485 -86.3%<br />
Total Reveue 1,678 1,497 12.1% 2,958 -43.3%<br />
Expenses (724) (620) 16.8% (685) 5.7%<br />
Core Net Profit 663 594 11.6% 724 -8.4%<br />
Conso'<br />
ending<br />
Profits<br />
(SGM)<br />
EPS<br />
(SG)<br />
12/09 A 2,254 0.66<br />
12/10 A 2,280 0.66<br />
12/12 A 2,825 0.79<br />
12/13 E 2,622 0.72<br />
12/14 E 2,802 0.78<br />
Source: Company, PSR<br />
DPS<br />
(SG)<br />
0.30<br />
0.30<br />
0.33<br />
0.33<br />
0.33<br />
BV<br />
(SG)<br />
5.66<br />
6.02<br />
6.68<br />
7.07<br />
7.52<br />
ROE<br />
(%)<br />
P/E<br />
(X)<br />
12.5% 13.77<br />
11.5% 13.88<br />
13.0% 11.45<br />
11.1% 12.57<br />
10.9% 11.72<br />
Yield<br />
(%)<br />
P/BV<br />
(X)<br />
3.3% 1.61<br />
3.3% 1.51<br />
3.6% 1.36<br />
3.6% 1.29<br />
3.6% 1.21<br />
NIMs decline 5bps q-q, continued pressure expected<br />
NIMs declined 5bps q-q, which was more than our and<br />
management’s previous expectations. While interest rates<br />
on customer loans and deposits were positive this quarter,<br />
placements with and loans to banks (4Q12: 1.83%, 3Q12:<br />
2.21%), and other interest earning assets (4Q12: 2.38%,<br />
3Q12: 2.51%), were lower yielding. Interest expense on<br />
other borrowings also increased, from 1.60% to 2.13% q-q.<br />
Fixed deposits continue to decrease, while CASA deposits<br />
grew, thus leading to a lower cost of fund and reducing NIMs<br />
pressure.<br />
Management guides the decrease in securities NIMs to be<br />
due to the low interest rate environment reducing gapping<br />
opportunities, while Basel III requirements previously<br />
resulted in some portfolio movement.<br />
For FY2013, management expects NIMs pressure to<br />
continue, albeit at a slower rate of compression. This is in<br />
line with management’s observation of recent slowing in the<br />
speed of NIMs narrowing. NIMs pressure is expected to<br />
come from 1) Higher cost of funds as banks compete for<br />
long term liquidity, to be compliant with Basel III<br />
requirements. 2) Pricing power on loans may also be<br />
reduced with higher competition, as management sees<br />
limited demand for loans and investments. This, however, is<br />
expected to pick up in 2H13, as management expects a<br />
potential recovery in the USA to drive economic growth, and<br />
a higher demand for loans and investments. 3) Continued<br />
lower yields from the refinancing of mortgage loans.<br />
Geographically, NIMs in <strong>OCBC</strong> Malaysia improved q-q from<br />
2.03% to 2.28%, due to higher loan yields and lower cost of<br />
funds. <strong>OCBC</strong> NISP (Indonesia)’s NIMs declined from 4.32%<br />
to 3.98% q-q, due to lower yields and higher cost of funds.<br />
Management continues to expect NIMs pressure in<br />
Indonesia, due to higher competition since the upgrade of<br />
the country by rating agencies to investment grade.<br />
The lower NIMs led lower than expected Net interest income,<br />
which declined 2.44% q-q.<br />
2 of 13<br />
FY2012 Loans growth 6.6%, mgmt maintains guidance<br />
Gross customer loans grew 3.07% q-q to S$144.0 billion. Yy,<br />
FY2012 registered loans growth of 6.6%. For the year,<br />
loans growth was largely from Housing loans (17.9% y-y),<br />
loans to Financial Institutions (48.2% y-y) and Building and<br />
<strong>Construction</strong> loans (9.9% y-y). Geographically, loans growth<br />
from China increased 7.65% in 4Q12, after three<br />
consecutive q-q declines.<br />
For FY2013, Management guides for high single digit loans<br />
growth. Housing loans are expected to grow in the mid teens<br />
from drawdown of loans approved in FY2011 and FY2012.<br />
By industry, we also expect loans growth in FY2013 from<br />
Building and <strong>Construction</strong>, Professional and private<br />
individuals, and General commerce loans. By Geography,<br />
Indonesia and Greater China loans growth is also expected<br />
to accelerate in line with the increasing focus by <strong>OCBC</strong> in<br />
these markets.<br />
CASA deposits surprise with strong q-q growth<br />
While <strong>OCBC</strong>’s Fixed Deposits continue to decline 4.7% q-q,<br />
CASA deposits surprised on the upside with a 12.3% q-q<br />
increase. We view the ability to grow sustained higher CASA<br />
deposits favorably, as it reduces <strong>OCBC</strong>’s cost of fund as it<br />
replaces the costlier Fixed Deposits.<br />
Management guides for this increase to be sticky. The USD<br />
deposits, representing an estimated 65% of new CASA<br />
deposits, were guided to be from large corporations allowing<br />
<strong>OCBC</strong> to manage some of their operating accounts. The<br />
other CASA deposits came from SMEs. This was attributed<br />
to successful building of relationships with its existing clients.<br />
Fees and Commission – Wealth Mgmt continues to grow<br />
Fee and commissions beat our forecast on higher marketrelated<br />
activities, including stronger Wealth Management<br />
and Loan-related fees. Management expects Wealth<br />
Management to continue its strong performance. Wealth<br />
Management revenue, including contributions from GE, its<br />
Bancassurance business, and Bank of Singapore, grew<br />
42.9% y-y in FY2012. Bank of Singapore’s Asset <strong>Under</strong><br />
Management grew 35% y-y, similar to previous years, while<br />
net new money also continues to increase. Together with<br />
the continued strong performances in GE and<br />
Bancassurance, likely from <strong>OCBC</strong>’s cross selling capabilities,<br />
we expect Wealth Management fees and revenue to<br />
continue its strong growth.<br />
Trading income, Profit from insurance earnings surprise<br />
Similar to third quarter’s results, Net trading income and<br />
Profit from insurance earnings continue to surprise on the<br />
upside. While these earnings are volatile, management<br />
highlighted the strong underlying contributions to these<br />
earnings. On trading income, management guided that half<br />
of the increase in earnings were from customer flows. On<br />
GE’s profit from insurance, management highlighted the<br />
growth of weighted new business premiums, indicating GE’s<br />
strong performance.
Oversea-Chinese Banking Corporation<br />
Singapore Equities Research<br />
18 February 2013<br />
For FY2013, we expect these earnings to continue being a<br />
wildcard. Our views of a more positive equity market<br />
performance lead us to be more positive on these earnings.<br />
While we expect y-y declines from a higher base, we<br />
forecast earnings above normalized levels. Trading income<br />
is expected to remain strong from customer flows and<br />
positive equity market performances, while mark-to-market<br />
higher valuations of equities of GE’s non-participating funds<br />
are expected to contribute to higher non-interest income.<br />
Credit quality expected to remain healthy<br />
NPL ratio remained low, decreasing by 5bps to 0.79%. An<br />
increase in NPL under the “Rest of the World” category<br />
pertains to a loan belonging to a company that is wholly<br />
owned and fully guaranteed by its parent company, which is<br />
geographically located in one of <strong>OCBC</strong>’s home country.<br />
Management expects credit quality to remain healthy.<br />
Overseas Branches<br />
Management has identified Indonesia and Greater China as<br />
markets that they would be more aggressively growing in.<br />
This is due to the higher rates of economic growth, and<br />
business opportunities that it sees in these markets.<br />
Management intends to commit resources, in the form of<br />
capital, management time, and transfer of knowledge to<br />
these markets. An increasing sales force would help front<br />
growth on these markets.<br />
Indonesia – While <strong>OCBC</strong> has a stronger presence in the<br />
mass segment, Management reiterated its strategy to grow<br />
the SME and Corporate banking segments. <strong>OCBC</strong> now has<br />
350 branches in Indonesia, up from 200 previously. It is now<br />
focused on enhancing revenue stream from these branches,<br />
while slowing down the opening of more branches. While<br />
Cost to Income ratio remains higher than those of the Group,<br />
this is expected to improve moving forward as it optimizes its<br />
operations. While NIMs pressure is expected to continue as<br />
competition stays intense, yields continue to be very<br />
attractive, at levels higher than those of the Group.<br />
Greater China – <strong>OCBC</strong>’s current strength is in the high end<br />
corporations. <strong>OCBC</strong> is looking towards expanding in the<br />
other areas, leveraging on its ASEAN exposure. While<br />
competition with domestic banks would be hard, its<br />
capabilities in helping companies expand overseas,<br />
especially in countries where <strong>OCBC</strong> has a presence in,<br />
gives it an edge over the domestic banks. <strong>OCBC</strong> is therefore<br />
focused only on major cities, seeking companies looking to<br />
expand overseas, and therefore establishing onshore and<br />
offshore banking relationships.<br />
Other areas<br />
Dividends<br />
<strong>OCBC</strong> announced Final dividend of S$0.17 per cent. This<br />
brings FY2012’s total dividend to S$0.33 per share, up from<br />
S$0.30 for FY2011. As previously indicated, management<br />
3 of 13<br />
did not declare a special dividend, although <strong>OCBC</strong> realized<br />
substantial gains from the sale of its investments in APB and<br />
FNN. Management guides that it intends to use non-core<br />
earnings in growing its core business. By retaining these<br />
gains, <strong>OCBC</strong> would be better able to position itself. <strong>OCBC</strong><br />
may also invest inorganically in the Indonesian and Greater<br />
China markets, or grow organically from existing business<br />
opportunities. We note that <strong>OCBC</strong>’s current dividend yield<br />
continues to be lower than that of DBS.<br />
FY2012’s performance overview, FY2013 outlook<br />
<strong>OCBC</strong> registered record-high core net profits of S$2.83<br />
billion for FY2012, an increase of 23.9% y-y. This was due<br />
to higher contributions from 1) GEH’s Profit from life<br />
assurance (FY2012: S$692m, FY2011: S$383m) due to the<br />
higher unrealized valuations of securities relating to its nonparticipating,<br />
and 2) higher Net trading income (FY2012:<br />
S$515m, FY2011: S$217m).<br />
For the purpose of comparison, excluding the effects of<br />
these two volatile items, <strong>OCBC</strong>’s core Net profit before tax<br />
(FY2012: S$2,437m, FY2011: S$2,317m). increased 5.2%<br />
y-y, which remains healthy but lower than those of DBS’s<br />
unadjusted core NPBT growth of 11.4%. This rough<br />
comparison however do not take into consideration 1) the<br />
expenses incurred in generating these revenue, 2) the<br />
recurring net trading income from higher customer flow in<br />
FY2012, and 3) the difference in effective tax rates resulting<br />
in different NPAT.<br />
This healthy growth is attributable to 1) higher Net interest<br />
income as the full effect of the strong FY2011 loans growth<br />
is registered in FY2012, 2) strong Wealth Management<br />
growth, and continued high credit quality of loans.<br />
For FY2013, Net interest income would be flatter due to<br />
lower loans growth in FY2012 and potentially in FY2013,<br />
while NIMs pressure continues. Growth would be dependant<br />
on positive direct impact and spillovers from the economic<br />
recovery in China and US. This would drive loan demands<br />
and investment needs, while benefiting the equities market.<br />
Should the economic recovery be slower than expected, we<br />
would still expect improved performance in <strong>OCBC</strong>’s more<br />
resilient domestic Indonesian operations. However, we<br />
forecast for FY2013’s core net profits to decline y-y from a<br />
high base.<br />
Valuation<br />
We factor in 4Q12 earnings, including continued NIMs<br />
pressure and higher expectations on Trading income and<br />
Profit from life assurance as we predict strong equity<br />
markets performance. Base on these adjustments, we roll<br />
over our forecast, and derive core FY2013 EPS of S$0.72,<br />
and BVPS of S$7.07. Based on an unchanged P/B multiple<br />
of 1.25X, we obtained a new target price of S$8.84. Base on<br />
current share price, we maintain our “Reduce” call.
Oversea-Chinese Banking Corporation<br />
Singapore Equities Research<br />
18 February 2013<br />
Table 1. Growth in revenue<br />
SGD mn 4Q12 4Q11 %y-y ch 3Q12 %q-q ch<br />
Net interest income 921 925 -0.4% 944 -2.4%<br />
Net fee and comm inc 304 257 18.3% 303 0.3%<br />
Profits from insurance 250<br />
Other non-interest inc 203<br />
Total 1,678<br />
85<br />
230<br />
1,497<br />
194.1% 226<br />
-11.7% 1,485<br />
12.1% 2,958<br />
4 of 13<br />
10.6%<br />
-86.3%<br />
-43.3%<br />
Table 2. Fee and commission income<br />
SGD mn 4Q12 4Q11 %y-y ch 3Q12 %q-q ch<br />
Brokerage 14 13 7.7% 16 -12.5%<br />
Wealth management 89 56 58.9% 82 8.5%<br />
Fund management 23 24 -4.2% 21 9.5%<br />
Credit card 14 13 7.7% 13 7.7%<br />
Loan-related 70 57 22.8% 64 9.4%<br />
Trade and remittances 50 49 2.0% 55 -9.1%<br />
Guarantees 5 5 0.0% 5 0.0%<br />
Investment Banking 14 12 16.7% 21 -33.3%<br />
Service charges 19 18 5.6% 18 5.6%<br />
Others 6 10 -40.0% 8 -25.0%<br />
Total Fee and Comm 304 257 18.3% 303 0.3%<br />
Table 3. Other non-interest income<br />
SGD mn 4Q12 4Q11 %y-y ch 3Q12 %q-q ch<br />
Net trading income 136 163 -16.6% 144 -5.6%<br />
Net gain on Invt securities 13 22 -40.9% 13 0.0%<br />
Disposal of properties 6 2 N.M 18 -66.7%<br />
Others 24 17 41.2% 18 33.3%<br />
Total other non int Inc 179 204 -12.3% 193 -7.3%<br />
Table 4. Loans by Industries<br />
SGD mn 4Q12 4Q11 %y-y ch 3Q12 %q-q ch<br />
Agri, mining & quarrying 4,863 4,042 20.3% 4,704 3.4%<br />
Manufacturing 8,197 8,424 -2.7% 8,546 -4.1%<br />
Building and construction 22,388 20,365 9.9% 21,254 5.3%<br />
Housing loans 37,809 32,076 17.9% 36,243 4.3%<br />
General commerce 17,502 20,347 -14.0% 17,401 0.6%<br />
Tpt, storage & comms 9,106 9,208 -1.1% 9,351 -2.6%<br />
FIs, invt & holding co 22,456 15,150 48.2% 20,823 7.8%<br />
Professionals & Pri inv 14,272 13,952 2.3% 13,869 2.9%<br />
Others 7,437 11,568 -35.7% 7,553 -1.5%<br />
Total loans 144,030 135,132 6.6% 139,744 3.1%<br />
Table 5. Loans by currencies<br />
SGD mn 4Q12 4Q11 %y-y ch 3Q12 %q-q ch<br />
Singapore dollar 70,141 61,198 14.6% 66,952 4.8%<br />
US dollar 31,680 35,716 -11.3% 30,807 2.8%<br />
Malaysian ringgit 18,404 16,724 10.0% 18,010 2.2%<br />
Indonesian rupiah 4,989 4,465 11.7% 4,760 4.8%<br />
Others 18,816 17,029 10.5% 19,215 -2.1%<br />
Total loans 144,030 135,132 6.6% 139,744 3.1%<br />
Table 6. Operating profit by Business segments<br />
SGD mn 4Q12 4Q11 %y-y ch 3Q12 %q-q ch<br />
Global Consumer/ Private Banking 149 109 36.7% 156 -4.5%<br />
Global Corporate/ Investment Banking 418 320 30.6% 422 -0.9%<br />
Global Treasury and Markets 127 231 -45.0% 178 -28.7%<br />
Insurance 243 85 185.9% 213 14.1%<br />
Others (66) 43 -253.5% (41) 61.0%<br />
Total Profit 871 788 10.5% 928 -6.1%<br />
Table 7. Profit before tax by Geographical segments<br />
SGD mn 4Q12 4Q11 %y-y ch 3Q12 %q-q ch<br />
Singapore 547 479 14.2% 595 -8.1%<br />
Malaysia 203 204 -0.5% 186 9.1%<br />
Rest of SEA 43 26 65.4% 43 0.0%<br />
Greater China 47 47 0.0% 69 -31.9%<br />
Other Asia Pacific 24 20 20.0% 28 -14.3%<br />
Rest of the World 12 (19) -163.2% 11 9.1%<br />
Total NPBT 876 757 15.7% 932 -6.0%<br />
Source (tables 1-7): Company, <strong>Phillip</strong> <strong>Securities</strong> Research
Oversea-Chinese Banking Corporation<br />
Singapore Equities Research<br />
18 February 2013<br />
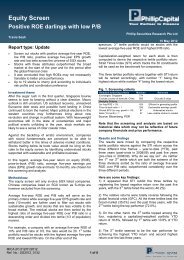
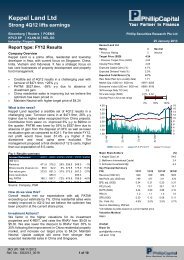
Fig 1: Net interest margin Fig 2: NonII/Total revenue<br />
1,200<br />
1,000<br />
800<br />
600<br />
400<br />
200<br />
-<br />
2.03 1.96 1.98 1.96 1.9 1.87 1.85 1.85 1.86 1.77 1.75 1.7<br />
1Q10<br />
2Q10<br />
3Q10<br />
4Q10<br />
1Q11<br />
2Q11<br />
3Q11<br />
Fig 3: Efficiency ratio Fig 4: Net profit margin<br />
800<br />
700<br />
600<br />
500<br />
400<br />
300<br />
200<br />
100<br />
-<br />
Net interest income - LHS NIM-RHS<br />
Fig 5: Deposits, Loans, LDR Fig 6: NPA, NPL<br />
180,000<br />
160,000<br />
140,000<br />
120,000<br />
100,000<br />
80,000<br />
60,000<br />
40,000<br />
20,000<br />
-<br />
Fig 7: Growth in selected asset items Fig 8: CAR<br />
250,000<br />
200,000<br />
150,000<br />
100,000<br />
50,000<br />
-<br />
36<br />
1Q10<br />
45<br />
2Q10<br />
82<br />
1Q10<br />
1Q10<br />
84<br />
42<br />
3Q10<br />
2Q10<br />
4Q11<br />
Fig 9: ROE and ROA Fig 10: EPS and NBV<br />
1Q12<br />
2Q12<br />
3Q12<br />
Expenses - LHS Ef f iciency ratio (%) - RHS<br />
87<br />
47<br />
3Q10<br />
4Q10<br />
42 44<br />
1Q11<br />
2Q11<br />
47<br />
3Q11<br />
41<br />
4Q11<br />
36<br />
1Q12<br />
43<br />
2Q12<br />
4Q12<br />
40 43<br />
3Q12<br />
4Q12<br />
Cus dep Cus loans LDR (%) - RHS<br />
85<br />
4Q10<br />
87<br />
1Q11<br />
89<br />
2Q11<br />
88 86<br />
3Q11<br />
Financial assets and investments<br />
Cash equivalents<br />
Loans to nonbank customers<br />
2Q10<br />
3Q10<br />
4Q10<br />
84 85<br />
1.8 ROE - RHS ROA - LHS<br />
1.6<br />
1.4<br />
1.2<br />
1.0<br />
0.8<br />
0.6<br />
0.4<br />
15.3<br />
1Q10<br />
1Q11<br />
2Q11<br />
3Q11<br />
12.0 12.2<br />
10.9<br />
11.4 11.2<br />
10.3<br />
9.8<br />
2Q10<br />
3Q10<br />
4Q10<br />
1Q11<br />
2Q11<br />
3Q11<br />
4Q11<br />
4Q11<br />
4Q11<br />
14.7<br />
1Q12<br />
1Q12<br />
1Q12<br />
2Q12<br />
2Q12<br />
88 86<br />
3Q12<br />
3Q12<br />
12.8<br />
11.6<br />
11.2<br />
2Q12<br />
3Q12<br />
4Q12<br />
4Q12<br />
3.50<br />
3.00<br />
2.50<br />
2.00<br />
1.50<br />
1.00<br />
0.50<br />
0.00<br />
65<br />
55<br />
45<br />
35<br />
25<br />
15<br />
5<br />
4Q12<br />
18.0<br />
16.0<br />
14.0<br />
12.0<br />
10.0<br />
8.0<br />
6.0<br />
-5<br />
95<br />
90<br />
85<br />
80<br />
75<br />
3,000<br />
2,500<br />
2,000<br />
1,500<br />
1,000<br />
500<br />
-<br />
900<br />
800<br />
700<br />
600<br />
500<br />
400<br />
300<br />
200<br />
100<br />
-<br />
1.6<br />
1.4<br />
1.2<br />
1.0<br />
0.8<br />
0.6<br />
0.4<br />
0.2<br />
-<br />
20<br />
15<br />
10<br />
5<br />
-<br />
100.0<br />
90.0<br />
80.0<br />
70.0<br />
60.0<br />
50.0<br />
40.0<br />
30.0<br />
20.0<br />
5 of 13<br />
49<br />
1Q10<br />
49<br />
1Q10<br />
42<br />
2Q10<br />
41 41<br />
2Q10<br />
1.5 1.3<br />
1Q10<br />
1Q10<br />
2Q10<br />
45<br />
3Q10<br />
1.1<br />
3Q10<br />
3Q10<br />
38<br />
42 44<br />
4Q10<br />
44<br />
1Q11<br />
41<br />
2Q11<br />
Non-interest income - LHS<br />
NonII/total income (%) - RHS<br />
33<br />
3Q11<br />
38<br />
41 39 40<br />
4Q11<br />
45 44 45<br />
39<br />
1Q12<br />
2Q12<br />
3Q12<br />
Net profit - LHS Net prof it margin (%) 63-<br />
RHS<br />
4Q10<br />
1Q11<br />
2Q11<br />
3Q11<br />
0.9 0.9 0.8 0.7<br />
4Q10<br />
1Q11<br />
2Q11<br />
3Q11<br />
4Q11<br />
1Q12<br />
46 42<br />
2Q12<br />
3Q12<br />
4Q12<br />
40<br />
4Q12<br />
NPL (%) - RHS Total cumulative impairment as % of NPA<br />
2Q10<br />
3Q10<br />
4Q10<br />
1Q11<br />
2Q11<br />
3Q11<br />
1.0<br />
0.9 0.9 0.8 0.8<br />
4Q11<br />
4Q11<br />
1Q12<br />
1Q12<br />
2Q12<br />
2Q12<br />
3Q12<br />
4Q12<br />
Tier 1 CAR Total CAR<br />
3Q12<br />
5.51 5.48 5.55 5.66 5.89 5.86 5.82 6.02<br />
6.32 6.33 6.43<br />
6.68<br />
70<br />
60<br />
50<br />
40<br />
30<br />
20<br />
10<br />
0<br />
65<br />
55<br />
45<br />
35<br />
25<br />
15<br />
5<br />
-5<br />
1.6<br />
1.4<br />
1.2<br />
1.0<br />
0.8<br />
0.6<br />
0.4<br />
0.2<br />
0.0<br />
Diluted NAV - RHS Diluted EPS exclude extra items - LHS<br />
7.50<br />
4Q12<br />
7.00<br />
6.50<br />
6.00<br />
5.50<br />
5.00<br />
4.50
Oversea-Chinese Banking Corporation<br />
Singapore Equities Research<br />
18 February 2013<br />
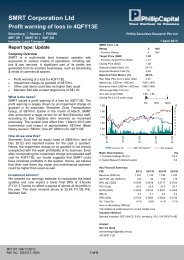
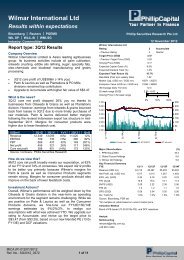
Fig 11: Profit before tax by geographical segment Fig 12: Geo segment breakdown<br />
700<br />
600<br />
500<br />
400<br />
300<br />
200<br />
100<br />
-<br />
(100)<br />
Singapore Malaysia Rest of<br />
SEA<br />
Growth trend<br />
Fig 13: Operating profit by Business segment Fig 14: Net interest income trend<br />
Fig 15: Fee and Commission trend Fig 16: Other noninterest income trend<br />
350<br />
300<br />
250<br />
200<br />
150<br />
100<br />
-<br />
600<br />
500<br />
400<br />
300<br />
200<br />
100<br />
-<br />
(100)<br />
50<br />
1Q10<br />
2Q10<br />
3Q10<br />
4Q10<br />
Fig 17: Profit from insurance<br />
300<br />
250<br />
200<br />
150<br />
100<br />
-<br />
50<br />
Global<br />
Consumer/<br />
Private<br />
Bking<br />
1Q10<br />
2Q10<br />
3Q10<br />
Global<br />
Corp/ Invt<br />
Banking<br />
4Q10<br />
1Q11<br />
Global<br />
Treasury<br />
and<br />
Markets<br />
2Q11<br />
Greater<br />
China<br />
3Q11<br />
4Q11<br />
Other<br />
Apac<br />
1Q12<br />
2Q12<br />
ROW<br />
Insurance Others<br />
Net fee and commission income SMA<br />
1Q11<br />
2Q11<br />
3Q11<br />
4Q11<br />
1Q12<br />
2Q12<br />
3Q12<br />
Profit from insurance SMA<br />
3Q12<br />
4Q12<br />
4Q12<br />
1,200<br />
1,000<br />
-<br />
800<br />
600<br />
400<br />
200<br />
-<br />
350<br />
300<br />
250<br />
200<br />
150<br />
100<br />
50<br />
6 of 13<br />
Greater Other Apac,<br />
China, 47 ,<br />
5%<br />
24 , 3%<br />
Rest of SEA,<br />
43 , 5%<br />
Malaysia, 203<br />
, 23%<br />
Income Statement<br />
(Extract) 4Q12 F 4Q12 A Diff Diff (%) Comments<br />
Int Income 1,503 1,466 (37) -2% Lower yields on interbank assets<br />
Int Expense 576 545 (31) -5% Lower cost of deposits<br />
Net Int Inc 926 921 (5) -1%<br />
Fees & Comm 284 304 20 7% Higher market-related fees<br />
Profit from life assurance 84 210 126 150% Higher Non-par fund contribution<br />
Premium income 36 40 4 11%<br />
Other Int inc 129 203 74 57% Higher net trading income<br />
Non Int inc 533 757 224 42%<br />
Revenue 1,460 1,678 218 15%<br />
Expenses 692 724 32 5% Within expectations<br />
Amor/Imp chg 59 68 9 14% Within expectations<br />
Tax 108 156 48 45% Higher PBT<br />
Net income 538 663 125 23% Beat on trading, Non-par funds<br />
1Q10<br />
1Q10<br />
2Q10<br />
2Q10<br />
3Q10<br />
3Q10<br />
4Q10<br />
4Q10<br />
1Q11<br />
1Q11<br />
2Q11<br />
2Q11<br />
ROW, 12 ,<br />
1%<br />
3Q11<br />
3Q11<br />
Singapore,<br />
547 , 63%<br />
Net interest income SMA<br />
4Q11<br />
4Q11<br />
1Q12<br />
1Q12<br />
2Q12<br />
2Q12<br />
3Q12<br />
Other noninterest income trend SMA<br />
3Q12<br />
4Q12<br />
4Q12
Oversea-Chinese Banking Corporation<br />
Singapore Equities Research<br />
18 February 2013<br />
FYE Dec FY10 FY11 FY12 FY13F FY14F<br />
Valuation Ratios<br />
P/E (X), adj. 13.8 13.9 11.4 12.6 11.7<br />
P/B (X) 1.6 1.5 1.4 1.3 1.2<br />
Dividend Yield (%) 3.3% 3.3% 3.6% 3.6% 3.6%<br />
Per share data (SGD)<br />
EPS, reported 0.66 0.66 1.13 0.72 0.78<br />
EPS, adj. 0.66 0.66 0.79 0.72 0.78<br />
DPS 0.30 0.30 0.33 0.33 0.33<br />
BVPS 5.66 6.02 6.68 7.07 7.52<br />
Growth & Margins (%)<br />
Growth<br />
Net interest income 4.3% 15.7% 9.9% -0.2% 4.8%<br />
Non interest income 19.5% -5.3% 87.2% -36.5% 7.0%<br />
Pre provision operating profit 10.6% 6.3% 40.6% -19.4% 5.7%<br />
Operating income 13.3% 2.3% 67.3% -32.8% 6.9%<br />
Net income, reported 14.9% 2.6% 72.7% -34.3% 6.9%<br />
Net income, adj 14.9% 1.2% 23.9% -7.2% 6.9%<br />
Margins<br />
Net interest margin 1.98% 1.87% 1.77% 1.68% 1.68%<br />
Key Ratios (%)<br />
ROE 12.5% 11.5% 13.0% 11.1% 10.9%<br />
ROA (exclude life assurance fund invt) 1.30% 1.07% 1.16% 1.01% 1.02%<br />
RORWA 2.2% 2.0% 2.2% 2.0% 2.1%<br />
Non-interest/total income ratio 44.7% 39.8% 52.9% 41.7% 42.2%<br />
Cost/income ratio 42.3% 42.9% 33.9% 43.6% 43.3%<br />
Loan/deposit ratio 85.1% 86.4% 86.2% 87.2% 86.9%<br />
NPL ratio 0.93 0.87 0.79 0.86 0.91<br />
Incom e Statem ent (SGD mn)<br />
Net Interest Income 2,947 3,410 3,747 3,740 3,920<br />
Fees and Commission 987 1,137 1,198 1,270 1,333<br />
Other Non interest income 1,391 1,114 3,015 1,408 1,532<br />
Total operating income 5,325 5,661 7,960 6,417 6,785<br />
Operating expenses 2,254 2,430 2,695 2,795 2,936<br />
Provisions 189 283 332 309 309<br />
Operating profit 2,882 2,948 4,933 3,313 3,541<br />
Associates & JVs (2) 8 27 8 8<br />
Profit Before Tax 2,880 2,956 4,960 3,321 3,549<br />
Taxation 433 478 698 531 568<br />
Profit After Tax 2,447 2,478 4,262 2,790 2,981<br />
Non-controlling Interest 193 166 269 167 179<br />
Net Income, reported 2,254 2,312 3,993 2,622 2,802<br />
Net Income, adj. 2,254 2,280 2,825 2,622 2,802<br />
Source: PSR<br />
7 of 13
Oversea-Chinese Banking Corporation<br />
Singapore Equities Research<br />
18 February 2013<br />
FYE Dec FY10 FY11 FY12 FY13F FY14F<br />
Balance Sheet (SGD mn)<br />
Cash, balances and placements w ith central banks 11,493 12,897 16,397 14,363 16,923<br />
Singapore Government treasury bills and securities 11,156 13,250 13,141 13,433 13,551<br />
Other government treasury bills and securities 5,944 7,397 9,157 9,803 9,888<br />
Placements and balances w ith banks 18,569 28,615 29,811 30,481 31,014<br />
Debt and equity securities 14,255 15,081 14,932 13,070 13,185<br />
Assets pledged 746 1,839 2,056 2,056 2,056<br />
Assets held for sale 4 6 5 5 5<br />
Derivative receivables 4,837 5,899 5,155 5,615 5,713<br />
Other assets 3,116 3,191 3,845 4,011 4,081<br />
Loans and bills receivable 104,989 133,557 142,376 151,831 158,994<br />
Deferred tax 79 44 43 43 43<br />
Associates and JV 255 361 355 355 355<br />
PPE 1,625 1,664 1,703 1,762 1,841<br />
Investment property 733 922 878 949 991<br />
Goodw ill and intangible assets 3,996 3,947 3,818 3,772 3,726<br />
Life assurance fund investment assets 47,486 49,088 52,271 53,839 55,454<br />
Total Assets 229,283 277,758 295,943 305,387 317,819<br />
Deposits of non-bank customers 123,300 154,555 165,139 174,110 182,906<br />
Deposits and balances of banks 16,508 21,653 25,656 23,034 23,336<br />
Due to associates 139 178 161 161 161<br />
Trading Portfolio liabilities 1,734 1,655 1,083 1,083 1,083<br />
Derivative payables 4,563 6,113 5,001 5,001 5,001<br />
Other liabilities 3,187 4,024 4,324 4,324 4,324<br />
Current tax 745 800 897 897 897<br />
Deferred tax 1,127 1,123 1,170 1,170 1,170<br />
Debts issued 6,854 13,063 11,424 11,424 11,424<br />
Life assurance fund liabilites 47,481 49,204 52,387 53,959 55,577<br />
Total liabilities 205,638 252,368 267,242 275,162 285,879<br />
Share Capital 6,315 7,127 7,057 7,057 7,057<br />
Preference shares 1,896 1,896 2,896 2,896 2,896<br />
Retained earnings 10,592 12,144 14,580 15,936 17,473<br />
Capital reserves 613 279 376 376 376<br />
FV reserves 1,374 1,125 895 895 895<br />
Shareholder's equity 20,790 22,571 25,804 27,160 28,697<br />
Non-controlling interest 2,855 2,819 2,897 3,064 3,243<br />
Total Equity 23,645 25,390 28,701 30,225 31,940<br />
Cashflow Statements (SGD m n)<br />
CFO<br />
PBT 2,880<br />
Adjustments 353<br />
Cash from ops before WC changes 3,233<br />
WC changes 54<br />
Cash generated from ops 3,287<br />
Taxes paid, net (420)<br />
Cashflow from ops 2,867<br />
Cashflow from investm ents (4,523)<br />
Cashflow from financing (44)<br />
Net change in cash (1,679)<br />
CCE, end 11,494<br />
2,956<br />
507<br />
3,463<br />
(5,639)<br />
(2,176)<br />
(409)<br />
(2,585)<br />
(1,895)<br />
5,883<br />
1,404<br />
12,898<br />
8 of 13<br />
4,960<br />
(714)<br />
4,246<br />
1,172<br />
5,418<br />
(639)<br />
4,779<br />
863<br />
(1,944)<br />
3,500<br />
16,398<br />
3,321<br />
490<br />
3,811<br />
(3,723)<br />
88<br />
(531)<br />
(443)<br />
(325)<br />
(1,266)<br />
(2,034)<br />
14,364<br />
742<br />
106<br />
848<br />
(4,158)<br />
(3,310)<br />
(193)<br />
(3,503)<br />
(261)<br />
1,310<br />
(2,515)<br />
11,161<br />
Supplementary items<br />
Risk-w eighted assets (SGD mn) 105,062 128,507 129,647 131,344 130,663<br />
Tier 1 capital (SGD mn) 17,148 18,612 21,591 22,947 24,484<br />
Total capital (SGD mn) 18,508 20,186 24,110 25,466 27,003<br />
Core Tier 1 CAR (%) 12.6% 11.4% 12.8% 13.7% 14.9%<br />
Tier 1 CAR (%) 16.3% 14.5% 16.7% 17.5% 18.7%<br />
Total CAR (%)<br />
Source: PSR<br />
17.6% 15.7% 18.6% 19.4% 20.7%
Oversea-Chinese Banking Corporation<br />
Singapore Equities Research<br />
18 February 2013<br />
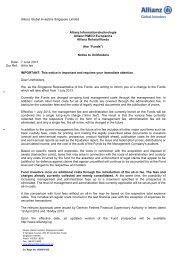
Ratings History<br />
11<br />
10.5<br />
10<br />
9.5<br />
9<br />
8.5<br />
8<br />
7.5<br />
7<br />
6.5<br />
1<br />
2<br />
3<br />
4<br />
5<br />
Dec-10<br />
Mar-11<br />
Market Price<br />
Target Price<br />
Jun-11<br />
Sep-11<br />
Dec-11<br />
Source: Bloomberg, PSR<br />
PSR Rating System<br />
Total Returns Recommendation Rating<br />
> +20% Buy 1<br />
+5% to +20% Accumulate 2<br />
-5% to +5% Neutral 3<br />
-5% to -20% Reduce 4<br />
< -20%<br />
Remarks<br />
Sell 5<br />
We do not base our recommendations entirely on the above quantitative return bands.<br />
We consider qualitative factors like (but not limited to) a stock's risk rew ard profile, market<br />
sentiment, recent rate of share price appreciation, presence or absence of stock price<br />
catalysts, and speculative undertones surrounding the stock, before making our final<br />
recommendation<br />
Mar-12<br />
Jun-12<br />
Sep-12<br />
Dec-12<br />
9 of 13<br />
Mar-13<br />
Jun-13
Oversea-Chinese Banking Corporation<br />
Singapore Equities Research<br />
18 February 2013<br />
Important Information<br />
This publication is prepared by <strong>Phillip</strong> <strong>Securities</strong> Research <strong>Pte</strong> <strong>Ltd</strong>., 250 North Bridge Road, #06-00, Raffles City<br />
Tower, Singapore 179101 (Registration Number: 198803136N), which is regulated by the Monetary Authority of<br />
Singapore (“<strong>Phillip</strong> <strong>Securities</strong> Research”). By receiving or reading this publication, you agree to be bound by the terms<br />
and limitations set out below.<br />
This publication has been provided to you for personal use only and shall not be reproduced, distributed or published<br />
by you in whole or in part, for any purpose. If you have received this document by mistake, please delete or destroy it,<br />
and notify the sender immediately. <strong>Phillip</strong> <strong>Securities</strong> Research shall not be liable for any direct or consequential loss<br />
arising from any use of material contained in this publication.<br />
The information contained in this publication has been obtained from public sources, which <strong>Phillip</strong> <strong>Securities</strong> Research<br />
has no reason to believe are unreliable and any analysis, forecasts, projections, expectations and opinions<br />
(collectively, the “Research”) contained in this publication are based on such information and are expressions of belief<br />
of the individual author or the indicated source (as applicable) only. <strong>Phillip</strong> <strong>Securities</strong> Research has not verified this<br />
information and no representation or warranty, express or implied, is made that such information or Research is<br />
accurate, complete, appropriate or verified or should be relied upon as such. Any such information or Research<br />
contained in this publication is subject to change, and <strong>Phillip</strong> <strong>Securities</strong> Research shall not have any responsibility to<br />
maintain or update the information or Research made available or to supply any corrections, updates or releases in<br />
connection therewith. In no event will <strong>Phillip</strong> <strong>Securities</strong> Research or persons associated with or connected to <strong>Phillip</strong><br />
<strong>Securities</strong> Research, including but not limited its officers, directors, employees or persons involved in the preparation<br />
or issuance of this report, (i) be liable in any manner whatsoever for any consequences (including but not limited to<br />
any special, direct, indirect, incidental or consequential losses, loss of profits and damages) of any reliance or usage<br />
of this publication or (ii) accept any legal responsibility from any person who receives this publication, even if it has<br />
been advised of the possibility of such damages. You must make the final investment decision and accept all<br />
responsibility for your investment decision, including, but not limited to your reliance on the information, data and/or<br />
other materials presented in this publication.<br />
Any opinions, forecasts, assumptions, estimates, valuations and prices contained in this material are as of the date<br />
indicated and are subject to change at any time without prior notice.<br />
Past performance of any product referred to in this publication is not indicative of future results.<br />
This report does not constitute, and should not be used as a substitute for, tax, legal or investment advice. This<br />
publication should not be relied upon exclusively or as authoritative, without further being subject to the recipient’s own<br />
independent verification and exercise of judgment. The fact that this publication has been made available constitutes<br />
neither a recommendation to enter into a particular transaction, nor a representation that any product described in this<br />
material is suitable or appropriate for the recipient. Recipients should be aware that many of the products, which may<br />
be described in this publication involve significant risks and may not be suitable for all investors, and that any decision<br />
to enter into transactions involving such products should not be made, unless all such risks are understood and an<br />
independent determination has been made that such transactions would be appropriate. Any discussion of the risks<br />
contained herein with respect to any product should not be considered to be a disclosure of all risks or a complete<br />
discussion of such risks.<br />
Nothing in this report shall be construed to be an offer or solicitation for the purchase or sale of any product. Any<br />
decision to purchase any product mentioned in this research should take into account existing public information,<br />
including any registered prospectus in respect of such product.<br />
<strong>Phillip</strong> <strong>Securities</strong> Research, or persons associated with or connected to <strong>Phillip</strong> <strong>Securities</strong> Research, including but not<br />
limited to its officers, directors, employees or persons involved in the preparation or issuance of this report, may<br />
provide an array of financial services to a large number of corporations in Singapore and worldwide, including but not<br />
limited to commercial / investment banking activities (including sponsorship, financial advisory or underwriting<br />
activities), brokerage or securities trading activities. <strong>Phillip</strong> <strong>Securities</strong> Research, or persons associated with or<br />
connected to <strong>Phillip</strong> <strong>Securities</strong> Research, including but not limited to its officers, directors, employees or persons<br />
involved in the preparation or issuance of this report, may have participated in or invested in transactions with the<br />
issuer(s) of the securities mentioned in this publication, and may have performed services for or solicited business<br />
from such issuers. Additionally, <strong>Phillip</strong> <strong>Securities</strong> Research, or persons associated with or connected to <strong>Phillip</strong><br />
<strong>Securities</strong> Research, including but not limited to its officers, directors, employees or persons involved in the<br />
10 of 13
Oversea-Chinese Banking Corporation<br />
Singapore Equities Research<br />
18 February 2013<br />
preparation or issuance of this report, may have provided advice or investment services to such companies and<br />
investments or related investments, as may be mentioned in this publication.<br />
<strong>Phillip</strong> <strong>Securities</strong> Research or persons associated with or connected to <strong>Phillip</strong> <strong>Securities</strong> Research, including but not<br />
limited to its officers, directors, employees or persons involved in the preparation or issuance of this report may, from<br />
time to time maintain a long or short position in securities referred to herein, or in related futures or options, purchase<br />
or sell, make a market in, or engage in any other transaction involving such securities, and earn brokerage or other<br />
compensation in respect of the foregoing. Investments will be denominated in various currencies including US dollars<br />
and Euro and thus will be subject to any fluctuation in exchange rates between US dollars and Euro or foreign<br />
currencies and the currency of your own jurisdiction. Such fluctuations may have an adverse effect on the value, price<br />
or income return of the investment.<br />
To the extent permitted by law, <strong>Phillip</strong> <strong>Securities</strong> Research, or persons associated with or connected to <strong>Phillip</strong><br />
<strong>Securities</strong> Research, including but not limited to its officers, directors, employees or persons involved in the<br />
preparation or issuance of this report, may at any time engage in any of the above activities as set out above or<br />
otherwise hold a interest, whether material or not, in respect of companies and investments or related investments,<br />
which may be mentioned in this publication. Accordingly, information may be available to <strong>Phillip</strong> <strong>Securities</strong> Research,<br />
or persons associated with or connected to <strong>Phillip</strong> <strong>Securities</strong> Research, including but not limited to its officers,<br />
directors, employees or persons involved in the preparation or issuance of this report, which is not reflected in this<br />
material, and <strong>Phillip</strong> <strong>Securities</strong> Research, or persons associated with or connected to <strong>Phillip</strong> <strong>Securities</strong> Research,<br />
including but not limited to its officers, directors, employees or persons involved in the preparation or issuance of this<br />
report, may, to the extent permitted by law, have acted upon or used the information prior to or immediately following<br />
its publication. <strong>Phillip</strong> <strong>Securities</strong> Research, or persons associated with or connected to <strong>Phillip</strong> <strong>Securities</strong> Research,<br />
including but not limited its officers, directors, employees or persons involved in the preparation or issuance of this<br />
report, may have issued other material that is inconsistent with, or reach different conclusions from, the contents of<br />
this material.<br />
The information, tools and material presented herein are not directed, intended for distribution to or use by, any person<br />
or entity in any jurisdiction or country where such distribution, publication, availability or use would be contrary to the<br />
applicable law or regulation or which would subject <strong>Phillip</strong> <strong>Securities</strong> Research to any registration or licensing or other<br />
requirement, or penalty for contravention of such requirements within such jurisdiction.<br />
Section 27 of the Financial Advisers Act (Cap. 110) of Singapore and the MAS Notice on Recommendations on<br />
Investment Products (FAA-N01) do not apply in respect of this publication.<br />
This material is intended for general circulation only and does not take into account the specific investment objectives,<br />
financial situation or particular needs of any particular person. The products mentioned in this material may not be<br />
suitable for all investors and a person receiving or reading this material should seek advice from a professional and<br />
financial adviser regarding the legal, business, financial, tax and other aspects including the suitability of such<br />
products, taking into account the specific investment objectives, financial situation or particular needs of that person,<br />
before making a commitment to invest in any of such products.<br />
Please contact <strong>Phillip</strong> <strong>Securities</strong> Research at [65 65311240] in respect of any matters arising from, or in connection<br />
with, this document.<br />
This report is only for the purpose of distribution in Singapore.<br />
11 of 13
Oversea-Chinese Banking Corporation<br />
Singapore Equities Research<br />
18 February 2013<br />
Contact Information (Singapore Research Team)<br />
Chan Wai Chee Joshua Tan Derrick Heng<br />
CEO, Research Head of Research Deputy Head of Research<br />
Special Opportunities Global Macro, Asset Strategy<br />
SG Equity Strategist &<br />
Transport<br />
+65 6531 1231 +65 6531 1249 +65 6531 1221<br />
yebo@phillip.com.sg joshuatan@phillip.com.sg derrickhengch@phillip.com.sg<br />
Go Choon Koay, Bryan Travis Seah Ken Ang<br />
Investment Analyst Investment Analyst Investment Analyst<br />
Property REITs Financials, Telecoms<br />
+65 6531 1792 +65 6531 1229 +65 6531 1793<br />
gock@phillip.com.sg travisseahhk@phillip.com.sg kenangwy@phillip.com.sg<br />
Ng Weiwen Roy Chen Nicholas Ong<br />
Macro Analyst Macro Analyst Investment Analyst<br />
Global Macro, Asset Strategy Global Macro, Asset Strategy Commodities, Offshore & Marine<br />
+65 6531 1735 +65 6531 1535 +65 6531 5440<br />
ngww@phillip.com.sg roychencz@phillip.com.sg nicholasonghg@phillip.com.sg<br />
Research Assistant<br />
General Enquiries<br />
+65 6531 1240 (Phone)<br />
research@phillip.com.sg<br />
12 of 13
Oversea-Chinese Banking Corporation<br />
Singapore Equities Research<br />
18 February 2013<br />
Contact Information (Regional Member Companies)<br />
SINGAPORE<br />
<strong>Phillip</strong> <strong>Securities</strong> <strong>Pte</strong> <strong>Ltd</strong><br />
Raffles City Tower<br />
250, North Bridge Road #06-00<br />
Singapore 179101<br />
Tel +65 6533 6001<br />
Fax +65 6535 6631<br />
Website: www.poems.com.sg<br />
HONG KONG<br />
<strong>Phillip</strong> <strong>Securities</strong> (HK) <strong>Ltd</strong><br />
Exchange Participant of the Stock Exchange of Hong Kong<br />
11/F United Centre 95 Queensway<br />
Hong Kong<br />
Tel +852 2277 6600<br />
Fax +852 2868 5307<br />
Websites: www.phillip.com.hk<br />
INDONESIA<br />
PT <strong>Phillip</strong> <strong>Securities</strong> Indonesia<br />
ANZ Tower Level 23B,<br />
Jl Jend Sudirman Kav 33A<br />
Jakarta 10220 – Indonesia<br />
Tel +62-21 5790 0800<br />
Fax +62-21 5790 0809<br />
Website: www.phillip.co.id<br />
THAILAND<br />
<strong>Phillip</strong> <strong>Securities</strong> (Thailand) Public Co. <strong>Ltd</strong><br />
15th Floor, Vorawat Building,<br />
849 Silom Road, Silom, Bangrak,<br />
Bangkok 10500 Thailand<br />
Tel +66-2 6351700 / 22680999<br />
Fax +66-2 22680921<br />
Website www.phillip.co.th<br />
UNITED KINGDOM<br />
King & Shaxson Capital Limited<br />
6th Floor, Candlewick House,<br />
120 Cannon Street,<br />
London, EC4N 6AS<br />
Tel +44-20 7426 5950<br />
Fax +44-20 7626 1757<br />
Website: www.kingandshaxson.com<br />
AUSTRALIA<br />
<strong>Phillip</strong>Capital<br />
Level 12, 15 William Street,<br />
Melbourne, Victoria 3000, Australia<br />
Tel +61-03 9629 8288<br />
Fax +61-03 9629 8882<br />
Website: www.phillipcapital.com.au<br />
13 of 13<br />
MALAYSIA<br />
<strong>Phillip</strong> Capital Management Sdn Bhd<br />
B-3-6 Block B Level 3 Megan Avenue II,<br />
No. 12, Jalan Yap Kwan Seng, 50450<br />
Kuala Lumpur<br />
Tel +603 2162 8841<br />
Fax +603 2166 5099<br />
Website: www.poems.com.my<br />
JAPAN<br />
<strong>Phillip</strong> <strong>Securities</strong> Japan, <strong>Ltd</strong>.<br />
4-2 Nihonbashi Kabuto-cho Chuo-ku,<br />
Tokyo 103-0026<br />
Tel +81-3 3666 2101<br />
Fax +81-3 3666 6090<br />
Website:www.phillip.co.jp<br />
CHINA<br />
<strong>Phillip</strong> Financial Advisory (Shanghai) Co. <strong>Ltd</strong><br />
No 550 Yan An East Road,<br />
Ocean Tower Unit 2318,<br />
Postal code 200001<br />
Tel +86-21 5169 9200<br />
Fax +86-21 6351 2940<br />
Website: www.phillip.com.cn<br />
FRANCE<br />
King & Shaxson Capital Limited<br />
3rd Floor, 35 Rue de la Bienfaisance 75008<br />
Paris France<br />
Tel +33-1 45633100<br />
Fax +33-1 45636017<br />
Website: www.kingandshaxson.com<br />
UNITED STATES<br />
<strong>Phillip</strong> Futures Inc<br />
141 W Jackson Blvd Ste 3050<br />
The Chicago Board of Trade Building<br />
Chicago, IL 60604 USA<br />
Tel +1-312 356 9000<br />
Fax +1-312 356 9005