OCBC - Under Construction Home - Phillip Securities Pte Ltd
OCBC - Under Construction Home - Phillip Securities Pte Ltd
OCBC - Under Construction Home - Phillip Securities Pte Ltd

You also want an ePaper? Increase the reach of your titles
YUMPU automatically turns print PDFs into web optimized ePapers that Google loves.
Oversea-Chinese Banking Corporation<br />
Singapore Equities Research<br />
18 February 2013<br />
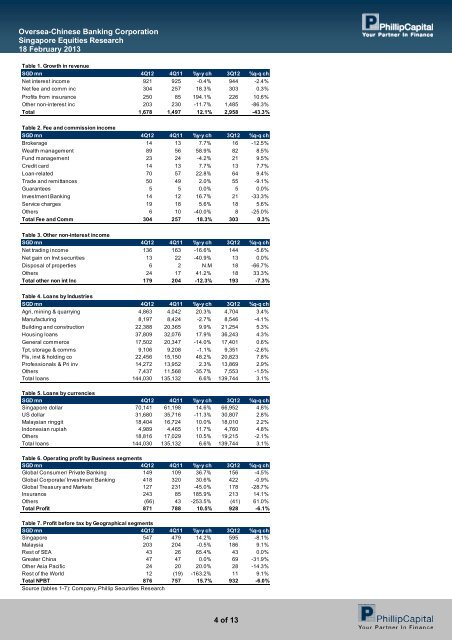
Table 1. Growth in revenue<br />
SGD mn 4Q12 4Q11 %y-y ch 3Q12 %q-q ch<br />
Net interest income 921 925 -0.4% 944 -2.4%<br />
Net fee and comm inc 304 257 18.3% 303 0.3%<br />
Profits from insurance 250<br />
Other non-interest inc 203<br />
Total 1,678<br />
85<br />
230<br />
1,497<br />
194.1% 226<br />
-11.7% 1,485<br />
12.1% 2,958<br />
4 of 13<br />
10.6%<br />
-86.3%<br />
-43.3%<br />
Table 2. Fee and commission income<br />
SGD mn 4Q12 4Q11 %y-y ch 3Q12 %q-q ch<br />
Brokerage 14 13 7.7% 16 -12.5%<br />
Wealth management 89 56 58.9% 82 8.5%<br />
Fund management 23 24 -4.2% 21 9.5%<br />
Credit card 14 13 7.7% 13 7.7%<br />
Loan-related 70 57 22.8% 64 9.4%<br />
Trade and remittances 50 49 2.0% 55 -9.1%<br />
Guarantees 5 5 0.0% 5 0.0%<br />
Investment Banking 14 12 16.7% 21 -33.3%<br />
Service charges 19 18 5.6% 18 5.6%<br />
Others 6 10 -40.0% 8 -25.0%<br />
Total Fee and Comm 304 257 18.3% 303 0.3%<br />
Table 3. Other non-interest income<br />
SGD mn 4Q12 4Q11 %y-y ch 3Q12 %q-q ch<br />
Net trading income 136 163 -16.6% 144 -5.6%<br />
Net gain on Invt securities 13 22 -40.9% 13 0.0%<br />
Disposal of properties 6 2 N.M 18 -66.7%<br />
Others 24 17 41.2% 18 33.3%<br />
Total other non int Inc 179 204 -12.3% 193 -7.3%<br />
Table 4. Loans by Industries<br />
SGD mn 4Q12 4Q11 %y-y ch 3Q12 %q-q ch<br />
Agri, mining & quarrying 4,863 4,042 20.3% 4,704 3.4%<br />
Manufacturing 8,197 8,424 -2.7% 8,546 -4.1%<br />
Building and construction 22,388 20,365 9.9% 21,254 5.3%<br />
Housing loans 37,809 32,076 17.9% 36,243 4.3%<br />
General commerce 17,502 20,347 -14.0% 17,401 0.6%<br />
Tpt, storage & comms 9,106 9,208 -1.1% 9,351 -2.6%<br />
FIs, invt & holding co 22,456 15,150 48.2% 20,823 7.8%<br />
Professionals & Pri inv 14,272 13,952 2.3% 13,869 2.9%<br />
Others 7,437 11,568 -35.7% 7,553 -1.5%<br />
Total loans 144,030 135,132 6.6% 139,744 3.1%<br />
Table 5. Loans by currencies<br />
SGD mn 4Q12 4Q11 %y-y ch 3Q12 %q-q ch<br />
Singapore dollar 70,141 61,198 14.6% 66,952 4.8%<br />
US dollar 31,680 35,716 -11.3% 30,807 2.8%<br />
Malaysian ringgit 18,404 16,724 10.0% 18,010 2.2%<br />
Indonesian rupiah 4,989 4,465 11.7% 4,760 4.8%<br />
Others 18,816 17,029 10.5% 19,215 -2.1%<br />
Total loans 144,030 135,132 6.6% 139,744 3.1%<br />
Table 6. Operating profit by Business segments<br />
SGD mn 4Q12 4Q11 %y-y ch 3Q12 %q-q ch<br />
Global Consumer/ Private Banking 149 109 36.7% 156 -4.5%<br />
Global Corporate/ Investment Banking 418 320 30.6% 422 -0.9%<br />
Global Treasury and Markets 127 231 -45.0% 178 -28.7%<br />
Insurance 243 85 185.9% 213 14.1%<br />
Others (66) 43 -253.5% (41) 61.0%<br />
Total Profit 871 788 10.5% 928 -6.1%<br />
Table 7. Profit before tax by Geographical segments<br />
SGD mn 4Q12 4Q11 %y-y ch 3Q12 %q-q ch<br />
Singapore 547 479 14.2% 595 -8.1%<br />
Malaysia 203 204 -0.5% 186 9.1%<br />
Rest of SEA 43 26 65.4% 43 0.0%<br />
Greater China 47 47 0.0% 69 -31.9%<br />
Other Asia Pacific 24 20 20.0% 28 -14.3%<br />
Rest of the World 12 (19) -163.2% 11 9.1%<br />
Total NPBT 876 757 15.7% 932 -6.0%<br />
Source (tables 1-7): Company, <strong>Phillip</strong> <strong>Securities</strong> Research