CONTRIBUTION TO GEOMETRIC MORPHOMETRICS ...
CONTRIBUTION TO GEOMETRIC MORPHOMETRICS ...
CONTRIBUTION TO GEOMETRIC MORPHOMETRICS ...

You also want an ePaper? Increase the reach of your titles
YUMPU automatically turns print PDFs into web optimized ePapers that Google loves.
86<br />
Ber. Inst. Erdwiss. K.-F.-Univ. Graz ISSN 1608-8166 Band 13 Graz 2008<br />
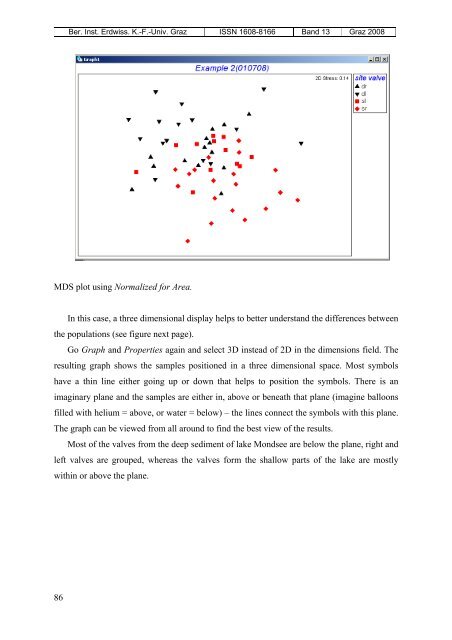
MDS plot using Normalized for Area.<br />
In this case, a three dimensional display helps to better understand the differences between<br />
the populations (see figure next page).<br />
Go Graph and Properties again and select 3D instead of 2D in the dimensions field. The<br />
resulting graph shows the samples positioned in a three dimensional space. Most symbols<br />
have a thin line either going up or down that helps to position the symbols. There is an<br />
imaginary plane and the samples are either in, above or beneath that plane (imagine balloons<br />
filled with helium = above, or water = below) – the lines connect the symbols with this plane.<br />
The graph can be viewed from all around to find the best view of the results.<br />
Most of the valves from the deep sediment of lake Mondsee are below the plane, right and<br />
left valves are grouped, whereas the valves form the shallow parts of the lake are mostly<br />
within or above the plane.