Buckling of thin-walled conical shells under uniform external pressure
Buckling of thin-walled conical shells under uniform external pressure
Buckling of thin-walled conical shells under uniform external pressure

Create successful ePaper yourself
Turn your PDF publications into a flip-book with our unique Google optimized e-Paper software.
acting until the bifurcation point at the apex <strong>of</strong> two<br />
or three yield lines caused resurgence <strong>of</strong> buckling lobes<br />
in the opposite side <strong>of</strong> the frusta and eventually it<br />
led to complete failure <strong>of</strong> one side <strong>of</strong> the frusta which<br />
took place in the supporting point with luxating the lower<br />
edge.<br />
7.2. SCC specimens<br />
SC1<br />
In Fig. 12 a contrast is carried out between initial and<br />
ultimate geometry <strong>of</strong> test specimen SCC1 in which the<br />
utmost deformation is positioned at the height <strong>of</strong> 1<br />
4L <strong>of</strong> the<br />
specimen.<br />
ARTICLE IN PRESS<br />
-10 -9 -8 -7 -6 -5 -4 -3 -2 -1<br />
SC4<br />
FEA<br />
Expev<br />
FEA<br />
Exper.<br />
B.S. Golzan, H. Showkati / Thin-Walled Structures 46 (2008) 516–529 527<br />
Radial displacement (mm)<br />
-10 -9 -8 -7 -6 -5 -4 -3 -2 -1<br />
Radial displacement (mm)<br />
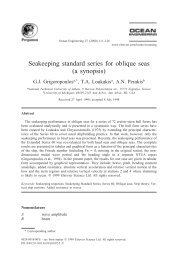
Fig. 13. Radial displacement vs. <strong>external</strong> <strong>pressure</strong> for specimens, SC1 and SC4.<br />
0<br />
0<br />
The load–displacement curves for the net displacements<br />
are plotted for quite a few points in Fig. 5(a). In some <strong>of</strong><br />
the models the displacements were similar in the initial<br />
stage <strong>of</strong> loading, while in the other ones the displacements<br />
started to differ early in the loading stage <strong>of</strong> SCC1. These<br />
two genuses <strong>of</strong> models were thus selected to contrast the<br />
two types <strong>of</strong> behavior. These curves show similar<br />
divergence as observed from the load–strain curves,<br />
Fig. 5(a). The first set, Fig. 5(a) which had similar<br />
displacements in the initial stage <strong>of</strong> loading, experienced<br />
rapid increases in displacements at increased loads. It is<br />
hence recommended that for the determination <strong>of</strong> the<br />
buckling load <strong>of</strong> a model <strong>conical</strong> shell in its corresponding<br />
0<br />
70<br />
65<br />
60<br />
55<br />
50<br />
45<br />
40<br />
35<br />
30<br />
25<br />
20<br />
15<br />
10<br />
5<br />
65<br />
60<br />
55<br />
50<br />
45<br />
40<br />
35<br />
30<br />
25<br />
20<br />
15<br />
10<br />
5<br />
0<br />
Pressure (KPa)<br />
Pressure (KPa)