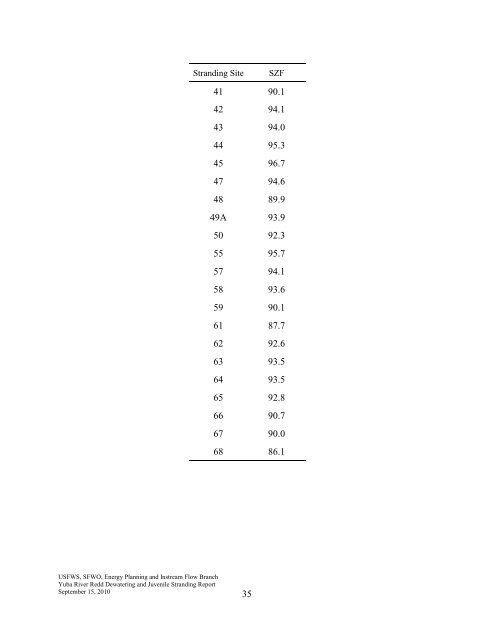
USFWS, SFWO, Energy Planning <strong>and</strong> Instream Flow Branch Yuba River Redd Dewatering <strong>and</strong> Juvenile Str<strong>and</strong>ing Report September 15, 2010 Str<strong>and</strong>ing Site SZF 41 90.1 42 94.1 43 94.0 44 95.3 45 96.7 47 94.6 48 89.9 49A 93.9 50 92.3 55 95.7 57 94.1 58 93.6 59 90.1 61 87.7 62 92.6 63 93.5 64 93.5 65 92.8 66 90.7 67 90.0 68 86.1 35
BETA %MEAN Calculated vs. Given Disch. (%) 16 Difference (measured vs. pred. WSELs) SITE COEFF. ERROR 1,021 cfs 3,154 cfs 5,786 cfs 1,021 cfs 3,154 cfs 5,786 cfs 2 4.66 4.0 2.4 6.2 3.6 0.04 0.11 0.08 BETA %MEAN Calculated vs. Given Disch. (%) Difference (measured vs. pred. WSELs) SITE COEFF. ERROR 1,018 cfs 3,154 cfs 1,018 cfs 3,154 cfs 10 3.26 --- --- --- 0.00 0.00 11 4.17 --- --- --- 0.00 0.00 BETA %MEAN Calculated vs. Given Disch. (%) Difference (measured vs. pred. WSELs) SITE COEFF. ERROR 1,018 cfs 3,154 cfs 5,574 cfs 1,018 cfs 3,154 cfs 5,574 cfs 12 3.49 1.9 1.0 2.9 1.8 0.01 0.04 0.04 BETA %MEAN Calculated vs. Given Disch. (%) Difference (measured vs. pred. WSELs) SITE COEFF. ERROR 1,018 cfs 3,150 cfs 5,559 cfs 1,018 cfs 3,150 cfs 5,559 cfs 16 2.07 0.2 0.1 0.4 0.2 0.00 0.01 0.01 BETA %MEAN Calculated vs. Given Disch. (%) Difference (measured vs. pred. WSELs) SITE COEFF. ERROR 1,151 cfs 1,898 cfs 1,151 cfs 1,898 cfs 18 1.74 --- --- --- 0.00 0.00 20 2.69 --- --- --- 0.00 0.00 BETA %MEAN Calculated vs. Given Disch. (%) Difference (measured vs. pred. WSELs) SITE COEFF. ERROR 1,898 cfs 3,150 cfs 1,898 cfs 3,150 cfs 19 1.35 --- --- --- 0.00 0.00 BETA %MEAN Calculated vs. Given Disch. (%) Difference (measured vs. pred. WSELs) SITE COEFF. ERROR 991 cfs 1,898 cfs 3,768 cfs 991 cfs 1,898 cfs 3,768 cfs 21 3.21 4.2 2.8 6.0 3.5 0.03 0.09 0.06 16 For Calculated versus Given Discharge <strong>and</strong> Difference, the direction of deviation is omitted. USFWS, SFWO, Energy Planning <strong>and</strong> Instream Flow Branch Yuba River Redd Dewatering <strong>and</strong> Juvenile Str<strong>and</strong>ing Report September 15, 2010 36
- Page 1 and 2: RELATIONSHIPS BETWEEN FLOW FLUCTUAT
- Page 3 and 4: ACKNOWLEDGMENTS Field work for this
- Page 5 and 6: TABLE OF CONTENTS (CONTINUED) DISCU
- Page 7 and 8: LIST OF TABLES TABLE 1 Study tasks
- Page 9 and 10: Table 1. Study tasks and associated
- Page 11 and 12: Figure 1. Yuba River stream segment
- Page 13 and 14: Hydraulic and Structural Data Colle
- Page 15 and 16: were those which bracketed the stra
- Page 17 and 18: Water surface elevations were measu
- Page 19 and 20: Table 7. Calibration flows for stra
- Page 21 and 22: Figure 2. Tailspill and redd depth
- Page 23 and 24: Table 9. Redd dewatering Habitat Su
- Page 25 and 26: Figure 6. Stranding areas of juveni
- Page 27 and 28: Figure 8. Predicted dewatering of f
- Page 29 and 30: Figure 10. Predicted dewatering of
- Page 31 and 32: Figure 12. Predicted dewatering of
- Page 33 and 34: Habitat Suitability Criteria (HSC)
- Page 35 and 36: Figure 13. Yuba River flows below D
- Page 37 and 38: APPENDIX A STRANDING SITE LOCATIONS
- Page 39 and 40: Stranding Site # MHU # USFWS, SFWO,
- Page 41: USFWS, SFWO, Energy Planning and In
- Page 45 and 46: BETA %MEAN Calculated vs. Given Dis
- Page 47 and 48: BETA %MEAN Calculated vs. Given Dis
- Page 49 and 50: Stranding flow (cfs) USFWS, SFWO, E
- Page 51 and 52: Stranding flow (cfs) USFWS, SFWO, E
- Page 53 and 54: USFWS, SFWO, Energy Planning and In
- Page 55 and 56: Dewatering flow (cfs) USFWS, SFWO,
- Page 57 and 58: Dewatering flow (cfs) USFWS, SFWO,
- Page 59 and 60: Dewatering flow (cfs) Percentage of
- Page 61 and 62: Dewatering flow (cfs) Percentage of
- Page 63 and 64: Dewatering flow (cfs) USFWS, SFWO,
- Page 65 and 66: Dewatering flow (cfs) USFWS, SFWO,
- Page 67: LIST OF ACRONYMS 2-D Two dimensiona