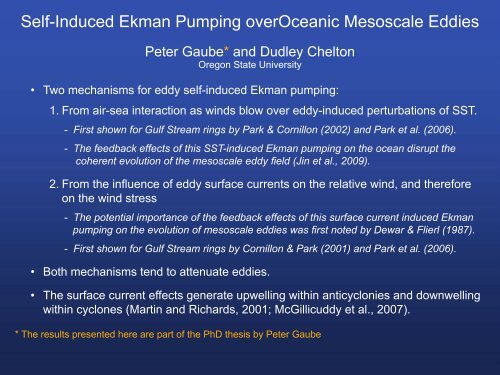
Self - Induced Ekman Pumping Over Oceanic Mesoscale Eddies
Self - Induced Ekman Pumping Over Oceanic Mesoscale Eddies
Self - Induced Ekman Pumping Over Oceanic Mesoscale Eddies

Create successful ePaper yourself
Turn your PDF publications into a flip-book with our unique Google optimized e-Paper software.
<strong>Self</strong>-<strong>Induced</strong> <strong>Ekman</strong> <strong>Pumping</strong> over<strong>Oceanic</strong> <strong>Mesoscale</strong> <strong>Eddies</strong><br />
Peter Gaube* and Dudley Chelton<br />
Oregon State University<br />
• Two mechanisms for eddy self-induced <strong>Ekman</strong> pumping:<br />
1. From air-sea interaction as winds blow over eddy-induced perturbations of SST.<br />
- First shown for Gulf Stream rings by Park & Cornillon (2002) and Park et al. (2006).<br />
- The feedback effects of this SST-induced <strong>Ekman</strong> pumping on the ocean disrupt the<br />
coherent evolution of the mesoscale eddy field (Jin et al., 2009).<br />
2. From the influence of eddy surface currents on the relative wind, and therefore<br />
on the wind stress<br />
- The potential importance of the feedback effects of this surface current induced <strong>Ekman</strong><br />
pumping on the evolution of mesoscale eddies was first noted by Dewar & Flierl (1987).<br />
- First shown for Gulf Stream rings by Cornillon & Park (2001) and Park et al. (2006).<br />
• Both mechanisms tend to attenuate eddies.<br />
• The surface current effects generate upwelling within anticyclonies and downwelling<br />
within cyclones (Martin and Richards, 2001; McGillicuddy et al., 2007).<br />
* The results presented here are part of the PhD thesis by Peter Gaube
Procedure for Composite Averaging SST, Wind Speed<br />
and Wind Stress Curl in Eddy-Centric Coordinates:<br />
Synergy Between 4 Complimentary Satellite Datasets<br />
• Identify mesoscale eddies by altimetry from their SSH signatures.<br />
• Composite average the other satellite datasets in an “eddy-centric” translating<br />
reference frame with (∆x,∆y) coordinates relative to the eddy centroid normalized by<br />
the radius L s of maximum rotational speed at each location along its trajectory.<br />
- AMSR+AVHRR measurements of SST (Reynolds OI2 analyses).<br />
- QuikSCAT measurements of wind speed and wind stress.<br />
- SeaWiFS estimates of oceanic chlorophyll.<br />
• Because the dominant mechanism for eddy-induced SST variability is horizontal<br />
advection by the rotational velocity of the eddy, SST and wind speed must be<br />
composite averaged in a coordinate system that is rotated by an amount determined<br />
from the large-scale background SST gradient.
1. Eddy Influence on SST and Wind Speed
Global Composite Averages of SST in Eddy-Centric Coordinates<br />
Normalized normalized Distance distance from from Eddy eddy Centroid centroid<br />
mposites<br />
udes<br />
degrees C<br />
SST Eddy Composites<br />
SST Eddy Composites SST Eddy Composites<br />
Regions of Northward ∇T Midlatitudes<br />
Regions of Southward ∇T<br />
Clockwise Midlatitudes<br />
Rotating horizontally Clockwise normalized Rotating and rotatedMidlatitudes<br />
ed and rotatedCounterclockwise<br />
Rotating<br />
ard<br />
normalized distance from eddy<br />
horizontally normalized and rotated<br />
Northward<br />
normalized distance degrees Cfrom<br />
eddy centroid<br />
Southward<br />
Northward<br />
degrees C<br />
Counterclockwise Rotating<br />
Southward<br />
Normalized Distance from Eddy Centroid<br />
degrees C<br />
horizontally normalized and rotated<br />
Northward<br />
Southward<br />
degrees C<br />
Contour Interval<br />
is 0.05°C<br />
Southward
Global Composite Averages of Wind Speed in Eddy-Centric Coordinates<br />
Wind Speed Eddy Composites<br />
Wind Speed Eddy Composites Wind Speed Eddy Compos<br />
Regions of Northward ∇T Midlatitudes<br />
Regions of Southward ∇T<br />
Clockwise Midlatitudes<br />
Rotating horizontally Clockwise normalized Rotating and rotatedMidlatitudes<br />
Normalized normalized Distance distance from from Eddy eddy Centroid centroid<br />
y Composites<br />
udes<br />
m s -1<br />
ed and rotatedCounterclockwise<br />
Rotating<br />
ard<br />
normalized distance from eddy<br />
horizontally normalized and rotated<br />
Northward<br />
m s-1 normalized distance from eddy centroid<br />
Southward<br />
Northward<br />
m s -1<br />
Counterclockwise Rotating<br />
Southward<br />
Normalized Distance from Eddy Centroid<br />
m s -1<br />
horizontally normalized and rotated<br />
Northward<br />
Southward<br />
m s -1<br />
Contour Interval<br />
is 0.025 ms Southward<br />
-1
2. <strong>Ekman</strong> <strong>Pumping</strong> from Eddy-Related SST<br />
Influence on Wind Speed
The Influence <strong>Ekman</strong> <strong>Pumping</strong> of Wind from Direction Eddy Perturbations on SST-induced<br />
of SST<br />
for Winds from Various Directions <strong>Over</strong> a 1.0°C SST Anomaly at 30°S<br />
<strong>Ekman</strong> <strong>Pumping</strong><br />
cm day -1<br />
Contour Interval<br />
is 3 cm day -1<br />
1.0 deg<br />
C temp<br />
anomaly
The Influence <strong>Ekman</strong> <strong>Pumping</strong> of Wind from Direction Eddy Perturbations on SST-induced<br />
of SST<br />
for Winds from Various Directions <strong>Over</strong> a 0.5°C SST Anomaly at 30°S<br />
<strong>Ekman</strong> <strong>Pumping</strong><br />
cm day -1<br />
Contour Interval<br />
is 3 cm day -1<br />
0.5 deg<br />
C temp<br />
anomaly
3. <strong>Ekman</strong> <strong>Pumping</strong> from Eddy Surface Currents<br />
for an Idealized Gaussian Eddy
Eddy-<strong>Induced</strong> <strong>Ekman</strong> <strong>Pumping</strong><br />
<strong>Ekman</strong> <strong>Pumping</strong> from Eddy Surface Currents<br />
for an Idealized Anticyclonic Gaussian How it works: Eddy and Westerly Winds at 30°S<br />
• The surface circulation of an eddy can induce <strong>Ekman</strong> pumping in a uniform wind<br />
field. SSH Structure of<br />
Idealized Eddy Gaussian VorticityEddy<br />
<strong>Ekman</strong> <strong>Ekman</strong> <strong>Pumping</strong> <strong>Pumping</strong> Velocity<br />
l = −→ u a − −→ −→<br />
u rel u= o<br />
−→ u a − −→ u o<br />
−→<br />
τ = ρCD|urel| −→ u rel<br />
−→ u rel = −→ u a − −→ u o<br />
m s -1 per 100 km<br />
Contour Interval<br />
is 5 cm<br />
• 30°S<br />
• 20 cm amp.<br />
• 10 ms -1 wind<br />
• Max current<br />
40 cm s -1<br />
WE = 1<br />
ρf ∇×−→ τ<br />
cm day -1<br />
Contour Interval<br />
is 3 cm day -1
The Influence <strong>Ekman</strong> <strong>Pumping</strong> of Wind from Eddy Direction Surface on Currents Gaussian<br />
for an Idealized Anticyclonic Gaussian Eddy and Winds from Various Directions<br />
Eddy-induced at <strong>Ekman</strong> 30°S <strong>Pumping</strong><br />
cm day -1<br />
Contour Interval<br />
is 3 cm day -1
4. <strong>Ekman</strong> <strong>Pumping</strong> from the Combined Effects of SST<br />
Influence and Eddy Surface Currents<br />
for an Idealized Gaussian Eddy
<strong>Ekman</strong> The <strong>Pumping</strong> Influence from of Eddy Wind Surface Direction Currents on and Gaussian<br />
SST Combined<br />
for an Idealized Anticyclonic Gaussian Eddy and Winds from Various Directions<br />
Eddy-induced and SST-induced <strong>Ekman</strong> <strong>Pumping</strong><br />
over a 0.5°C SST Anomaly at 30°S<br />
cm day -1<br />
Contour Interval<br />
is 3 cm day -1<br />
0.5 deg<br />
C temp<br />
anomaly
m s -1 per<br />
How does this eddy-induced <strong>Ekman</strong> pumping compare<br />
with <strong>Ekman</strong> pumping associated with the large-scale wind field?<br />
Combined SST and Eddy <strong>Induced</strong><br />
−→<br />
u a − −→ a −<br />
u o<br />
−→ u o<br />
D|urel| −→ • 30°S<br />
u • 20 cm amp.<br />
rel<br />
• 10 ms-1 wind<br />
• Max current<br />
40 cm s-1 W from Currents and 0.5 E oC SST Anomaly<br />
<strong>Ekman</strong> <strong>Pumping</strong><br />
WE = 1<br />
ρf ∇×−→ τ<br />
cm day -1<br />
Normalized Distance Contour Interval<br />
is 3 cm day Risien and Chelton, 2008<br />
from Eddy Centroid<br />
• <strong>Ekman</strong> pumping due to eddy-induced SST anomalies is secondary to the<br />
upwelling induced by the eddy surface currents<br />
• Eddy-induced <strong>Ekman</strong> pumping is of the same order of magnitude as basin<br />
scale <strong>Ekman</strong> pumping<br />
-1<br />
Eddy-induced <strong>Ekman</strong> pumping is an Order-1 Perturbation<br />
of the <strong>Ekman</strong> pumping associated with the large-scale wind field.<br />
cm da<br />
0.5 deg
5. Is the previous <strong>Ekman</strong> pumping for an idealized<br />
Gaussian eddy observed in the QuikSCAT data?
5. Is the previous <strong>Ekman</strong> pumping for an idealized<br />
Gaussian eddy observed in the QuikSCAT data?
Composite Averages of Eddy-<strong>Induced</strong> Vorticity and<br />
<strong>Ekman</strong> <strong>Pumping</strong> Velocity in the Hawaiian Island Region<br />
Composite Averages of Current-<strong>Induced</strong> <strong>Ekman</strong> <strong>Pumping</strong><br />
Geostrophic Vorticity<br />
from Altimetry<br />
geostrophic vorticity current-induced pumping observed <strong>Ekman</strong> pumping<br />
region around the Hawaiian Islands in the Central Pacific<br />
m s-1 per 100 km<br />
cm day-1 anticyclones cm day cyclones<br />
-1<br />
contour interval<br />
2 cm<br />
Composite Averages of Current-<strong>Induced</strong> <strong>Ekman</strong> <strong>Pumping</strong><br />
Surface Current-<strong>Induced</strong><br />
<strong>Ekman</strong> Pumpming<br />
from Altimetry<br />
<strong>Ekman</strong> Pumpming<br />
from QuikSCAT<br />
region around the Hawaiian Islands in the Central Pacific<br />
cm day-1 anticyclones cyclones<br />
contour interval<br />
0.5 cm day -1<br />
contour interval<br />
0.5 cm day -1<br />
The regions of strong upwelling<br />
and downwelling are zonally<br />
elongated because the winds<br />
are predominantly nearly zonal<br />
(easterly) in this region.<br />
The somewhat weaker upwelling<br />
velocities in the QuikSCAT<br />
composites are consistent with<br />
small mislocations of the eddy<br />
centroids because of noise in<br />
the altimeter SSH fields.
Composite Averages of Eddy-<strong>Induced</strong> Vorticity and<br />
<strong>Ekman</strong> <strong>Pumping</strong> Velocity in the South Indian Ocean<br />
Composite Averages of Current-<strong>Induced</strong> <strong>Ekman</strong> <strong>Pumping</strong><br />
Geostrophic Vorticity<br />
from Altimetry<br />
geostrophic vorticity current-induced pumping observed <strong>Ekman</strong> pumping<br />
South Indian Ocean<br />
m s-1 per 100 km<br />
cm day-1 anticyclones cm day cyclones<br />
-1<br />
contour interval<br />
2 cm<br />
Composite Averages of Current-<strong>Induced</strong> <strong>Ekman</strong> <strong>Pumping</strong><br />
Surface Current-<strong>Induced</strong><br />
<strong>Ekman</strong> Pumpming<br />
from Altimetry<br />
<strong>Ekman</strong> Pumpming<br />
from QuikSCAT<br />
South Indian Ocean<br />
cm day-1 anticyclones cyclones<br />
contour interval<br />
0.5 cm day -1<br />
contour interval<br />
0.5 cm day -1<br />
The nearly circular regions of<br />
strong upwelling and downwelling<br />
are indicative of highly variable<br />
direction of the wind stress.<br />
The somewhat weaker upwelling<br />
velocities in the QuikSCAT<br />
composites are again consistent<br />
with small mislocations of the<br />
eddy centroids because of noise<br />
in the altimeter SSH fields.
6. Influence of <strong>Ekman</strong> <strong>Pumping</strong> on <strong>Oceanic</strong> Biology
<strong>Eddies</strong> Spawned from the Leeuwin Current<br />
a total of 734 anticyclonic and 818 cyclonic long-lived eddies were tracked from 2000-2008<br />
mg m -3
eddy scale<br />
Eddy eddy Radius scale<br />
AL.: EDDY-INDUCED EKMAN PUMPING X - 43<br />
eddy scale eddy scale<br />
<br />
mg m -3<br />
<br />
• Seasonally (May - September), we observed enhanced CHL at the cores of anticyclonic eddies.<br />
• Negative CHL anomalies<br />
eddy scale<br />
are a persistent feature of cyclonic eddies in this<br />
eddy<br />
region.<br />
scale<br />
<br />
contour interval<br />
1 cm day-1 Eddy-<strong>Induced</strong> <strong>Ekman</strong> <strong>Pumping</strong> Can can Sustain Phytoplankton Blooms<br />
filtered SeaWiFS chlorophyll with contours of QuikSCAT <strong>Ekman</strong> pumping<br />
contour interval<br />
1 cm day-1 Contour Interval<br />
1 cm day-1 Filtered wintertime SeaWiFS chlorophyll with contours of QuiksCAT <strong>Ekman</strong> pumping<br />
Eddy Radius<br />
mg m -3<br />
Eddy Radius<br />
• Seasonally (May - September), we observed enhanced CHL at the cores of anticyclonic eddies.<br />
• Negative CHL anomalies are a persistent feature of cyclonic eddies in this region.<br />
Eddy Radius
Conclusions<br />
1) Eddy-induced SST variability consists of horizontal advection by the<br />
azimuthal velocity of the eddies that is consistent with the coupling found<br />
previously between SST and wind speed along meandering SST fronts.<br />
2) The <strong>Ekman</strong> pumping associated with these SST anomalies over the<br />
eddy interiors is usually secondary to the <strong>Ekman</strong> pumping associated<br />
with eddy surface currents.<br />
• This <strong>Ekman</strong> pumping is clearly evident in the surface winds measured by QuikSCAT.<br />
• The small differences between the <strong>Ekman</strong> pumping velocity deduced from QuikSCAT data<br />
and the geostrophic velocity computed from altimeter data are consistent with noise in the<br />
SSH fields that results in small mislocations of the eddy centroids and hence misalignment of<br />
the <strong>Ekman</strong> pumping velocity fields.<br />
3) <strong>Ekman</strong> pumping over anticyclones appears to sustain blooms of<br />
phytoplankton within the cores of eddies in the South Indian Ocean<br />
during wintertime.<br />
• The reason that this is limited to wintertime is thought to be that the mixed layer is sufficiently<br />
deep to reach the nutricline, thus allowing the injection of nutrients ino the eddy interior where<br />
they can be utilized by phytoplankton trapped in the cores of anticyclones.