Download the Journal (PDF) - Division on Autism and ...
Download the Journal (PDF) - Division on Autism and ...
Download the Journal (PDF) - Division on Autism and ...

Create successful ePaper yourself
Turn your PDF publications into a flip-book with our unique Google optimized e-Paper software.
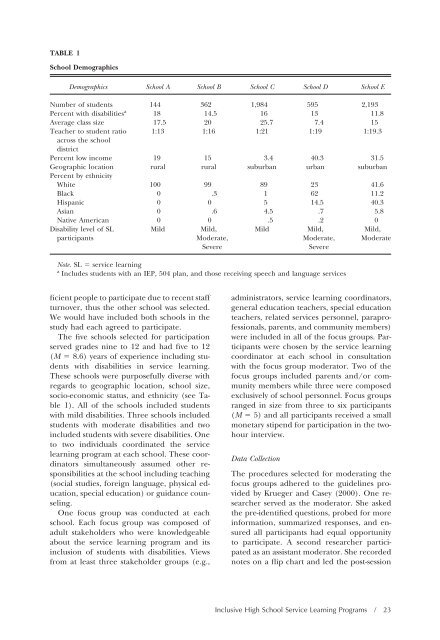
TABLE 1<br />
School Demographics<br />
Demographics School A School B School C School D School E<br />
Number of students 144 362 1,984 595 2,193<br />
Percent with disabilities a<br />
18 14.5 16 13 11.8<br />
Average class size 17.5 20 25.7 7.4 15<br />
Teacher to student ratio<br />
across <str<strong>on</strong>g>the</str<strong>on</strong>g> school<br />
district<br />
1:13 1:16 1:21 1:19 1:19.3<br />
Percent low income 19 15 3.4 40.3 31.5<br />
Geographic locati<strong>on</strong><br />
Percent by ethnicity<br />
rural rural suburban urban suburban<br />
White 100 99 89 23 41.6<br />
Black 0 .3 1 62 11.2<br />
Hispanic 0 0 5 14.5 40.3<br />
Asian 0 .6 4.5 .7 5.8<br />
Native American 0 0 .5 .2 0<br />
Disability level of SL<br />
Mild Mild,<br />
Mild Mild,<br />
Mild,<br />
participants<br />
Moderate,<br />
Moderate, Moderate<br />
Severe<br />
Severe<br />
Note. SL service learning<br />
a Includes students with an IEP, 504 plan, <strong>and</strong> those receiving speech <strong>and</strong> language services<br />
ficient people to participate due to recent staff<br />
turnover, thus <str<strong>on</strong>g>the</str<strong>on</strong>g> o<str<strong>on</strong>g>the</str<strong>on</strong>g>r school was selected.<br />
We would have included both schools in <str<strong>on</strong>g>the</str<strong>on</strong>g><br />
study had each agreed to participate.<br />
The five schools selected for participati<strong>on</strong><br />
served grades nine to 12 <strong>and</strong> had five to 12<br />
(M 8.6) years of experience including students<br />
with disabilities in service learning.<br />
These schools were purposefully diverse with<br />
regards to geographic locati<strong>on</strong>, school size,<br />
socio-ec<strong>on</strong>omic status, <strong>and</strong> ethnicity (see Table<br />
1). All of <str<strong>on</strong>g>the</str<strong>on</strong>g> schools included students<br />
with mild disabilities. Three schools included<br />
students with moderate disabilities <strong>and</strong> two<br />
included students with severe disabilities. One<br />
to two individuals coordinated <str<strong>on</strong>g>the</str<strong>on</strong>g> service<br />
learning program at each school. These coordinators<br />
simultaneously assumed o<str<strong>on</strong>g>the</str<strong>on</strong>g>r resp<strong>on</strong>sibilities<br />
at <str<strong>on</strong>g>the</str<strong>on</strong>g> school including teaching<br />
(social studies, foreign language, physical educati<strong>on</strong>,<br />
special educati<strong>on</strong>) or guidance counseling.<br />
One focus group was c<strong>on</strong>ducted at each<br />
school. Each focus group was composed of<br />
adult stakeholders who were knowledgeable<br />
about <str<strong>on</strong>g>the</str<strong>on</strong>g> service learning program <strong>and</strong> its<br />
inclusi<strong>on</strong> of students with disabilities. Views<br />
from at least three stakeholder groups (e.g.,<br />
administrators, service learning coordinators,<br />
general educati<strong>on</strong> teachers, special educati<strong>on</strong><br />
teachers, related services pers<strong>on</strong>nel, paraprofessi<strong>on</strong>als,<br />
parents, <strong>and</strong> community members)<br />
were included in all of <str<strong>on</strong>g>the</str<strong>on</strong>g> focus groups. Participants<br />
were chosen by <str<strong>on</strong>g>the</str<strong>on</strong>g> service learning<br />
coordinator at each school in c<strong>on</strong>sultati<strong>on</strong><br />
with <str<strong>on</strong>g>the</str<strong>on</strong>g> focus group moderator. Two of <str<strong>on</strong>g>the</str<strong>on</strong>g><br />
focus groups included parents <strong>and</strong>/or community<br />
members while three were composed<br />
exclusively of school pers<strong>on</strong>nel. Focus groups<br />
ranged in size from three to six participants<br />
(M 5) <strong>and</strong> all participants received a small<br />
m<strong>on</strong>etary stipend for participati<strong>on</strong> in <str<strong>on</strong>g>the</str<strong>on</strong>g> twohour<br />
interview.<br />
Data Collecti<strong>on</strong><br />
The procedures selected for moderating <str<strong>on</strong>g>the</str<strong>on</strong>g><br />
focus groups adhered to <str<strong>on</strong>g>the</str<strong>on</strong>g> guidelines provided<br />
by Krueger <strong>and</strong> Casey (2000). One researcher<br />
served as <str<strong>on</strong>g>the</str<strong>on</strong>g> moderator. She asked<br />
<str<strong>on</strong>g>the</str<strong>on</strong>g> pre-identified questi<strong>on</strong>s, probed for more<br />
informati<strong>on</strong>, summarized resp<strong>on</strong>ses, <strong>and</strong> ensured<br />
all participants had equal opportunity<br />
to participate. A sec<strong>on</strong>d researcher participated<br />
as an assistant moderator. She recorded<br />
notes <strong>on</strong> a flip chart <strong>and</strong> led <str<strong>on</strong>g>the</str<strong>on</strong>g> post-sessi<strong>on</strong><br />
Inclusive High School Service Learning Programs / 23