
Create successful ePaper yourself
Turn your PDF publications into a flip-book with our unique Google optimized e-Paper software.
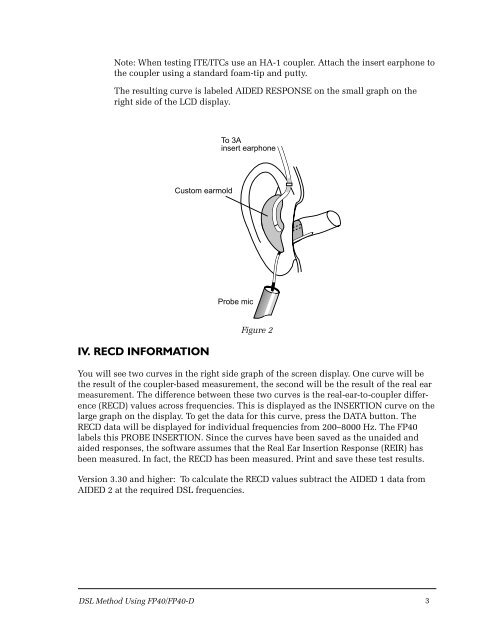
Note: When testing ITE/ITCs use an HA-1 coupler. Attach the insert earphone to<br />
the coupler using a standard foam-tip and putty.<br />
The resulting curve is labeled AIDED RESPONSE on the small graph on the<br />
right side of the LCD display.<br />
<strong>DSL</strong> Method Using <strong>FP40</strong>/<strong>FP40</strong>-D<br />
Custom earmold<br />
IV. RECD INFORMATION<br />
To 3A<br />
insert earphone<br />
Probe mic<br />
Figure 2<br />
You will see two curves in the right side graph of the screen display. One curve will be<br />
the result of the coupler-based measurement, the second will be the result of the real ear<br />
measurement. The difference between these two curves is the real-ear-to-coupler difference<br />
(RECD) values across frequencies. This is displayed as the INSERTION curve on the<br />
large graph on the display. To get the data for this curve, press the DATA button. The<br />
RECD data will be displayed for individual frequencies from 200–8000 Hz. The <strong>FP40</strong><br />
labels this PROBE INSERTION. Since the curves have been saved as the unaided and<br />
aided responses, the software assumes that the Real Ear Insertion Response (REIR) has<br />
been measured. In fact, the RECD has been measured. Print and save these test results.<br />
Version 3.30 and higher: To calculate the RECD values subtract the AIDED 1 data from<br />
AIDED 2 at the required <strong>DSL</strong> frequencies.<br />
3