
Create successful ePaper yourself
Turn your PDF publications into a flip-book with our unique Google optimized e-Paper software.
ow 1<br />
2<br />
3<br />
4<br />
5<br />
6<br />
7<br />
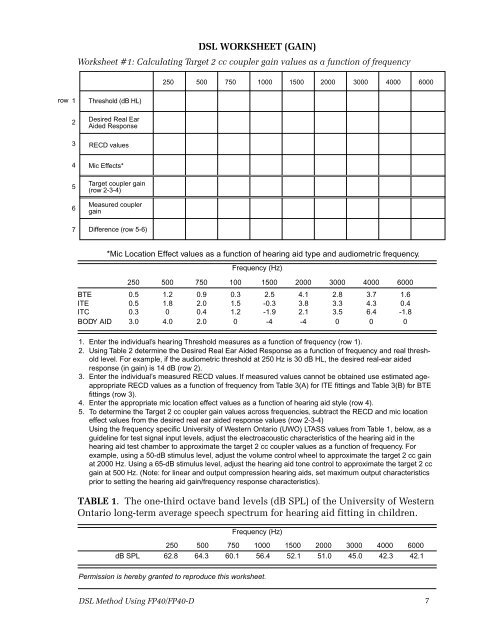
<strong>DSL</strong> Method Using <strong>FP40</strong>/<strong>FP40</strong>-D<br />
<strong>DSL</strong> WORKSHEET (GAIN)<br />
Worksheet #1: Calculating Target 2 cc coupler gain values as a function of frequency<br />
Threshold (dB HL)<br />
Desired Real Ear<br />
Aided Response<br />
RECD values<br />
Mic Effects*<br />
Target coupler gain<br />
(row 2-3-4)<br />
Measured coupler<br />
gain<br />
Difference (row 5-6)<br />
250 500 750 1000 1500 2000 3000 4000 6000<br />
*Mic Location Effect values as a function of hearing aid type and audiometric frequency.<br />
Frequency (Hz)<br />
250 500 750 100 1500 2000 3000 4000 6000<br />
BTE 0.5 1.2 0.9 0.3 2.5 4.1 2.8 3.7 1.6<br />
ITE 0.5 1.8 2.0 1.5 -0.3 3.8 3.3 4.3 0.4<br />
ITC 0.3 0 0.4 1.2 -1.9 2.1 3.5 6.4 -1.8<br />
BODY AID 3.0 4.0 2.0 0 -4 -4 0 0 0<br />
1. Enter the individual’s hearing Threshold measures as a function of frequency (row 1).<br />
2. Using Table 2 determine the Desired Real Ear Aided Response as a function of frequency and real threshold<br />
level. For example, if the audiometric threshold at 250 Hz is 30 dB HL, the desired real-ear aided<br />
response (in gain) is 14 dB (row 2).<br />
3. Enter the individual’s measured RECD values. If measured values cannot be obtained use estimated ageappropriate<br />
RECD values as a function of frequency from Table 3(A) for ITE fittings and Table 3(B) for BTE<br />
fittings (row 3).<br />
4. Enter the appropriate mic location effect values as a function of hearing aid style (row 4).<br />
5. To determine the Target 2 cc coupler gain values across frequencies, subtract the RECD and mic location<br />
effect values from the desired real ear aided response values (row 2-3-4)<br />
Using the frequency specific University of Western Ontario (UWO) LTASS values from Table 1, below, as a<br />
guideline for test signal input levels, adjust the electroacoustic characteristics of the hearing aid in the<br />
hearing aid test chamber to approximate the target 2 cc coupler values as a function of frequency. For<br />
example, using a 50-dB stimulus level, adjust the volume control wheel to approximate the target 2 cc gain<br />
at 2000 Hz. Using a 65-dB stimulus level, adjust the hearing aid tone control to approximate the target 2 cc<br />
gain at 500 Hz. (Note: for linear and output compression hearing aids, set maximum output characteristics<br />
prior to setting the hearing aid gain/frequency response characteristics).<br />
TABLE 1. The one-third octave band levels (dB SPL) of the University of Western<br />
Ontario long-term average speech spectrum for hearing aid fitting in children.<br />
Frequency (Hz)<br />
250 500 750 1000 1500 2000 3000 4000 6000<br />
dB SPL 62.8 64.3 60.1 56.4 52.1 51.0 45.0 42.3 42.1<br />
Permission is hereby granted to reproduce this worksheet.<br />
7