- Page 1 and 2:
Copyright by Athena Ranice Stacy 20
- Page 3 and 4:
New Insights into Primordial Star F
- Page 5 and 6:
Acknowledgments I first want to giv
- Page 7 and 8:
angular momentum to rotate at nearl
- Page 9 and 10:
2.4.2.5 Thermodynamics of accretion
- Page 11 and 12:
Chapter 7. Outlook 177 Bibliography
- Page 13 and 14:
List of Figures 2.1 Density project
- Page 15 and 16:
1.1 Motivation Chapter 1 Introducti
- Page 17 and 18:
leaving behind a neutron star or bl
- Page 19 and 20:
describe studies that have attempte
- Page 21 and 22:
CRs may therefore provide a pathway
- Page 23 and 24:
expected that some of the gas withi
- Page 25 and 26:
our numerical methodology in Chapte
- Page 27 and 28:
scattering is the major source of o
- Page 29 and 30:
portance. The reaction rates for an
- Page 31 and 32:
The size of the refinement levels h
- Page 33 and 34:
the sink a temperature and pressure
- Page 35 and 36:
same time, such as the fragments in
- Page 37 and 38:
Figure 2.2: Physical state of the c
- Page 39 and 40:
2.4.2 Protostellar accretion 2.4.2.
- Page 41 and 42:
Despite some amount of rotational s
- Page 43 and 44:
Figure 2.6: Velocity field of the c
- Page 45 and 46:
Figure 2.7: Disk mass vs. time sinc
- Page 47 and 48:
Figure 2.8: Angular momentum struct
- Page 49 and 50:
sink tform [yr] Mfinal [M⊙] rinit
- Page 51 and 52:
sink (∼ 4 M⊙) that merged with
- Page 53 and 54:
actual final mass of the star is li
- Page 55 and 56:
the average temperature of all part
- Page 57 and 58:
disk accretion onto a primordial pr
- Page 59 and 60:
Figure 2.12: Impact of feedback on
- Page 61 and 62:
Figure 2.13: Comparison of specific
- Page 63 and 64:
the central core, eventually compri
- Page 65 and 66:
extending our simulation to later t
- Page 67 and 68:
that such a non-primordial origin t
- Page 69 and 70:
impose an upper mass limit to Pop I
- Page 71 and 72:
we use a ray-tracing scheme to foll
- Page 73 and 74:
3.2.3 Sink Particle Method When an
- Page 75 and 76:
convenient way to directly measure
- Page 77 and 78:
where the sum now extends from the
- Page 79 and 80:
Figure 3.1: Evolution of various pr
- Page 81 and 82:
ased on the prescription of Omukai
- Page 83 and 84:
ate found at late times in our ‘n
- Page 85 and 86:
Figure 3.2: Evolution of various di
- Page 87 and 88:
Figure 3.3: Evolution of disk mass
- Page 89 and 90:
Figure 3.4: Temperature versus numb
- Page 91 and 92:
disk mass is able to level off in d
- Page 93 and 94:
Figure 3.6: Projected density and t
- Page 95 and 96:
onto the disk. The numerical experi
- Page 97 and 98:
that the I-front expands as an hour
- Page 99 and 100:
Figure 3.8: Evolution of various H
- Page 101 and 102:
˙ M∗ = 3πΣν, (3.18) where ν
- Page 103 and 104:
the discrete nature of the gas part
- Page 105 and 106:
stars. We also note that, despite t
- Page 107 and 108:
current computational limits. If ra
- Page 109 and 110:
the deaths of massive stars (see Wo
- Page 111 and 112:
It is apparent that the angular mom
- Page 113 and 114:
h = 0.7. To accelerate structure fo
- Page 115 and 116:
acc = Lres 50 AU, where: Lres 0.5
- Page 117 and 118:
years, up to several dynamical time
- Page 119 and 120:
sp = GM∗ c2 , (4.1) s where cs is
- Page 121 and 122:
Figure 4.2: Left: Angular momentum
- Page 123 and 124:
through the disk, and the disk is e
- Page 125 and 126:
steadily grows for the rest of the
- Page 127 and 128: Fig. 4.5 shows these timescales for
- Page 129 and 130: sink B. Once on the MS, the sink A
- Page 131 and 132: Figure 4.6: Evolution of stellar ro
- Page 133 and 134: sink M∗(5000 yr) [M⊙] M∗(10 5
- Page 135 and 136: present here, particularly if the s
- Page 137 and 138: the stars grow to larger masses (se
- Page 139 and 140: Here, Σ is the disk surface densit
- Page 141 and 142: which has already detected GRBs at
- Page 143 and 144: M⊙. They find that the specific a
- Page 145 and 146: are initialized at high z with smal
- Page 147 and 148: M⊙, where Nneigh 32 is the typic
- Page 149 and 150: Figure 5.1: Top panels: Effective v
- Page 151 and 152: Figure 5.2: Effect of relative stre
- Page 153 and 154: Using cs ∝ T 1/2 results in ρ
- Page 155 and 156: Figure 5.4: Evolution of gas proper
- Page 157 and 158: a much smaller contribution from <
- Page 159 and 160: abundances of HD, which also acts a
- Page 161 and 162: first stars had very short lifetime
- Page 163 and 164: of star-forming material. Here we t
- Page 165 and 166: star formation, they found CR energ
- Page 167 and 168: The GZK cutoff applies only to thos
- Page 169 and 170: and virialization redshift zvir = 2
- Page 171 and 172: and undergoes free-fall collapse. I
- Page 173 and 174: β = 1 − −2 1/2 ɛ + 1 mHc2
- Page 175 and 176: and where ΓCR(D) = 5 × 10 −29 e
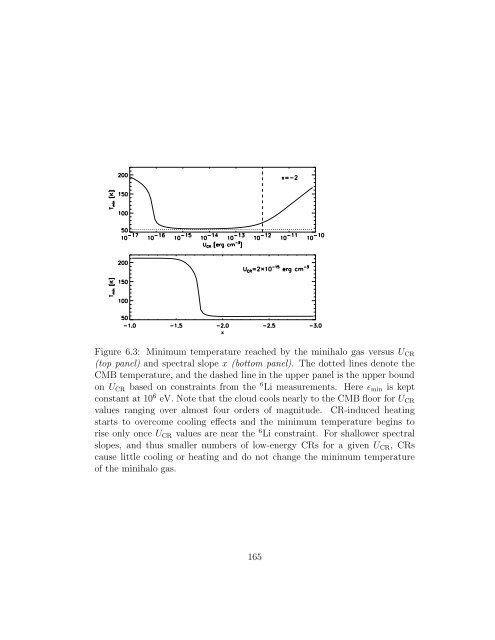
- Page 177: Figure 6.2: Thermal evolution of pr
- Page 181 and 182: Figure 6.4: Thermal evolution of pr
- Page 183 and 184: The CR energy density can now be es
- Page 185 and 186: 2007). When considering realistic c
- Page 187 and 188: 6.3.5 Fragmentation scale As is evi
- Page 189 and 190: 2006). This decrease in fragmentati
- Page 191 and 192: Chapter 7 Outlook Our understanding
- Page 193 and 194: that Pop III stars likely experienc
- Page 195 and 196: to be part of an area of scientific
- Page 197 and 198: Barkana, R. and Loeb, A. (2001). In
- Page 199 and 200: Bromm, V., Kudritzki, R. P., and Lo
- Page 201 and 202: Daigne, F., Olive, K. A., Silk, J.,
- Page 203 and 204: Gao, L., White, S. D. M., Jenkins,
- Page 205 and 206: Heger, A., Woosley, S. E., and Spru
- Page 207 and 208: Kratter, K. M. and Murray-Clay, R.
- Page 209 and 210: Machida, M. N., Omukai, K., Matsumo
- Page 211 and 212: Navarro, J. F. and White, S. D. M.
- Page 213 and 214: Rollinde, E., Vangioni, E., and Oli
- Page 215 and 216: Simon, M., Ghez, A. M., Leinert, C.
- Page 217 and 218: Tanvir, N. R., Fox, D. B., Levan, A
- Page 219 and 220: Rays, volume 576 of Lecture Notes i
- Page 221 and 222: Zatsepin, G. T. and Kuz’min, V. A