3. CARBON DIOXIDE (CO2)
3. CARBON DIOXIDE (CO2)
3. CARBON DIOXIDE (CO2)

Create successful ePaper yourself
Turn your PDF publications into a flip-book with our unique Google optimized e-Paper software.
<strong>3.</strong> <strong>CARBON</strong> <strong>DIOXIDE</strong> (<strong>CO2</strong>)<br />
Basic information on <strong>CO2</strong> with regard to<br />
environmental issues<br />
Carbon dioxide (<strong>CO2</strong>) has strong absorption bands<br />
in the infrared region and is the biggest anthropogenic<br />
contributor to the greenhouse effect. <strong>CO2</strong> accounted for<br />
about 64% of total increase in the radiative forcing due<br />
to long-lived greenhouse gases in the atmosphere<br />
from 1750 to 2010 (WMO, 2011b).<br />
The balance between its emission and absorption<br />
over the continents and oceans determines the mole<br />
fraction of <strong>CO2</strong> in the atmosphere. About 762<br />
gigatonnes of carbon are present in the atmosphere as<br />
<strong>CO2</strong> (IPCC, 2007) and annual anthropogenic<br />
emissions mainly due to fossil fuel combustion<br />
reached 8.4±0.5 gigatonnes in 2009<br />
(http://www.globalcarbonproject.org). Carbon in<br />
the atmosphere is exchanged with two other large<br />
reservoirs, the terrestrial biosphere and the oceans.<br />
<strong>CO2</strong> exchanges between the atmosphere and terrestrial<br />
biosphere occur mainly through absorption by<br />
photosynthesis and emission from the respiration of<br />
plants and the decomposition of organic soils. These<br />
biogenic activities vary seasonally, resulting in large<br />
seasonal variations in the level of <strong>CO2</strong>. <strong>CO2</strong><br />
exchange between the atmosphere and oceans occurs<br />
in direction determined by the gradient of <strong>CO2</strong> mole<br />
fraction, and varies in time and space.<br />
The current mole fractions of atmospheric <strong>CO2</strong> far<br />
exceed historic records, dating back 650,000 years<br />
(Solomon et al., 2007). Based on the results of ice core<br />
studies, the mole fraction of atmospheric <strong>CO2</strong> in<br />
pre-industrial times was about 280 ppm (IPCC, 2007).<br />
The emission of <strong>CO2</strong> due to human activities has<br />
increased dramatically since the beginning of the<br />
industrial era, impacting <strong>CO2</strong> exchange rates between<br />
different reservoirs and <strong>CO2</strong> levels not only in the<br />
atmosphere but in the oceans and terrestrial biosphere.<br />
The global carbon cycle, which is comprised mainly of<br />
<strong>CO2</strong>, is not fully understood. About half of<br />
anthropogenic <strong>CO2</strong> emissions have remained in the<br />
atmosphere, with the remainder removed by sinks,<br />
including the terrestrial biosphere and oceans, and<br />
non-anthropogenic sources. However, the amount of<br />
<strong>CO2</strong> removed from the atmosphere varies significantly<br />
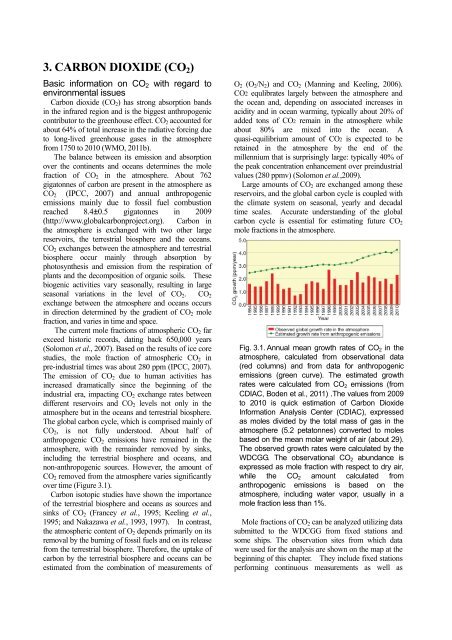
over time (Figure <strong>3.</strong>1).<br />
Carbon isotopic studies have shown the importance<br />
of the terrestrial biosphere and oceans as sources and<br />
sinks of <strong>CO2</strong> (Francey et al., 1995; Keeling et al.,<br />
1995; and Nakazawa et al., 1993, 1997). In contrast,<br />
the atmospheric content of O2 depends primarily on its<br />
removal by the burning of fossil fuels and on its release<br />
from the terrestrial biosphere. Therefore, the uptake of<br />
carbon by the terrestrial biosphere and oceans can be<br />
estimated from the combination of measurements of<br />
O2 (O2/N2) and <strong>CO2</strong> (Manning and Keeling, 2006).<br />
<strong>CO2</strong> equlibrates largely between the atmosphere and<br />
the ocean and, depending on associated increases in<br />
acidity and in ocean warming, typically about 20% of<br />
added tons of <strong>CO2</strong> remain in the atmosphere while<br />
about 80% are mixed into the ocean. A<br />
quasi-equilibrium amount of <strong>CO2</strong> is expected to be<br />
retained in the atmosphere by the end of the<br />
millennium that is surprisingly large: typically 40% of<br />
the peak concentration enhancement over preindustrial<br />
values (280 ppmv) (Solomon et al.,2009).<br />
Large amounts of <strong>CO2</strong> are exchanged among these<br />
reservoirs, and the global carbon cycle is coupled with<br />
the climate system on seasonal, yearly and decadal<br />
time scales. Accurate understanding of the global<br />
carbon cycle is essential for estimating future <strong>CO2</strong><br />
mole fractions in the atmosphere.<br />
Fig. <strong>3.</strong>1. Annual mean growth rates of <strong>CO2</strong> in the<br />
atmosphere, calculated from observational data<br />
(red columns) and from data for anthropogenic<br />
emissions (green curve). The estimated growth<br />
rates were calculated from <strong>CO2</strong> emissions (from<br />
CDIAC, Boden et al., 2011) .The values from 2009<br />
to 2010 is quick estimation of Carbon Dioxide<br />
Information Analysis Center (CDIAC), expressed<br />
as moles divided by the total mass of gas in the<br />
atmosphere (5.2 petatonnes) converted to moles<br />
based on the mean molar weight of air (about 29).<br />
The observed growth rates were calculated by the<br />
WDCGG. The observational <strong>CO2</strong> abundance is<br />
expressed as mole fraction with respect to dry air,<br />
while the <strong>CO2</strong> amount calculated from<br />
anthropogenic emissions is based on the<br />
atmosphere, including water vapor, usually in a<br />
mole fraction less than 1%.<br />
Mole fractions of <strong>CO2</strong> can be analyzed utilizing data<br />
submitted to the WDCGG from fixed stations and<br />
some ships. The observation sites from which data<br />
were used for the analysis are shown on the map at the<br />
beginning of this chapter. They include fixed stations<br />
performing continuous measurements as well as
flask-sampling stations, including those in the<br />
NOAA/ESRL cooperative air sampling network. In<br />
addition, mobile stations on ships and aircraft and other<br />
stations observing on an event basis report their data to<br />
the WDCGG (see Appendix: LIST OF OBSERVING<br />
STATIONS), which are not used for global anaysis.<br />
Annual variations of <strong>CO2</strong> mole fraction in<br />
the atmosphere<br />
The monthly mean mole fractions of <strong>CO2</strong> used in<br />
the analysis are shown in Plate <strong>3.</strong>1, with mole fraction<br />
levels illustrated in different colours. Global,<br />
hemispheric and zonal mean mole fractions were<br />
analysed based on data from selected stations under<br />
unpolluted conditions (see the caption to Plate <strong>3.</strong>1).<br />
Latitudinally averaged mole fractions of atmospheric<br />
<strong>CO2</strong>, together with their deseasonalized components<br />
and growth rates, are shown as three-dimensional<br />
representations in Plate <strong>3.</strong>2. These plots show that<br />
the seasonal variations in mole fraction are large in<br />
northern high and mid-latitudes, but are indistinct in<br />
the Southern Hemisphere. The increases in the<br />
Northern Hemisphere precede those in the Southern<br />
Hemisphere by one or two years, and the interannual<br />
Fig. <strong>3.</strong>2 Global monthly mean mole fraction of<br />
<strong>CO2</strong> from 1983 to 2010, including<br />
deseasonalized long-term trend shown as a red<br />
line (top) and annual growth rate (bottom).<br />
variation in growth rate is larger in the Northern<br />
Hemisphere.<br />
Figure <strong>3.</strong>2 shows global monthly mean <strong>CO2</strong> mole<br />
fractions and their growth rates from 1983 to 2010.<br />
The global average mole fraction reached a new high<br />
of 389.0 ppm, in 2010 which is 138% of the<br />
pre-industrial level of 280 ppm. The annually averaged<br />
increase from 2009 to 2010 was 2.3 ppm, larger than<br />
the average of annual increases for the 1990s (about<br />
1.5 ppm/year) and that of the past decade (about 2.0<br />
ppm/year).<br />
The global growth rate shows large interannual<br />
variations, with an instantaneous maximum of about 3<br />
ppm/year in 1998 and a minimum below 1 ppm/year in<br />
1992. There were short periods of high rates in<br />
1987/1988, 1997/1998, 2002/2003, 2005/2006 , 2007<br />
and 2009/2010.<br />
Figure <strong>3.</strong>3 shows monthly mean mole fractions and<br />
long-term trends from 1983 to 2010 for each 30°<br />
latitudinal zone, indicating that there were clear<br />
long-term increases in both hemispheres and seasonal<br />
variations in the Northern Hemisphere.<br />
Fig. <strong>3.</strong>3 Monthly mean mole fractions of <strong>CO2</strong><br />
from 1983 to 2010 for each 30° latitudinal<br />
zone (dots) and their deseasonalized<br />
long-term trends (red lines).
As shown in Figure <strong>3.</strong>4, the growth rates for each<br />
30° latitude zone fluctuated between –0.3 and <strong>3.</strong>6<br />
ppm/year, with the largest interannual variability in<br />
northern high latitudes. High growth rates for all 30°<br />
latitude zones were observed in 1987/1988, 1997/1998,<br />
2002/2003, 2005, 2007, with negative rates recorded in<br />
northern high latitudes in 1992.<br />
Changes in growth rate are partly associated with El<br />
Niño-Southern Oscillation (ENSO). The El Niño<br />
events in 1982/1983, 1986–1988, 1991/1992,<br />
1997/1998 and 2002/2003coincided with high growth<br />
rates of <strong>CO2</strong>, with an exception in 1992. The growth<br />
rates of <strong>CO2</strong> observed by aircraft at high altitudes<br />
(8–13 km) over the Pacific Ocean were also associated<br />
with ENSO (Matsueda et al., 2002). The latest El Niño<br />
event has occurred in 2009/2010.<br />
During El Niño events, the up-welling of <strong>CO2</strong>-rich<br />
ocean water in the eastern equatorial Pacific is<br />
suppressed, resulting in reduced <strong>CO2</strong> emissions from<br />
this area. In contrast, El Niño events induce high<br />
temperature anomalies in many areas, particularly in<br />
the tropics, resulting in increased <strong>CO2</strong> emissions from<br />
the terrestrial biosphere due to the enhanced respiration<br />
of plants and activated decomposition of organic<br />
matter in soil (Keeling et al., 1995). This effect is<br />
enhanced by the suppression of plant photosynthesis in<br />
areas of anomalously low precipitation, particularly in<br />
the tropics. These oceanic and terrestrial processes<br />
during El Niño events have opposing effects, but<br />
Heimann and Reichstein (2008) suggested that the<br />
latter was the main cause of the variation in the <strong>CO2</strong><br />
growth rate.<br />
Fig. <strong>3.</strong>4 Long-term trends in the mole fraction<br />
of <strong>CO2</strong> for each 30° latitudinal zone (top) and<br />
their growth rates (bottom) .<br />
However, an exceptionally low <strong>CO2</strong> growth rate<br />
occurred during the El Niño event in 1991/1992. The<br />
injection of 14–20 Mt of SO2 aerosols into the<br />
stratosphere by the Mount Pinatubo eruption in June<br />
1991 affected the radiation budget and atmospheric<br />
circulation (Hansen et al., 1992; Stenchikov et al.,<br />
2002), resulting in a drop in global temperature.<br />
Angert et al. (2004) suggested that the low <strong>CO2</strong> growth<br />
rate observed during this El Niño event was due to<br />
reduced <strong>CO2</strong> emissions caused by consequent changes<br />
in the respiration of terrestrial vegetation and the<br />
decomposition of organic matter (Conway et al., 1994;<br />
Lambert et al., 1995; Rayner et al., 1999), and by<br />
enhanced <strong>CO2</strong> absorption due to intensive<br />
photosynthesis caused by an increase in diffuse<br />
radiation (Gu et al., 2003).<br />
Seasonal cycle of <strong>CO2</strong> mole fraction in the<br />
atmosphere<br />
Figure <strong>3.</strong>5 shows average seasonal cycles in the<br />
mole fraction of <strong>CO2</strong> for each 30° latitudinal zone.<br />
The seasonal cycles are clearly large in amplitude in<br />
northern high and mid-latitudes and small in the<br />
Southern Hemisphere. The seasonal cycle in the<br />
Northern Hemisphere is mainly dominated by the land<br />
biosphere (Nevison et al., 2008), and it is characterized<br />
by rapid decreases from June to August and large<br />
returns from September to December.<br />
Fig. <strong>3.</strong>5 Average seasonal cycles in the mole<br />
fraction of <strong>CO2</strong> for each 30° latitudinal zone<br />
obtained by subtracting long-term trends from<br />
the zonal mean time series. Error bar<br />
expresses standard deviation of each month.<br />
The mole fractions of <strong>CO2</strong> in northern low latitudes<br />
lagged behind that in high latitudes by one or two<br />
months. Minimum values appeared in August in<br />
northern high and mid-latitudes and in September in<br />
northern low latitudes.<br />
In the Southern Hemisphere, seasonal variations<br />
showed small amplitudes with a half-year delay due to<br />
small amounts of net emission and absorption by the<br />
terrestrial biosphere. Seasonal variations in both<br />
northern and southern mid-latitudes were apparently
superimposed in southern low latitudes (0–30°S).<br />
The direct influence of sources and sinks in the<br />
Southern Hemisphere may be partially cancelled by<br />
the propagation of an antiphase variation from the<br />
Northern Hemisphere.<br />
Figure <strong>3.</strong>6 shows latitudinal distributions of the mole<br />
fractions of <strong>CO2</strong> in January, April, July and October<br />
2010, from sites marked with an asterisk in Plate <strong>3.</strong>1.<br />
In latitudes north of 30°N, the mole fractions increased<br />
towards higher latitudes in January and April, and<br />
decreased towards higher latitudes in July,<br />
corresponding to the large seasonal variations in<br />
northern high and mid-latitudes, variations associated<br />
with activities of the terrestrial biosphere.<br />
Fig. <strong>3.</strong>6 Latitudinal distributions of the monthly<br />
mean mole fractions of <strong>CO2</strong> in January, April,<br />
July and October 2010.