TCC News No. 25
TCC News No. 25
TCC News No. 25

Create successful ePaper yourself
Turn your PDF publications into a flip-book with our unique Google optimized e-Paper software.
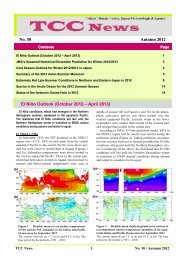
<strong>No</strong>. <strong>25</strong> Summer 2011<br />
Contents Page<br />
The Urban Heat Island Effect in Japan’s Major Cities<br />
Summary of Kosa (Aeolian dust) Events over Japan in 2011<br />
Sea Ice in the Sea of Okhotsk for the 2010/2011 Winter Season<br />
JMA’s New Climatological <strong>No</strong>rmals for Atmospheric Circulation Fields<br />
The GFCS at the Sixteenth World Meteorological Congress<br />
Introduction of New Services Available on the <strong>TCC</strong> Website<br />
<strong>TCC</strong> and GPC Tokyo’s Introduction as Operational DCPCs for the WMO Information System (WIS)<br />
New Head of the Tokyo Climate Center<br />
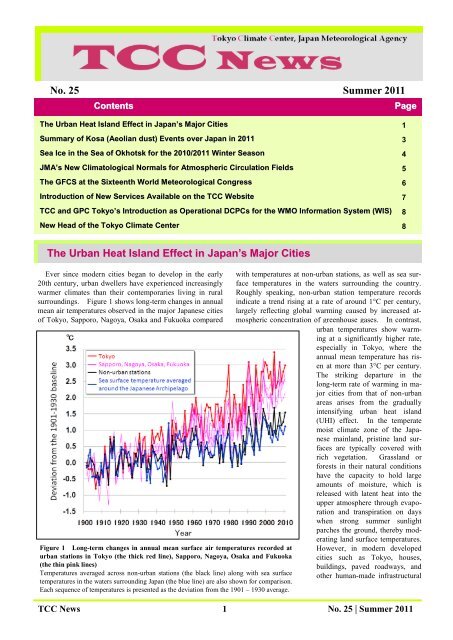
The Urban Heat Island Effect in Japan’s Major Cities<br />
Ever since modern cities began to develop in the early<br />
20th century, urban dwellers have experienced increasingly<br />
warmer climates than their contemporaries living in rural<br />
surroundings. Figure 1 shows long-term changes in annual<br />
mean air temperatures observed in the major Japanese cities<br />
of Tokyo, Sapporo, Nagoya, Osaka and Fukuoka compared<br />
Figure 1 Long-term changes in annual mean surface air temperatures recorded at<br />
urban stations in Tokyo (the thick red line), Sapporo, Nagoya, Osaka and Fukuoka<br />
(the thin pink lines)<br />
Temperatures averaged across non-urban stations (the black line) along with sea surface<br />
temperatures in the waters surrounding Japan (the blue line) are also shown for comparison.<br />
Each sequence of temperatures is presented as the deviation from the 1901 – 1930 average.<br />
with temperatures at non-urban stations, as well as sea surface<br />
temperatures in the waters surrounding the country.<br />
Roughly speaking, non-urban station temperature records<br />
indicate a trend rising at a rate of around 1°C per century,<br />
largely reflecting global warming caused by increased atmospheric<br />
concentration of greenhouse gases. In contrast,<br />
urban temperatures show warming<br />
at a significantly higher rate,<br />
especially in Tokyo, where the<br />
annual mean temperature has risen<br />
at more than 3°C per century.<br />
The striking departure in the<br />
long-term rate of warming in major<br />
cities from that of non-urban<br />
areas arises from the gradually<br />
intensifying urban heat island<br />
(UHI) effect. In the temperate<br />
moist climate zone of the Japanese<br />
mainland, pristine land surfaces<br />
are typically covered with<br />
rich vegetation. Grassland or<br />
forests in their natural conditions<br />
have the capacity to hold large<br />
amounts of moisture, which is<br />
released with latent heat into the<br />
upper atmosphere through evaporation<br />
and transpiration on days<br />
when strong summer sunlight<br />
parches the ground, thereby moderating<br />
land surface temperatures.<br />
However, in modern developed<br />
cities such as Tokyo, houses,<br />
buildings, paved roadways, and<br />
other human-made infrastructural<br />
<strong>TCC</strong> <strong>News</strong> 1 <strong>No</strong>. <strong>25</strong> | Summer 2011<br />
1<br />
3<br />
4<br />
5<br />
6<br />
7<br />
8<br />
8
elements proliferate in a way that gradually encroaches upon<br />
vegetation. On dry, impermeable and lifeless urban surfaces<br />
with little vegetation left, the natural cooling thermostat<br />
based on evaporation and transpiration ceases to work.<br />
During the night, the high-rise buildings that pack city<br />
centers impede cooling caused by the emission of infrared<br />
radiation into space because of the reduced portion of open<br />
sky viewable from a given point on an urban surface. This<br />
increased urban canopy roughness reduces the passage of<br />
wind, leading to lower efficiency in the upward turbulent<br />
diffusion of near-surface heat. Additionally, anthropogenic<br />
heat emitted from air-conditioners, automobiles and other<br />
equipment that consumes energy cannot be underestimated<br />
in highly populated city centers. These factors are all<br />
known to contribute in varying degrees to the formation of<br />
UHI.<br />
Given that UHI is a climatological phenomenon whose<br />
effects are seen on a spatially limited scale of perhaps less<br />
than 100 km, it is obviously beyond the scope of the existing<br />
meteorological observation network to fully capture the effect’s<br />
spatial structure and evolution over time. The Japan<br />
Figure 2<br />
(a) Surface air temperatures over the Kanto Plain at 3 p.m. on 17 August 2010, as<br />
reproduced by a UCM simulation<br />
(b) UHI intensity defined as temperature differences between the urban simulation<br />
and the hypothetical non-urban simulation<br />
(c) UHI intensity in a northwest-southeast vertical section across the line segment<br />
connecting Point A through the center of Tokyo to Point B (shown in Map (b))<br />
The arrows represent wind velocity differences between the urban simulation and the<br />
non-urban simulation. The contours indicate potential temperatures.<br />
Meteorological Agency (JMA) operates a numerical urban<br />
climate model (UCM) that can resolve the atmosphere into<br />
4-km horizontal grids to allow investigation of how UHI<br />
evolves in Japan’s metropolitan regions and measurement of<br />
the extent to which the phenomenon accounts for higher<br />
urban temperatures. Climate model simulation makes it<br />
possible to reproduce temperatures under actual urban<br />
ground conditions as well as to estimate how the climate<br />
might be under hypothetical ground conditions with no influence<br />
from urbanization. Comparing the results of hypothetical<br />
non-urban simulations with those of realistic urban<br />
simulations produces a clear picture of UHI’s characteristics.<br />
On 17 August, 2010, the temperature soared to 37.2°C<br />
according to the thermometer at the station of JMA’s headquarters<br />
in Tokyo. This was the highest temperature of the<br />
summer, which in turn proved to be the hottest season in<br />
more than a century of climate records. The results of<br />
UCM simulations for that day are shown in Figure 2. The<br />
urban simulation with actual ground boundary conditions<br />
reproduces high surface air temperatures exceeding 35°C<br />
from the coast of Tokyo Bay toward<br />
the inland area of the Kanto<br />
Plain (Figure 2 (a)). The<br />
non-urban simulation with ground<br />
boundary conditions replaced by<br />
hypothetical pristine grassland<br />
provides reference temperatures<br />
for comparison (not shown).<br />
Subtracting the non-urban temperatures<br />
from the urban temperatures<br />
on a grid-by-grid basis produces<br />
a snapshot of UHI intensity<br />
(Figure 2 (b)).<br />
It is notable that the peak UHI<br />
intensity, which is larger than<br />
+3°C, does not appear in the most<br />
densely populated area along the<br />
coast of Tokyo Bay, but instead<br />
tends to sprawl further inland.<br />
The landward shift of the peak<br />
UHI appearance indicates that the<br />
relatively cool sea breeze from<br />
Tokyo Bay is hampered from<br />
reaching inland areas by increased<br />
surface roughness and a<br />
well-developed vertical mixed<br />
layer over central Tokyo (Figure 2<br />
(c)).<br />
(Yoshinori Oikawa,<br />
Climate Prediction Division)<br />
<strong>TCC</strong> <strong>News</strong> 2 <strong>No</strong>. <strong>25</strong> | Summer 2011
Summary of Kosa (Aeolian dust) Events over Japan in 2011<br />
Characteristics of Kosa events in 2011<br />
From January – June 2011, the number of days on which<br />
meteorological stations in Japan observed Kosa was 14,<br />
which was below the 1981 – 2010 normal of 23.1 (Figure 3,<br />
left). The total number of stations observing Kosa (referred<br />
to here simply as the total number of stations) over<br />
the same period was 220, which was near the normal of<br />
212.7 (Figure 3, right).<br />
The monthly total number of stations for May was 194<br />
(normal: 32.9), which was the highest figure for the month<br />
since records began in 1967 (Figure 3, right). The main<br />
reason for this is that widespread Kosa moved over to Japan<br />
and many stations in the country observed it in the early part<br />
of the month.<br />
Figure 3 Monthly number of days when meteorological stations in Japan observed Kosa (left), and the monthly<br />
total number of stations observing Kosa (right) from January – June 2011<br />
The red and yellow bars show the values for 2011 and the 1981 – 2010 normals, respectively.<br />
Significant Kosa event in early May<br />
Kosa was observed at many stations in western Japan,<br />
eastern Japan and Okinawa/Amami from 1 to 5 May.<br />
Minimum visibility of less than 5 km was observed at stations<br />
in Kyushu and elsewhere (Table 1). On 2 May, Kosa<br />
was observed at 43 out of 61 stations (Figure 4), which was<br />
the third-highest number for May and the eighth-highest for<br />
the year since records began in 1967. Although the Kosa<br />
event made the headlines on television and in newspapers,<br />
no flight cancellations or delays were reported.<br />
JMA’s Kosa prediction model forecasted this significant<br />
event, projecting that a large dust storm would arise around<br />
the Gobi Desert on 24 April, five days prior to the Kosa’s<br />
Figure 4 Meteorological stations observing Kosa and<br />
minimum visibility values for 2 May<br />
appearance (Figure 5). JMA closely monitored this area<br />
and confirmed surface observation reports of a dust storm<br />
with visibility levels of less than 2 km (Figure 6, left). The<br />
large dust storm around the Gobi Desert was also confirmed<br />
by analysis using MTSAT-2 satellite data (Figure 6, right).<br />
The Kosa prediction model forecasted that a dense mass of<br />
dust would move across <strong>No</strong>rth China and Korea and cover<br />
many areas of Japan. <strong>News</strong> reports detailed a dense dust<br />
storm over large areas of China and Korea, and JMA released<br />
information about the Kosa event to the public in<br />
order to call attention to it.<br />
(<strong>No</strong>zomu Ohkawara, Atmospheric Environment Division)<br />
Table 1 Daily number of stations observing Kosa and<br />
minimum visibility values recorded at stations from 1<br />
to 5 May<br />
<strong>TCC</strong> <strong>News</strong> 3 <strong>No</strong>. <strong>25</strong> | Summer 2011<br />
Date<br />
Number<br />
of Stations<br />
Minimum Visibility<br />
(Station Name)<br />
1 May 14 4 km (Fukuoka)<br />
2 May 43 3 km (Kumamoto)<br />
3 May 38 3 km (Kagoshima)<br />
4 May 29 5 km (Nara)<br />
5 May 16 10 km (Fukuoka, etc)
Figure 5 Forecast of surface dust concentration<br />
and surface wind by JMA’s Kosa<br />
prediction model for 12 JST (03 UTC) on<br />
29 April (initial time: 21 JST (12 UTC) on<br />
24 April)<br />
The red dashed circle shows a large dust storm<br />
around the Gobi Desert.<br />
Figure 6 Meteorological stations in East Asia observing Kosa on 29 April (left) and the Kosa area analyzed<br />
from MTSAT-2 satellite data at 12 JST (03 UTC) on 29 April (right)<br />
The red dashed circle in each figure denotes the area shown in Figure 5.<br />
Sea Ice in the Sea of Okhotsk for the 2010/2011 Winter Season<br />
The sea ice extent in the Sea of Okhotsk was smaller<br />
than normal for almost the whole of the 2011 sea ice<br />
season.<br />
The sea ice extent in the Sea of Okhotsk was smaller<br />
than normal (i.e., the average for 1981 – 2010) for almost<br />
the whole of the 2011 sea ice season (from December<br />
2010 to May 2011) (Figure 7). It reached its<br />
seasonal maximum of 94.54 x 10 4 km 2 (below the<br />
normal of 116.92 x 10 4 km 2 ) on <strong>25</strong> March (Figures 7<br />
and 8). Figure 9 shows overall trends for the period<br />
from 1971 to 2011. Although the sea ice extent in the<br />
Sea of Okhotsk shows large interannual variations,<br />
there is a slight decreasing trend of 184 [70 – 298] x<br />
10 4 km 2 per decade (the numbers in square brackets<br />
indicate the two-sided 95% confidence interval) in the<br />
accumulated sea ice extent, and another slight decreasing<br />
trend of 6.0 [2.0 – 10.0] x 10 4 km 2 (equivalent to<br />
3.8% of the area of the Sea of Okhotsk) per decade in<br />
the maximum extent.<br />
(Ryohei Okada, Office of Marine Prediction) Figure 7 Seasonal variation of sea ice extent at five-day<br />
intervals in the Sea of Okhotsk from <strong>No</strong>vember 2010 to July<br />
2011<br />
<strong>TCC</strong> <strong>News</strong> 4 <strong>No</strong>. <strong>25</strong> | Summer 2011
Figure 8 Sea ice situation on <strong>25</strong> March<br />
2011<br />
The white area shows the observed sea ice<br />
extent, and the red line indicates the extent<br />
of normal coverage (1981 – 2010).<br />
Figure 9 Interannual variations in the maximum sea ice extent (red line)<br />
and the accumulated sea ice extent (green line) in the Sea of Okhotsk from<br />
1971 to 2011<br />
Accumulated sea ice extent: the sum of all five-day sea ice extent values from<br />
December to May<br />
JMA’s New Climatological <strong>No</strong>rmals for Atmospheric Circulation Fields<br />
On 18 May, 2011, JMA updated its climatological normals<br />
to the 1981 – 2010 averages for operational use in climate<br />
system monitoring and climate prediction. This report<br />
briefly describes the present normals of atmospheric circulation<br />
fields and summarizes their characteristics compared to<br />
the previous normals (i.e., the 1979 – 2004 average). For<br />
details of other climatological normals including surface<br />
observation data and oceanographic data, see <strong>TCC</strong> <strong>News</strong> <strong>No</strong>.<br />
24 (Spring 2011).<br />
The data used for monitoring and analyzing atmospheric<br />
circulation are global objective analysis figures from JMA's<br />
Climate Data Assimilation System (JCDAS), which is routinely<br />
operated and uses the same setup as that of the Japa-<br />
nese <strong>25</strong>-year reanalysis (JRA-<strong>25</strong>) (Onogi et al. 2007). The<br />
present atmospheric circulation normals are derived from the<br />
JRA/JCDAS data for the period from 1981 to 2010.<br />
In the period from 2005 to 2010, which is included only in<br />
the present normals, there were three La Niña events and just<br />
one El Niño event. Conversely, neither El Niño nor La<br />
Niña events were seen in 1979 and 1980, which are included<br />
only in the previous normals. Accordingly, differences<br />
between the present and previous normals of atmospheric<br />
circulation indicate patterns seen in past La Niña events,<br />
particularly in the tropics (Figure 10).<br />
Air temperatures for the lower and middle troposphere in<br />
the present normals are higher than those for the previous<br />
Figure 10 Differences between JMA’s<br />
new and old normals for 200-hPa velocity<br />
potential (top: January; bottom: July)<br />
The shading indicates deviations of<br />
200-hPa velocity potential for the new<br />
normal from that for the old normal. The<br />
contours and vectors show 200-hPa velocity<br />
potential and divergent wind for the new<br />
normal, respectively.<br />
<strong>TCC</strong> <strong>News</strong> 5 <strong>No</strong>. <strong>25</strong> | Summer 2011
normals (Figure 11). This may be associated with global<br />
warming and decadal-scale variability. It should be<br />
noted that air temperatures for the stratosphere in the<br />
present normals include a negative bias because such a<br />
bias is seen in JRA-<strong>25</strong> stratospheric temperature data for<br />
the period between 1979 and 1998 (JMA 2007).<br />
Reference<br />
JMA, 2007: New climatological normals based on the JRA-<strong>25</strong>.<br />
Monthly Report on Climate System Separated Volume<br />
<strong>No</strong>.13, 139 pp.<br />
Onogi, K., J. Tsutsui, H. Koide, M. Sakamoto, S. Kobayashi, H.<br />
Hatsushika, T. Matsumoto, N. Yamazaki, H. Kamahori, K.<br />
Takahashi, S. Kadokura, K. Wada, K. Kato, R. Oyama, T.<br />
Ose, N. Mannoji and R. Taira, 2007: The JRA-<strong>25</strong> Reanalysis.<br />
J. Meteor. Soc. Japan, 85, 369-432.<br />
(Shotaro Tanaka and Hiroshi Ohno,<br />
Climate Prediction Division)<br />
Figure 11 Differences between JMA’s new and old normals<br />
of 850-hPa temperature (left: January; right: July)<br />
The shading indicates deviations of 850-hPa temperature for the<br />
new normal from that for the old normal. The contours show<br />
850-hPa temperature for the new normal.<br />
The GFCS at the Sixteenth World Meteorological Congress<br />
The Sixteenth World Meteorological Congress (Cg-XVI)<br />
was held in Geneva, Switzerland, from 16 May to 3 June,<br />
2011, with the participation of more than 600 delegates,<br />
including senior government officials, heads of National<br />
Meteorological and Hydrological Services (NMHSs), and<br />
representatives of WMO partner organizations. One of the<br />
key issues at Cg-XVI was the establishment of the Global<br />
Framework on Climate Services (GFCS), which was proposed<br />
by the World Climate Conference-3 (WCC-3) (held in<br />
Geneva from 31 August to 4 September 2009) (see <strong>TCC</strong><br />
<strong>News</strong> <strong>No</strong>. 21 (Summer 2010)). The congress decided that<br />
the framework would be one of the top five priorities of<br />
WMO over the next four years. The GFCS implementation<br />
plan will be developed by the WMO Executive Council<br />
for review and adoption at a 2012 extraordinary session of<br />
the World Meteorological Congress, which all relevant<br />
stakeholders (including UN bodies) are expected to attend.<br />
In order to provide comprehensive and coherent information<br />
on the various components of the GFCS to congress<br />
delegates, a series of six interconnected side events on the<br />
theme of “The Role of NMHSs within the Global Framework<br />
for Climate Services (GFCS)" was organized. One<br />
of these events, entitled “Facilitating the Flow of Climate<br />
Information,” introduced the coordinated Climate Services<br />
Information System (CSIS). This is a system to protect<br />
and distribute climate data and information according to the<br />
needs of users and according to the procedures agreed by<br />
governments and other data providers, and comprises<br />
global, regional and national centres and entities that generate/process<br />
climate information (Figure 12). This event<br />
was held on the evening of 20 May, 2011, and was moderated<br />
by Dr Richard Graham from the UK Met Office. As<br />
one of three lead speakers, <strong>TCC</strong> Head Ms Teruko Manabe<br />
gave a presentation on regional aspects of CSIS, including<br />
the activities of Regional Climate Centres (RCCs) and Regional<br />
Climate Outlook Forums (RCOFs).<br />
Figure 12<br />
The three geographic domains<br />
(global, regional and national) and<br />
nodes in the CSIS<br />
<strong>TCC</strong> <strong>News</strong> 6 <strong>No</strong>. <strong>25</strong> | Summer 2011
The congress recognized the important role of RCCs<br />
in tailoring global climate products to regional needs on<br />
a sustainable operational mode, and also in supporting<br />
national requirements of NMHSs where needed through<br />
mutual arrangements.<br />
In accordance with the discussions held at Cg-XVI<br />
and the development of the GFCS, <strong>TCC</strong> will further enhance<br />
its activities to support climate services provided<br />
by NMHSs in the Asia-Pacific region.<br />
(Teruko Manabe, Tokyo Climate Center,<br />
Climate Prediction Division)<br />
Introduction of New Services Available on the <strong>TCC</strong> Website<br />
1. Addition of a new element (sea surface temperature)<br />
to the three-month probability forecast<br />
<strong>TCC</strong> provides tercile probability forecasts for<br />
three-month-averaged temperature and precipitation.<br />
These forecasts are generated using the model output statistics<br />
(MOS) technique based on the 30-year hindcast.<br />
In addition, the same forecast for sea surface temperature<br />
is now also produced (Figure 13). As with other forecasts,<br />
information on the level of forecast skill and verification<br />
data can be accessed by clicking any grid on the<br />
map. The forecast is normally updated around the 20th of<br />
every month, and is available at<br />
http://ds.data.jma.go.jp/tcc/tcc/products/model/probfcst/4<br />
mE/index.html.<br />
2. Warm/cold season probability forecasts and verification<br />
<strong>TCC</strong> has started providing warm/cold season probability<br />
forecasts for temperature, precipitation and sea surface<br />
temperature (Figure 14). The warm season is the period<br />
from June to August, and the cold season runs from December<br />
to February.<br />
The probability forecast as well as information on the<br />
level of forecast skill and verification data can be accessed<br />
by clicking any grid on the map.<br />
The warm season probability forecast is issued in February,<br />
March and April, and the cold season forecast in<br />
September and October. The next forecast will be for<br />
the cold season from December 2011 to February 2012,<br />
and will be made available in September 2011 at<br />
http://ds.data.jma.go.jp/tcc/tcc/products/model/probfcst/7<br />
mE/index.html.<br />
3. New provision of daily gridded data of one-month<br />
Forecasting<br />
<strong>TCC</strong> starts providing daily gridded data (ensemble<br />
mean) of one-month forecasting in September 2011. The<br />
elements are almost equivalent for those of currently provided<br />
weekly data (ensemble mean), while daily spread<br />
and large anomaly index are not provided. The provision<br />
of weekly data (ensemble mean) will terminate in December<br />
2011. More details are announced on the <strong>TCC</strong><br />
website.<br />
Figure 13 Three-month probability forecast of sea surface<br />
temperature for August – October 2011<br />
Figure 14 Warm season (June – August) probability forecast<br />
for temperature<br />
<strong>TCC</strong> <strong>News</strong> 7 <strong>No</strong>. <strong>25</strong> | Summer 2011
4. New website on statistical downscaling for seasonal<br />
forecast guidance<br />
<strong>TCC</strong> now provides a set of indices and gridded data<br />
that can be used to produce three-month and warm/cold<br />
season forecasts. From historical climate data<br />
(monthly/three-month mean temperature and/or precipitation),<br />
users can identify which indices show a close<br />
correlation to observation data in their countries and<br />
produce statistical guidance for three-month and<br />
warm/cold season forecasts. The site is open to registered<br />
NMHSs at<br />
http://ds.data.jma.go.jp/tcc/tcc/gpv/indices/index.html.<br />
(Ryuji Yamada, Tokyo Climate Center.<br />
Climate Prediction Division)<br />
<strong>TCC</strong> and GPC Tokyo’s Introduction as Operational DCPCs for the WMO<br />
Information System (WIS)<br />
WMO has developed the WMO Information System<br />
(WIS) as a single coordinated global infrastructure responsible<br />
for telecommunications and data management<br />
functions. WIS consists of three types of centers:<br />
Global Information Service Centres (GISCs), Data Collection<br />
or Production Centres (DCPCs), and National<br />
Centres (NCs). In addition to enhancing the existing<br />
Global Telecommunication System, WIS provides data<br />
discovery, access and retrieval (DAR) services for all<br />
weather, climate, water and related data produced in the<br />
framework of any WMO programme. For this purpose,<br />
DCPCs maintain catalogues of their data and products,<br />
and provide appropriate parts of these catalogues to<br />
GISCs.<br />
The Sixteenth World Meteorological Congress designated<br />
Tokyo as one of the GISCs in the WIS. The<br />
Tokyo Climate Center (<strong>TCC</strong>), the Global Producing<br />
Center of Long-range Forecasts (GPC) Tokyo and six<br />
other centers operated by JMA were also formally designated<br />
as DCPCs.<br />
GISC Tokyo and the eight DCPCs are operational as<br />
New Head of the Tokyo Climate Center<br />
Ms Teruko Manabe was appointed Head of the Tokyo<br />
Climate Center as of 1 April, 2011, succeeding Ms. Kumi<br />
Hayashi. Prior to joining <strong>TCC</strong>, Ms Manabe was the<br />
Head of the Office of Statistics in JMA. She has been<br />
Any comments or inquiry on this newsletter and/or the <strong>TCC</strong><br />
website would be much appreciated. Please e-mail to:<br />
tcc@met.kishou.go.jp<br />
(Editors: Teruko Manabe, Ryuji Yamada, Kenji Yoshida)<br />
Top page of the statistical downscaling website<br />
of 1 August, 2011. DAR services are expected to make<br />
products output by JMA’s DCPCs (including <strong>TCC</strong> and GPC)<br />
more easily searchable and accessible by users.<br />
For further information on WIS, GISC Tokyo and DCPCs,<br />
see the GISC Tokyo portal site at<br />
http://www.wis-jma.go.jp/cms/.<br />
Top page of the GISC Tokyo portal site<br />
with the Agency for over 20 years, in which time she also<br />
worked in the WMO Secretariat for six years.<br />
(Tokyo Climate Center)<br />
Tokyo Climate Center (<strong>TCC</strong>), Climate Prediction Division, JMA<br />
Address: 1-3-4 Otemachi, Chiyoda-ku, Tokyo 100-8122, Japan<br />
<strong>TCC</strong> Website: http://ds.data.jma.go.jp/tcc/tcc/index.html<br />
<strong>TCC</strong> <strong>News</strong> 8 <strong>No</strong>. <strong>25</strong> | Summer 2011