tcc@met.kishou.go.jp
tcc@met.kishou.go.jp
tcc@met.kishou.go.jp

Create successful ePaper yourself
Turn your PDF publications into a flip-book with our unique Google optimized e-Paper software.
Eighth Session of the Forum on Regional Climate<br />
Monitoring, Assessment and Prediction for Asia<br />
(FOCRAII)<br />
5-7 April 2012, Beijing, China<br />
Shuhei Maeda<br />
Climate Prediction Division<br />
Global Environment and Marine Department<br />
Japan Meteorological Agency<br />
E-mail: <strong>tcc@met</strong>.<strong>kishou</strong>.<strong>go</strong>.<strong>jp</strong>
1. Introduction<br />
CCl/CBS Expert Team on Regional Climate Centres<br />
Offenbach, Germany, 12 – 14 October 2011 2
WMO Regional Climate Centres are centres of excellence that create<br />
regional climate products including long-range forecasts in support<br />
of regional and national climate activities and thereby strengthen<br />
capacity of WMO Members in a given region to deliver better<br />
climate services to national users.<br />
The Tokyo Climate Center (TCC), as a WMO Regional Climate Center<br />
(RCC), supports the climate services of NMHSs in the Asia-Pacific<br />
region through the provision of climate data and products, and<br />
capacity-building activities.
Operational Activities for LRF<br />
Operational Activities for Climate<br />
Monitoring<br />
Operational Data Service, to support<br />
operational LRF and climate monitoring<br />
Training in the use of operational<br />
RCC products and services<br />
Links to products and services in line with<br />
RCC Mandatory Functions<br />
http://ds.data.jma.<strong>go</strong>.<strong>jp</strong>/tcc/tcc/index.html
2.Products and tools<br />
CCl/CBS Expert Team on Regional Climate Centres<br />
Offenbach, Germany, 12 – 14 October 2011 5
TCC provides tercile probabilistic<br />
forecasts of 2m temperature<br />
and total precipitation at a<br />
number of major stations in<br />
Southeast Asia, based on the<br />
needs of regional and subregional<br />
scale forecasts from<br />
NMHSs.<br />
In February this year, the<br />
number of available stations<br />
increased in accordance with<br />
minor revision of the<br />
probabilistic forecast system.<br />
Initial Forecast Time: 1 Mar. 2012<br />
Lead time: 2-15 days<br />
Element: Precipitation<br />
http://ds.data.jma.<strong>go</strong>.<strong>jp</strong>/tcc/tcc/products/guidancetst/
TCC started providing<br />
animation of JMA One-month<br />
EPS in October 2011 on an<br />
experimental basis.<br />
Available parameters<br />
• Northern Hemisphere<br />
Z500, T850, SLP<br />
• Tropics<br />
CHI200, PSI200, PSI850, U200,<br />
T 2m ……<br />
Only accessible for registered users<br />
(NMHSs) of gridded forecast products<br />
http://ds.data.jma.<strong>go</strong>.<strong>jp</strong>/tcc/tcc/gpv/mod<br />
el/Anime.1mE.experiment/anime.e.php
Also provided is a tool overviewing and downloading monthly world climate data. It<br />
allows the user to see and obtain monthly mean temperatures, monthly total<br />
precipitation amounts and its anomaly or ratio at all available stations.<br />
Since May 2011, new climatological normals for the period from 1981 to 2010 have<br />
been used.<br />
Monthly high, mean and low temperatures and monthly precipitation<br />
from Feb. 2011 to Jan. 2012 in Manila<br />
http://ds.data.jma.<strong>go</strong>.<strong>jp</strong>/gmd/tcc/climatview/
• A web-based application software for<br />
climatological analysis<br />
• A new version (Version 4) has been developed,<br />
enabling users to (1) use the JMA’s current<br />
operational ocean analysis data, (2) set the<br />
detailed graphics setting, and (3) download data<br />
in binary format, which is compatible to GrADS.<br />
Data<br />
Japanese 25-year ReAnalysis (JRA25) (1979-<br />
2004)<br />
JMA Climate Data Assimilation System (JCDAS)<br />
(2004 - Present)<br />
Daily Sea Surface Analysis for Climate<br />
Monitoring and Predictions (COBE-SST)<br />
OLR, CLIMAT<br />
http://extreme.<strong>kishou</strong>.<strong>go</strong>.<strong>jp</strong>/tool/itacs-tcc2011/
Latitude-Longitude<br />
Map<br />
Time-Longitude<br />
Cross Section<br />
Polar<br />
Stereographic Map<br />
Time-Series Graph<br />
Vertical Cross<br />
Section
NMHSs are expected to actively contribute to climate<br />
risk management, and must issue appropriate<br />
information in a timely manner when extreme events<br />
occur. Against this background, TCC is committed to<br />
assisting NMHSs in fulfilling their roles.<br />
In summer 2011, precipitation<br />
over the Indochina Peninsula<br />
continued to be above normal<br />
from June to September, which<br />
caused floods over a wide area in<br />
the basins of the Chao Phraya<br />
River and the Mekong River. The<br />
flood has caused serious damage<br />
over the Indochina Peninsula<br />
especially in Thailand. On 31<br />
October, 2011, TCC issued a<br />
report entitled “Heavy rainfall<br />
over the Indochina Peninsula for<br />
June – September 2011” on the<br />
TCC website.
In winter 2012, the Eurasian<br />
continent, especially in the midlatitudes,<br />
experienced<br />
significantly lower-than-normal<br />
temperatures due to strong<br />
cold-air inflow.<br />
Temperatures were extremely<br />
low from the northern part of<br />
East Asia to Central Asia (in and<br />
around Mon<strong>go</strong>lia and<br />
Kazakhstan) from mid- to late<br />
January. The influence of cold<br />
air extended to all over Central<br />
Asia, such as Uzbekistan and<br />
Tajikistan from the beginning of<br />
February.<br />
TCC issued a report “Cold Wave over the Eurasian<br />
Continent” on 6 February 2012 on its website.<br />
The Center also provided NMHSs in the affected areas with<br />
supplementary commentary on the situation as well as<br />
information on how to prepare the figures using web-based<br />
tools such as ITACS available on the TCC web.<br />
http://ds.data.jma.<strong>go</strong>.<strong>jp</strong>/tcc/tcc/news/index.html
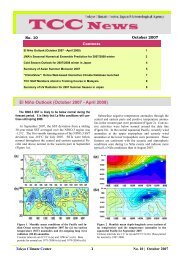
• TCC news is a quarterly newsletter<br />
issued in February, May, August and<br />
November containing articles on the<br />
latest climate information (significant<br />
climate events, seasonal outlook…..),<br />
introduction of TCC’s new products and<br />
relevant activity.<br />
• The latest issue (No. 27) is now available.<br />
http://ds.data.jma.<strong>go</strong>.<strong>jp</strong>/tcc/tcc/news/index.html
3. Capacity building activities<br />
CCl/CBS Expert Team on Regional Climate Centres<br />
Offenbach, Germany, 12 – 14 October 2011 14
TCC puts emphasis on capacity-building activities through annual training seminars<br />
focusing on operational climate services. The topic of the seminar changes from year<br />
to year, depending on requirements from NMHSs and TCC’s progress in climate and<br />
analysis capabilities, such as the introduction of upgraded climate models.<br />
Theme Participants<br />
Nov. 2008 Climate Information and<br />
Forecasting<br />
Dec. 2009 Climate Analysis using<br />
Reanalysis Data<br />
Jan. 2011 Application of Seasonal Forecast<br />
Gridded Data to Seasonal<br />
Forecast Products<br />
13: China, Hong Kong, India, Indonesia, Iran, Korea (2), Lao, Malaysia,<br />
Mon<strong>go</strong>lia, Philippines, Thailand, Viet Nam<br />
11: Bangladesh, Indonesia, Laos, Malaysia, Mon<strong>go</strong>lia, Pakistan, Papua New<br />
Guinea, Philippines, Sri Lanka, Thailand, Viet Nam<br />
19: Bangladesh, Hong Kong, Indonesia, Kazakhstan, Laos, Malaysia,<br />
Maldives, Myanmar, Nepal, Pakistan, Philippines (2), Qatar, Singapore, Sri<br />
Lanka, Thailand, Uzbekistan, Viet Nam<br />
Nov. 2011 One-month Forecast Products 13: Bangladesh, Cambodia, Hong Kong, Indonesia, Laos, Malaysia,<br />
Mon<strong>go</strong>lia, Myanmar, Pakistan, Philippines, Sri Lanka, Thailand, Viet Nam<br />
15
Materials and presentations of past training seminars are available on the<br />
TCC website.<br />
Theme Participants<br />
Nov. 2008 Climate Information and<br />
Forecasting<br />
Dec. 2009 Climate Analysis using<br />
Reanalysis Data<br />
Jan. 2011 Application of Seasonal Forecast<br />
Gridded Data to Seasonal<br />
Forecast Products<br />
13: China, Hong Kong, India, Indonesia, Iran, Korea (2), Lao, Malaysia,<br />
Mon<strong>go</strong>lia, Philippines, Thailand, Viet Nam<br />
11: Bangladesh, Indonesia, Laos, Malaysia, Mon<strong>go</strong>lia, Pakistan, Papua New<br />
Guinea, Philippines, Sri Lanka, Thailand, Viet Nam<br />
19: Bangladesh, Hong Kong, Indonesia, Kazakhstan, Laos, Malaysia,<br />
Maldives, Myanmar, Nepal, Pakistan, Philippines (2), Qatar, Singapore, Sri<br />
Lanka, Thailand, Uzbekistan, Viet Nam<br />
Nov. 2011 One-month Forecast Products 13: Bangladesh, Cambodia, Hong Kong, Indonesia, Laos, Malaysia,<br />
Mon<strong>go</strong>lia, Myanmar, Pakistan, Philippines, Sri Lanka, Thailand, Viet Nam<br />
This year’s training seminar will be held in autumn in the JMA<br />
Headquarters. Detailed information will be provided in due course.
4. JRA-55<br />
CCl/CBS Expert Team on Regional Climate Centres<br />
Offenbach, Germany, 12 – 14 October 2011 17
JRA-55 Reanalysis system<br />
JRA-25 JRA-55<br />
Reanalysis years 1979-2004 (26 years) 1958-2012 (55 years)<br />
Equivalent<br />
operational NWP<br />
system<br />
Resolution<br />
As of Mar. 2004 As of Dec. 2009<br />
T106L40 (~120km)<br />
(top layer at 0.4 hPa)<br />
TL319L60 (~60km)<br />
(top layer at 0.1 hPa)<br />
Time integration Eularian Semi-Lagrangian<br />
Assimilation<br />
scheme<br />
Bias correction<br />
(satellite<br />
radiance)<br />
Tropical Cyclone<br />
3D-Var<br />
Adaptive method<br />
(Sakamoto et al. 2009)<br />
Wind profile retrievals (TCRs)<br />
provided by Dr.Fiorino were<br />
assimilated.<br />
4D-Var<br />
(with T106 inner model)<br />
Variational Bias Correction<br />
(Dee et al. 2009)<br />
Same as JRA-25<br />
18
JRA-55 progress status<br />
June 1972 March 1998<br />
Completed as of 2 April, 2012<br />
JRA-55 will be completed in the first half of 2013.<br />
19
Comparison of<br />
Forecast<br />
Scores<br />
RMSE of Z500 for<br />
NH and SH<br />
NH<br />
SH<br />
20
Forecast map<br />
Update interval<br />
One-month Forecast: Every Friday<br />
Three-month Forecast: Every month<br />
Warm season Forecast: Feb., Mar. and Apr.<br />
Cold season Forecast: Sep. and Oct.<br />
Verification map<br />
Forecast and verification maps<br />
for one-month, three-month and<br />
warm/cold season forecasts are<br />
available.<br />
http://ds.data.jma.<strong>go</strong>.<strong>jp</strong>/tcc/tcc/products/model/index.html
Registered users (NMHSs) can download<br />
and LRF products. Format: GRIB2.<br />
http://ds.data.jma.<strong>go</strong>.<strong>jp</strong>/tcc/tcc/gpv/index.html
TCC provides verification results (e.g., SVS LRF scores, Brier Skill Scores, ROC, Hit Rate Skill<br />
Score) and hindcast data for several elements including 2-m temperature and total<br />
precipitation. Whenever an LRF system is updated, a set of hindcasts is implemented and<br />
verification datasets are distributed.<br />
Verification results (Brier Skill Score (left) and<br />
ROC (right)) for 2m mean temperature<br />
http://ds.data.jma.<strong>go</strong>.<strong>jp</strong>/tcc/tcc/products<br />
/model/verif/1mE/index.html
Weekly, Monthly, Seasonal and Annual Temperature/Precipitation<br />
Hazardous Climatic Events (Flood/Drought/Tropical Cyclone)<br />
Distribution of Monthly Extreme Climate (August 2011)<br />
1. High temp. from central Siberia to northern China<br />
2. Heavy prec. in western Europe<br />
3. Low temp. around the UK<br />
4. Light prec. in southern Europe<br />
5. Heavy prec. in the northeastern USA<br />
6. High temp. and light prec. from the southern USA to Mexico<br />
7. High temp. in northern South America<br />
8. High temp. in southeastern and southwestern Australia<br />
http://ds.data.jma.<strong>go</strong>.<strong>jp</strong>/tcc/tcc<br />
/products/climate/index.html
Weekly Temperature Anomaly (top) and<br />
Precipitation Ratio (bottom)<br />
(21 – 27 September 2011)<br />
http://ds.data.jma.<strong>go</strong>.<strong>jp</strong>/tcc/tcc<br />
/products/climate/index.html
For monitoring Asian Monsoon, TCC provides monthly mean and anomaly of<br />
Stream Function, Wind and OLR in the 850hPa height field.<br />
http://ds.data.jma.<strong>go</strong>.<strong>jp</strong>/tcc/tcc/products<br />
/clisys/ASIA_TCC/map1_mon.html
Atmospheric Circulation: Global Objective Analysis Data by JMA<br />
Tropical Convective Activity: Satellites Observations (NOAA/NESDIS)<br />
Sea Surface Temperature: Global SST Analysis Data by JMA<br />
Snow and Sea Ice: CLIMAT Reports & Satellite Observations (SSM/I)<br />
⇒ Monthly Highlights on Climate System<br />
OLR Anomaly<br />
200hPa Stream Function & Wind Anomalies<br />
SST Anomaly<br />
Number of days covered with snow observed by<br />
SSM/I (left) and its anomaly (right)<br />
http://ds.data.jma.<strong>go</strong>.<strong>jp</strong>/tcc/tcc/pro<br />
ducts/clisys/highlights/index.html
JMA’s El Niño Monitoring Areas<br />
Time series of sea surface temperature<br />
deviations from the climatological<br />
mean based on a sliding 30-year period<br />
for NINO.3 and SOI<br />
Outlook of sea surface<br />
temperature anomalies for<br />
NINO.3 until March 2012<br />
http://ds.data.jma.<strong>go</strong>.<strong>jp</strong>/tcc/tcc<br />
/products/elnino/index.html
Annual anomalies of surface temperature<br />
averaged over the globe<br />
(Base period for the normal: 1981- 2010)<br />
Projection of warming in winter (December-<br />
February) for scenario A1B for the period<br />
2080 - 2099 relative to the period 1980 - 1999<br />
conducted using 21 climate models (used the<br />
report of working group I to the IPCC Fourth<br />
Assessment Report)<br />
http://ds.data.jma.<strong>go</strong>.<strong>jp</strong>/tcc/tcc/products/gwp/gwp.html