Intermezzo 1.2s OM
Intermezzo 1.2s OM
Intermezzo 1.2s OM

Create successful ePaper yourself
Turn your PDF publications into a flip-book with our unique Google optimized e-Paper software.
The pointer on the slider will indicate the correct width setting.<br />
Enter this number in the Width field of the Measurement Template.<br />
In our example, the width is 12.5%.<br />
It is not realistic to expect a perfect fit. Acoustic<br />
measurements encompass the behavior of not only the speakers<br />
but of the room and its contents as well. Reflected energy,<br />
standing waves and ambient noise all add their part. Determining<br />
the best width setting nearly always requires compromise.<br />
Level<br />
This setting will define the amount (level) you want to reduce the<br />
peak, in decibels.<br />
The R.A.B.O.S. level adjustment is limited to attenuation only, and<br />
is adjustable from 0dB to -14dB. After optimization, the R.A.B.O.S.<br />
equalizer will eliminate the largest low-frequency peak;<br />
therefore, the broadband bass level can be increased without<br />
overpowering the midrange frequencies. R.A.B.O.S. applies this<br />
compensation automatically.<br />
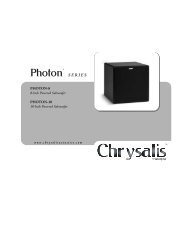
You will use the Width Selector as an aid in determining the<br />
correct level setting. Place the Width Selector as described<br />
above and adjust it to the correct width. Observe the first<br />
frequency point on the high-frequency side of the peak that no<br />
longer follows the slope of the Width Selector. In this example<br />
this is 56Hz. Calculate the average level of the readings from<br />
56Hz up to 100Hz; that is, 10 data points in this example.<br />
56Hz 63Hz 66Hz 72Hz 77Hz 80Hz 85Hz 90Hz 95Hz 100Hz<br />
-9 -10 -8 -9 -10 -9 -8 -10 -10 -9 - 92 ÷ 10 = -9.2<br />
Whenever your answer has a remainder, always round down<br />
(disregarding the negative [-]) to the next whole number.<br />
In our example, you would enter 9 in the attenuation field.<br />
This may not be the best method in all cases.The next section<br />
contains several other examples.<br />
What You Measure, What To Do<br />
As stated earlier, it is not possible to anticipate the effect of<br />
every possible listening environment. However, most residential<br />
sound rooms share many characteristics, and their dimensions<br />
fall into a range that make some response irregularities far more<br />
likely than others. On the following pages are examples of what<br />
you may encounter. Following each example is a strategy for<br />
correction. Compare your measurement results with the following<br />
examples. Find the one that best fits your graph and follow the<br />
instructions presented for that scenario.<br />
Remember, when looking for a match, look at the<br />
descriptive characteristics, not any specific frequency or level.<br />
Each of these examples can occur at any frequency, bandwidth<br />
and level. It is unlikely that your test results will be exactly as<br />
depicted in these examples.<br />
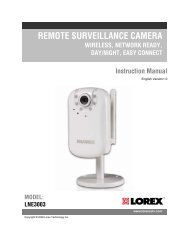
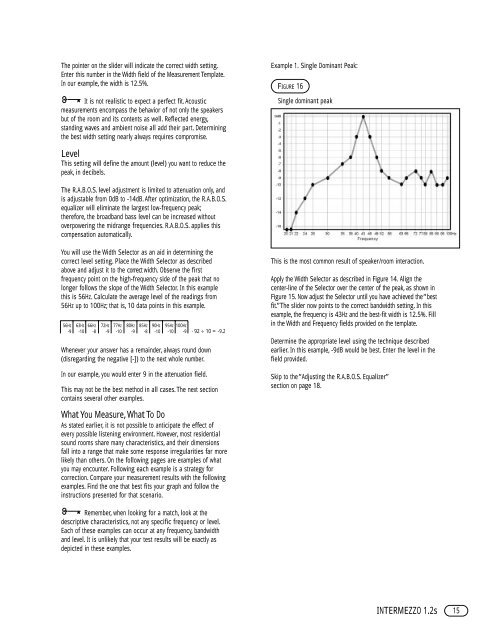
Example 1. Single Dominant Peak:<br />
FIGURE 16<br />
Single dominant peak<br />
This is the most common result of speaker/room interaction.<br />
Apply the Width Selector as described in Figure 14. Align the<br />
center-line of the Selector over the center of the peak, as shown in<br />
Figure 15. Now adjust the Selector until you have achieved the “best<br />
fit.”The slider now points to the correct bandwidth setting. In this<br />
example, the frequency is 43Hz and the best-fit width is 12.5%. Fill<br />
in the Width and Frequency fields provided on the template.<br />
Determine the appropriate level using the technique described<br />
earlier. In this example, -9dB would be best. Enter the level in the<br />
field provided.<br />
Skip to the “Adjusting the R.A.B.O.S. Equalizer”<br />
section on page 18.<br />
INTERMEZZO <strong>1.2s</strong><br />
15