Historical Live Cattle/Feeder Cattle Report - gpvec
Historical Live Cattle/Feeder Cattle Report - gpvec
Historical Live Cattle/Feeder Cattle Report - gpvec

You also want an ePaper? Increase the reach of your titles
YUMPU automatically turns print PDFs into web optimized ePapers that Google loves.
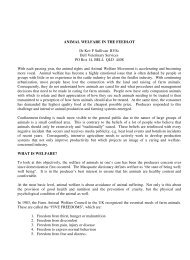
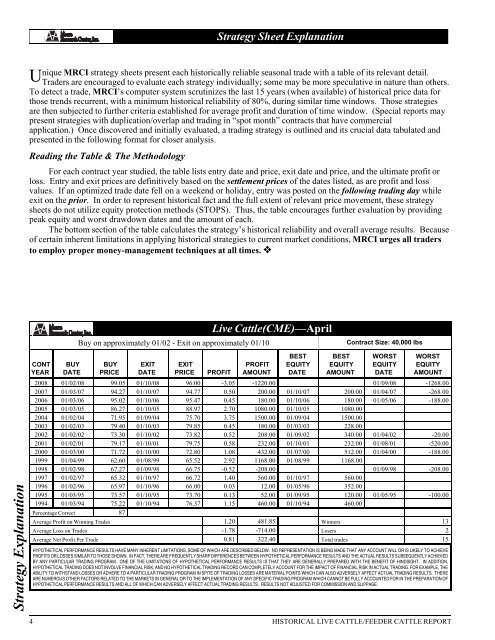
Strategy Explanation<br />
Buy on approximately 01/02 - Exit on approximately 01/10<br />
Strategy Sheet Explanation<br />
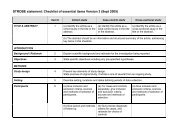
nique MRCI strategy sheets present each historically reliable seasonal trade with a table of its relevant detail.<br />
UTraders are encouraged to evaluate each strategy individually; some may be more speculative in nature than others.<br />
To detect a trade, MRCI’s computer system scrutinizes the last 15 years (when available) of historical price data for<br />
those trends recurrent, with a minimum historical reliability of 80%, during similar time windows. Those strategies<br />
are then subjected to further criteria established for average profit and duration of time window. (Special reports may<br />
present strategies with duplication/overlap and trading in “spot month” contracts that have commercial<br />
application.) Once discovered and initially evaluated, a trading strategy is outlined and its crucial data tabulated and<br />
presented in the following format for closer analysis.<br />
Reading the Table & The Methodology<br />
For each contract year studied, the table lists entry date and price, exit date and price, and the ultimate profit or<br />
loss. Entry and exit prices are definitively based on the settlement prices of the dates listed, as are profit and loss<br />
values. If an optimized trade date fell on a weekend or holiday, entry was posted on the following trading day while<br />
exit on the prior. In order to represent historical fact and the full extent of relevant price movement, these strategy<br />
sheets do not utilize equity protection methods (STOPS). Thus, the table encourages further evaluation by providing<br />
peak equity and worst drawdown dates and the amount of each.<br />
The bottom section of the table calculates the strategy’s historical reliability and overall average results. Because<br />
of certain inherent limitations in applying historical strategies to current market conditions, MRCI urges all traders<br />
to employ proper money-management techniques at all times. !<br />
CONT<br />
YEAR<br />
BUY<br />
DATE<br />
BUY<br />
PRICE<br />
EXIT<br />
DATE<br />
EXIT<br />
PRICE PROFIT<br />
<strong>Live</strong> <strong>Cattle</strong>(CME)—April<br />
PROFIT<br />
AMOUNT<br />
BEST<br />
EQUITY<br />
DATE<br />
BEST<br />
EQUITY<br />
AMOUNT<br />
Contract Size: 40,000 lbs<br />
WORST<br />
EQUITY<br />
DATE<br />
WORST<br />
EQUITY<br />
AMOUNT<br />
2008 01/02/08 99.05 01/10/08 96.00 -3.05 -1220.00 01/09/08 -1268.00<br />
2007 01/03/07 94.27 01/10/07 94.77 0.50 200.00 01/10/07 200.00 01/04/07 -268.00<br />
2006 01/03/06 95.02 01/10/06 95.47 0.45 180.00 01/10/06 180.00 01/05/06 -188.00<br />
2005 01/03/05 86.27 01/10/05 88.97 2.70 1080.00 01/10/05 1080.00<br />
2004 01/02/04 71.95 01/09/04 75.70 3.75 1500.00 01/09/04 1500.00<br />
2003 01/02/03 79.40 01/10/03 79.85 0.45 180.00 01/03/03 228.00<br />
2002 01/02/02 73.30 01/10/02 73.82 0.52 208.00 01/09/02 340.00 01/04/02 -20.00<br />
2001 01/02/01 79.17 01/10/01 79.75 0.58 232.00 01/10/01 232.00 01/08/01 -520.00<br />
2000 01/03/00 71.72 01/10/00 72.80 1.08 432.00 01/07/00 512.00 01/04/00 -188.00<br />
1999 01/04/99 62.60 01/08/99 65.52 2.92 1168.00 01/08/99 1168.00<br />
1998 01/02/98 67.27 01/09/98 66.75 -0.52 -208.00 01/09/98 -208.00<br />
1997 01/02/97 65.32 01/10/97 66.72 1.40 560.00 01/10/97 560.00<br />
1996 01/02/96 65.97 01/10/96 66.00 0.03 12.00 01/05/96 352.00<br />
1995 01/03/95 73.57 01/10/95 73.70 0.13 52.00 01/09/95 120.00 01/05/95 -100.00<br />
1994 01/03/94 75.22 01/10/94 76.37 1.15 460.00 01/10/94 460.00<br />
Percentage Correct 87<br />
Average Profit on Winning Trades 1.20 481.85 Winners 13<br />
Average Loss on Trades -1.78 -714.00 Losers 2<br />
Average Net Profit Per Trade 0.81 322.40 Total trades 15<br />
HYPOTHETICAL PERFORMANCE RESULTS HAVE MANY INHERENT LIMITATIONS, SOME OF WHICH ARE DESCRIBED BELOW. NO REPRESENTATION IS BEING MADE THAT ANY ACCOUNT WILL OR IS LIKELY TO ACHIEVE<br />
PROFITS OR LOSSES SIMILAR TO THOSE SHOWN. IN FACT, THERE ARE FREQUENTLY SHARP DIFFERENCES BETWEEN HYPOTHETICAL PERFORMANCE RESULTS AND THE ACTUAL RESULTS SUBSEQUENTLY ACHIEVED<br />
BY ANY PARTICULAR TRADING PROGRAM. ONE OF THE LIMITATIONS OF HYPOTHETICAL PERFORMANCE RESULTS IS THAT THEY ARE GENERALLY PREPARED WITH THE BENEFIT OF HINDSIGHT. IN ADDITION,<br />
HYPOTHETICAL TRADING DOES NOT INVOLVE FINANCIAL RISK, AND NO HYPOTHETICAL TRADING RECORD CAN COMPLETELY ACCOUNT FOR THE IMPACT OF FINANCIAL RISK IN ACTUAL TRADING. FOR EXAMPLE, THE<br />
ABILITY TO WITHSTAND LOSSES OR ADHERE TO A PARTICULAR TRADING PROGRAM IN SPITE OF TRADING LOSSES ARE MATERIAL POINTS WHICH CAN ALSO ADVERSELY AFFECT ACTUAL TRADING RESULTS. THERE<br />
ARE NUMEROUS OTHER FACTORS RELATED TO THE MARKETS IN GENERAL OR TO THE IMPLEMENTATION OF ANY SPECIFIC TRADING PROGRAM WHICH CANNOT BE FULLY ACCOUNTED FOR IN THE PREPARATION OF<br />
HYPOTHETICAL PERFORMANCE RESULTS AND ALL OF WHICH CAN ADVERSELY AFFECT ACTUAL TRADING RESULTS. RESULTS NOT ADJUSTED FOR COMMISSION AND SLIPPAGE.<br />
4 HISTORICAL LIVE CATTLE/FEEDER CATTLE REPORT