Names: Phosphate Data Sheet Nitrate Data Sheet Turbidity Data ...
Names: Phosphate Data Sheet Nitrate Data Sheet Turbidity Data ...
Names: Phosphate Data Sheet Nitrate Data Sheet Turbidity Data ...

You also want an ePaper? Increase the reach of your titles
YUMPU automatically turns print PDFs into web optimized ePapers that Google loves.
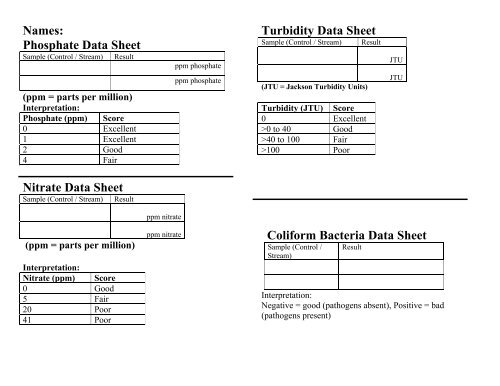
<strong>Names</strong>:<br />
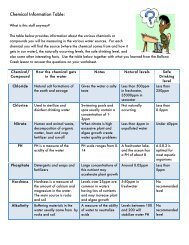
<strong>Phosphate</strong> <strong>Data</strong> <strong>Sheet</strong><br />
Sample (Control / Stream) Result<br />
(ppm = parts per million)<br />
Interpretation:<br />
<strong>Phosphate</strong> (ppm) Score<br />
0 Excellent<br />
1 Excellent<br />
2 Good<br />
4 Fair<br />
<strong>Nitrate</strong> <strong>Data</strong> <strong>Sheet</strong><br />
Sample (Control / Stream) Result<br />
(ppm = parts per million)<br />
Interpretation:<br />
<strong>Nitrate</strong> (ppm) Score<br />
0 Good<br />
5 Fair<br />
20 Poor<br />
41 Poor<br />
ppm nitrate<br />
ppm nitrate<br />
ppm phosphate<br />
ppm phosphate<br />
<strong>Turbidity</strong> <strong>Data</strong> <strong>Sheet</strong><br />
Sample (Control / Stream) Result<br />
(JTU = Jackson <strong>Turbidity</strong> Units)<br />
<strong>Turbidity</strong> (JTU) Score<br />
0 Excellent<br />
>0 to 40 Good<br />
>40 to 100 Fair<br />
>100 Poor<br />
JTU<br />
JTU<br />
Coliform Bacteria <strong>Data</strong> <strong>Sheet</strong><br />
Sample (Control /<br />
Stream)<br />
Result<br />
Interpretation:<br />
Negative = good (pathogens absent), Positive = bad<br />
(pathogens present)
pH <strong>Data</strong> <strong>Sheet</strong><br />
Sample (Control / Stream) Result<br />
pH =<br />
Interpretation:<br />
pH Score<br />
4 Poor<br />
5 Poor<br />
6 Good<br />
7 Excellent<br />
8 Good<br />
9 Poor<br />
10 Poor<br />
11 Poor<br />
pH =<br />
Benthic Macroinvertebrate <strong>Data</strong> <strong>Sheet</strong><br />
1.Count the number of specimens you have in each category (using the<br />
diagrams you have) and put the numbers in the table below. You may<br />
not have specimens in each category.<br />
2. Multiply the number of specimens by the point value for that<br />
category, and put the total in the final column.<br />
3. Add the right hand column nd put the total at the bottom.<br />
4. Use the interpretation key at bottom to determine the health of your<br />
watershed.<br />
Group 1: Very Sensitive<br />
to Pollution<br />
Group 2: Somewhat<br />
Sensitive to Pollution<br />
Group 3: Generally<br />
Tolerant to Pollution<br />
Total Points<br />
Number of<br />
Specimens<br />
Water Quality Index Interpretation<br />
> 22 Points: Very Healthy<br />
17-22: Good Health<br />
11-16: Fair Health<br />
Dissolved Oxygen <strong>Data</strong> <strong>Sheet</strong><br />
Step One: Find how much oxygen is in the water by<br />
doing the experiment.<br />
Sample (Control / Stream) Result<br />
(ppm = parts per million);<br />
ppm Dissolved Oxygen<br />
ppm Dissolved Oxygen<br />
Step Two: Return the test kit and get a thermometer.<br />
Find the temperature of the water.<br />
Sample (Control / Stream) Result<br />
Step Three: Find the % Saturation of your water<br />
samples using the dissolved oxygen and temperature and<br />
the table on this page. The higher the saturation, the<br />
more oxygen is in the water.<br />
°C<br />
°C<br />
⁰Celsius<br />
Temp<br />
Interpretation: compare Percent (%) saturation:<br />
Dissolved Oxygen<br />
0 4 8<br />
0 4 8<br />
ppm ppm ppm ppm ppm ppm<br />
4 0 31 61 18 0 42 84<br />
6 0 <br />
8 0 <br />
10 0 <br />
12 0 <br />
14 0 <br />
16 0 <br />
32<br />
34<br />
35<br />
37<br />
39<br />
41<br />
64<br />
68<br />
71<br />
74<br />
78<br />
71<br />
20 0 <br />
22 0 <br />
24 0 <br />
26 0 <br />
28 0 <br />
30 0 <br />
44<br />
46<br />
48<br />
49<br />
51<br />
53<br />
88<br />
92<br />
95<br />
99<br />
102<br />
106<br />
Temp ⁰Celsius<br />
Example: at 22⁰C, if your DO result is 4 ppm, the % saturation is<br />
46.<br />
Final result: Percent Saturation<br />
Sample (Control / Stream) Result<br />
Dissolved Oxygen<br />
Dissolved Oxygen