Chemical Information Table:
Chemical Information Table:
Chemical Information Table:

You also want an ePaper? Increase the reach of your titles
YUMPU automatically turns print PDFs into web optimized ePapers that Google loves.
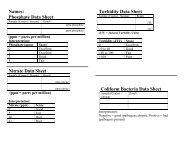
<strong>Chemical</strong> <strong>Information</strong> <strong>Table</strong>:<br />
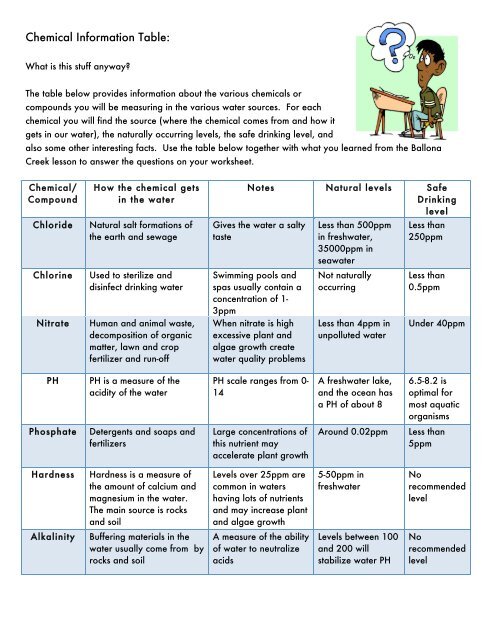
What is this stuff anyway?<br />
The table below provides information about the various chemicals or<br />
compounds you will be measuring in the various water sources. For each<br />
chemical you will find the source (where the chemical comes from and how it<br />
gets in our water), the naturally occurring levels, the safe drinking level, and<br />
also some other interesting facts. Use the table below together with what you learned from the Ballona<br />
Creek lesson to answer the questions on your worksheet.<br />
<strong>Chemical</strong>/<br />
Compound<br />
How the chemical gets<br />
in the water<br />
Chloride Natural salt formations of<br />
the earth and sewage<br />
Chlorine Used to sterilize and<br />
disinfect drinking water<br />
Nitrate Human and animal waste,<br />
decomposition of organic<br />
matter, lawn and crop<br />
fertilizer and run-off<br />
PH PH is a measure of the<br />
acidity of the water<br />
Phosphate Detergents and soaps and<br />
fertilizers<br />
Hardness Hardness is a measure of<br />
the amount of calcium and<br />
magnesium in the water.<br />
The main source is rocks<br />
and soil<br />
Alkalinity Buffering materials in the<br />
water usually come from by<br />
rocks and soil<br />
Notes Natural levels Safe<br />
Drinking<br />
level<br />
Gives the water a salty<br />
taste<br />
Swimming pools and<br />
spas usually contain a<br />
concentration of 1-<br />
3ppm<br />
When nitrate is high<br />
excessive plant and<br />
algae growth create<br />
water quality problems<br />
PH scale ranges from 0-<br />
14<br />
Large concentrations of<br />
this nutrient may<br />
accelerate plant growth<br />
Levels over 25ppm are<br />
common in waters<br />
having lots of nutrients<br />
and may increase plant<br />
and algae growth<br />
A measure of the ability<br />
of water to neutralize<br />
acids<br />
Less than 500ppm<br />
in freshwater,<br />
35000ppm in<br />
seawater<br />
Not naturally<br />
occurring<br />
Less than 4ppm in<br />
unpolluted water<br />
A freshwater lake,<br />
and the ocean has<br />
a PH of about 8<br />
Less than<br />
250ppm<br />
Less than<br />
0.5ppm<br />
Under 40ppm<br />
6.5-8.2 is<br />
optimal for<br />
most aquatic<br />
organisms<br />
Around 0.02ppm Less than<br />
5ppm<br />
5-50ppm in<br />
freshwater<br />
Levels between 100<br />
and 200 will<br />
stabilize water PH<br />
No<br />
recommended<br />
level<br />
No<br />
recommended<br />
level
Iron Soil and rocks provide a<br />
natural source, but<br />
industrial waste can<br />
contribute to elevated levels<br />
Levels over 0.3ppm<br />
may turn the water a<br />
reddish brown color<br />
0.1 – 10ppm Less than<br />
0.2ppm<br />
What’s in the water? Name:__________________________________<br />
Period:________<br />
Fill in your “what‘s in the water table” with the information collected by your classmates. Use the chemical<br />
information handout and the knowledge you gained from the watershed presentation to answer the following<br />
questions.<br />
Reflecting on your own measurements:<br />
Which two chemicals did you group measure? _______________________ , ________________________<br />
Which four water treatments did your group measure? __________________________,<br />
______________________, ____________________, _________________________<br />
Was the water testing activity easy or hard for you? Why?<br />
_______________________________________________________________________________________<br />
_______________________________________________________________________________________<br />
_______________________________________________________________________________________<br />
___________________________________________________________________________<br />
Reflecting on the class measurements:<br />
Which water do you think was the most polluted? ___________________________________<br />
Which chemical/s did this water contain?<br />
_________________________________________________________________________<br />
How do you think these chemicals might affect the environment or plants and animals?<br />
__________________________________________________________________________<br />
__________________________________________________________________________<br />
____________________________________________
_______________________________________________________________________________________<br />
_______________________________________________________________________________________<br />
__________________<br />
Did any of the waters measured by your class contain chemicals that were above the safe drinking level? If<br />
so state which ones.<br />
_______________________________________________________________________________________<br />
____________<br />
Below is a list of all the chemicals you tested. Circle all the ones you think would increase plant and algae<br />
growth.<br />
chloride chlorine nitrate phosphate Iron<br />
How do you think the chemicals circled about might get into the water?<br />
_______________________________________________________________________________________<br />
_______________________________________________________________________________________<br />
_______________________________________________________________________________________<br />
___________________________________________________________________________<br />
Reflecting on the presentation:<br />
What do you think you could do to reduce the amount of water you consume each day?<br />
_______________________________________________________________________________________<br />
_______________________________________________________________________________________<br />
_______________________________________________________________________________________<br />
___________________________________________________________________________<br />
_______________________________________________________________________________________<br />
_________________________<br />
How might the city of LA reduce the amount of pollution and trash entering our local streams and rivers?<br />
_______________________________________________________________________________________<br />
_______________________________________________________________________________________<br />
_______________________________________________________________________________________<br />
_______________________________________________________________________________________<br />
_______________________________________________________________________________________<br />
_____________<br />
How Does Water Quality Impact Living Things?<br />
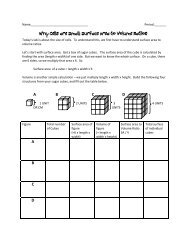
Today you and your group will be setting up and experiment to answer the following question:<br />
How does water quality effect the germination and growth of pea seeds?
Follow the instructions below to set up the pea seed germination experiment. Your group will use<br />
filtered water as a control, and also choose three other water sources to test from the 8 tested last<br />
week.<br />
Write your treatment choices below:<br />
Control : ___Filtered water_____<br />
Water 1: ______________________<br />
Water 2: ______________________<br />
Water 3: ______________________<br />
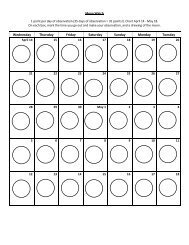
At the end of the experiment you will measure and<br />
record the following data:<br />
- The number of seeds that germinate<br />
- The average height of each shoot<br />
- The number of leaves on each plant<br />
- The number of surviving pea plants<br />
Together with your group make a hypothesis regarding how you think the three water sources you<br />
choose might affect the growth and germination of the pea plants. Remember to be specific. Write<br />
your hypothesis below:<br />
________________________________________________________________________________<br />
________________________________________________________________________________<br />
________________________________________________________________________________<br />
_____________________________________________________________________<br />
Experiment set up Instructions:<br />
For each water treatment you will do the following:<br />
1. Get a strip of tape that is twice as long as the<br />
sandwich bag.<br />
2. Place 6 pea seeds along the center of the<br />
tape, equally spaced.<br />
3. Fold a piece of paper towel in half twice and<br />
tape you pea seeds to the center of the<br />
paper towel.<br />
4. Place the paper towel in the sandwich bag.<br />
5. Add 25ml of your treatment water to the bag.<br />
6. Label the bag with you period, group number and water treatment.
7. Use the provided sharpie to mark the location of each seed for future reference.<br />
8. Ask myself or Mrs. Peters to assist you in hanging your plastic bag on the wall.<br />
Experiment Data Collection:<br />
Name:_____________________________________<br />
Period:_______<br />
Today you and your group members will be collecting data from your<br />
experimental pea seeds in order to answer the experimental question:<br />
How does water quality effect the germination and growth of pea<br />
seeds?<br />
In order to measure growth of your pea plants you<br />
will be collecting 4 pieces of information,<br />
germination, shoot growth, number of leaves and survival.<br />
Water<br />
Source<br />
Filtered<br />
Number of<br />
seeds that<br />
germinated<br />
Shoot Height (measure to the nearest 1 mm):<br />
Water<br />
Source<br />
Filtered<br />
Seed<br />
1<br />
Seed<br />
2<br />
Number of<br />
germinated<br />
plants<br />
surviving<br />
Seed<br />
3<br />
Seed<br />
4<br />
Count the number of leaves you find growing on each plant:<br />
Seed<br />
5<br />
Seed<br />
6<br />
Sum Average
Water<br />
Source<br />
Filtered<br />
Seed<br />
1<br />
Seed<br />
2<br />
Seed<br />
3<br />
Seed<br />
4<br />
Seed<br />
5<br />
Seed<br />
6<br />
Sum average<br />
Name:____________________________________<br />
Period:___________<br />
Interpreting Results and Drawing Conclusions:<br />
Thinking about our method of data collection...<br />
1. Was any of the data you collected on this experiment difficult for you to<br />
determine or measure? If so state why.<br />
_________________________________________________________________<br />
_________________________________________________________________<br />
________________________________________<br />
_________________________________________________________________<br />
_________________________________________________________________<br />
________________________________________<br />
2. Is there any data that we didn’t collect during this experiment that we could have<br />
used to help us figure out which water treatment was the best?<br />
___________________________________________________________________________<br />
__________<br />
___________________________________________________________________________<br />
___________________________________________________________________________<br />
____________________<br />
Using your Experiment Data Collection <strong>Table</strong>s answer the following questions:<br />
1. Which water treatment(s) resulted in the most germinated seeds?<br />
________________________________<br />
2. Which water treatment(s) had the highest<br />
survival?_____________________________________________<br />
3. In which water treatment did the pea seeds grow the tallest on<br />
average?_________________________<br />
4. In which water treatment did the pea seeds have the most<br />
leaves?_______________________________
You collected four types of data about your pea seeds: germination, survival, average growth, and<br />
average number of leaves. Choose one of these four and create a bar graph to show your results.<br />
Do not forget to label your axes!<br />
Chart Title:_________________________________________________________________<br />
water 1 water 2 water 3 water 4<br />
Thinking back to our original experimental question (How does water quality effect the growth of<br />
pea seeds)….<br />
1. Did any of the water treatments from your experiment have a positive effect (better than the<br />
filtered water control) on the pea seeds? If so state which ones.<br />
___________________________________________________________________________<br />
_____________________<br />
2. For the waters listed above, what chemicals or other aspects of the water do you think may<br />
have caused the patterns you observed?<br />
___________________________________________________________________________<br />
___________________________________________________________________________<br />
___________________________________________________________________________<br />
___________________________________________________________________________<br />
___________________________________________________________________________<br />
___________________________________________________________________________<br />
___________________________________
3. Did any of the water treatments from your experiment have a negative effect (worse than the<br />
filtered water control) on the pea seeds? If so state which ones.<br />
___________________________________________________________________________<br />
______________________<br />
4. For the waters listed above, what chemicals or other aspects of the water do you think may<br />
have caused the patterns you observed?<br />
___________________________________________________________________________<br />
___________________________________________________________________________<br />
___________________________________________________________________________<br />
___________________________________________________________________________<br />
___________________________________________________________________________<br />
___________________________________________________________________________<br />
___________________________________<br />
Often times, in science, we find that the answers only lead us to more<br />
questions and those questions bring forth new ideas which can then be<br />
tested experimentally.<br />
Considering what you have leaned and observed over the past few<br />
weeks write down two questions you have about water quality, water<br />
pollution and/or its effects on the environment that could be tested with<br />
additional experiments.<br />
1. __________________________________<br />
__________________________________<br />
__________________________________<br />
__________________________________<br />
__________________________________<br />
__________________________________<br />
________________<br />
2. __________________________________<br />
__________________________________<br />
__________________________________<br />
__________________________________<br />
__________________________________<br />
__________________________________<br />
________________