FINANCIAL AND OPERATIONAL HIGHLIGHTS - Alibaba
FINANCIAL AND OPERATIONAL HIGHLIGHTS - Alibaba
FINANCIAL AND OPERATIONAL HIGHLIGHTS - Alibaba

Create successful ePaper yourself
Turn your PDF publications into a flip-book with our unique Google optimized e-Paper software.
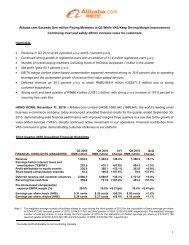
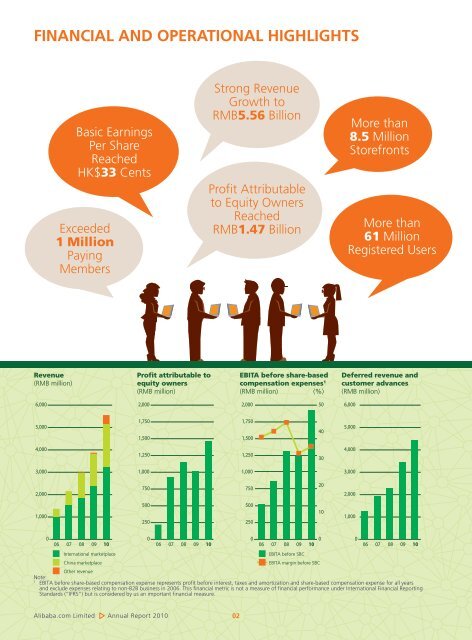
<strong>FINANCIAL</strong> <strong>AND</strong> <strong>OPERATIONAL</strong> <strong>HIGHLIGHTS</strong><br />
Revenue<br />
(RMB million)<br />
6,000<br />
5,000<br />
4,000<br />
3,000<br />
2,000<br />
1,000<br />
Basic Earnings<br />
Per Share<br />
Reached<br />
HK$33 Cents<br />
Exceeded<br />
1 Million<br />
Paying<br />
Members<br />
<strong>Alibaba</strong>.com Limited Annual Report 2010<br />
Profit attributable to<br />
equity owners<br />
(RMB million)<br />
2,000<br />
1,750<br />
1,500<br />
1,250<br />
1,000<br />
750<br />
500<br />
250<br />
Strong Revenue<br />
Growth to<br />
RMB5.56 Billion<br />
Profit Attributable<br />
to Equity Owners<br />
Reached<br />
RMB1.47 Billion<br />
02<br />
EBITA before share-based<br />
compensation expenses 1<br />
(RMB million) (%)<br />
2,000<br />
1,750<br />
1,500<br />
1,250<br />
1,000<br />
750<br />
500<br />
250<br />
More than<br />
8.5 Million<br />
Storefronts<br />
More than<br />
61 Million<br />
Registered Users<br />
Deferred revenue and<br />
customer advances<br />
(RMB million)<br />
0<br />
0<br />
0<br />
0<br />
0<br />
06 07 08 09 10<br />
06 07 08 09 10<br />
06 07 08 09 10<br />
06 07 08 09 10<br />
International marketplace<br />
EBITA before SBC<br />
China marketplace<br />
Other revenue<br />
EBITA margin before SBC<br />
Note:<br />
1 EBITA before share-based compensation expense represents profit before interest, taxes and amortization and share-based compensation expense for all years<br />
and exclude expenses relating to non-B2B business in 2006. This financial metric is not a measure of financial performance under International Financial Reporting<br />
Standards (“IFRS”) but is considered by us an important financial measure.<br />
50<br />
40<br />
30<br />
20<br />
10<br />
6,000<br />
5,000<br />
4,000<br />
3,000<br />
2,000<br />
1,000
<strong>FINANCIAL</strong> <strong>HIGHLIGHTS</strong><br />
Total registered users<br />
(’000)<br />
Total paying members 2<br />
(’000)<br />
03<br />
Total storefronts<br />
(’000)<br />
2009 2010 Change<br />
RMB million RMB million<br />
Revenue 3,874.7 5,557.6 +43%<br />
Profit attributable to equity owners 1,013.0 1,469.5 +45%<br />
Earnings before interest, taxes and amortization (“EBITA”) 1,043.1 1,587.3 +52%<br />
Share-based compensation expense 200.4 341.0 +70%<br />
Deferred revenue and customer advances 3,437.0 4,434.4 +29%<br />
Recurring free cash flow 1,816.2 2,840.8 +56%<br />
EBITA margin (before share-based compensation expense) (%) 32.1% 34.7% +2.6%pts<br />
Earnings per share, basic and diluted (HK$) 23 cents 33 cents +44%<br />
<strong>OPERATIONAL</strong> <strong>HIGHLIGHTS</strong><br />
2009 2010 Change<br />
Registered users 47,732,916 61,801,281 +30%<br />
International marketplace 11,578,247 18,024,993 +56%<br />
China marketplace 36,154,669 43,776,288 +21%<br />
Storefronts 6,819,984 8,544,544 +25%<br />
International marketplace 1,400,326 1,696,905 +21%<br />
China marketplace 5,419,658 6,847,639 +26%<br />
Paying members 2 615,212 809,362 +32%<br />
China Gold Supplier 96,110 121,274 +26%<br />
Global Gold Supplier 17,786 10,434 –41%<br />
China TrustPass 501,316 677,654 +35%<br />
70,000<br />
60,000<br />
50,000<br />
40,000<br />
30,000<br />
20,000<br />
10,000<br />
0<br />
06<br />
07<br />
08<br />
09<br />
10<br />
International marketplace<br />
China marketplace<br />
900<br />
800<br />
700<br />
600<br />
500<br />
400<br />
300<br />
200<br />
100<br />
0<br />
06 07 08 09 10<br />
International marketplace<br />
China marketplace<br />
9,000<br />
8,000<br />
7,000<br />
6,000<br />
5,000<br />
4,000<br />
3,000<br />
2,000<br />
1,000<br />
0<br />
06 07 08 09 10<br />
International marketplace<br />
China marketplace<br />
Recurring free cash flow 3<br />
(RMB million)<br />
2 Paying members include members on our international and China marketplaces only. If including paying members for HiChina, the total paying members exceeded<br />
1 million.<br />
3 Recurring free cash flow represents net cash flow generated from operating activities as presented in our consolidated cash flow statements less purchase of<br />
property and equipment, and exclude non-recurring receipts or payments. This financial metric is not a measure of financial performance under IFRS but is<br />
considered by us an important financial measure.<br />
3,000<br />
2,500<br />
2,000<br />
1,500<br />
1,000<br />
500<br />
0<br />
06<br />
<strong>Alibaba</strong>.com Limited Annual Report 2010<br />
07<br />
08<br />
09<br />
10