A Novel Defect Inspection Method for the TFT-LCD Image Based on ...
A Novel Defect Inspection Method for the TFT-LCD Image Based on ...
A Novel Defect Inspection Method for the TFT-LCD Image Based on ...

You also want an ePaper? Increase the reach of your titles
YUMPU automatically turns print PDFs into web optimized ePapers that Google loves.
A <str<strong>on</strong>g>Novel</str<strong>on</strong>g> <str<strong>on</strong>g>Defect</str<strong>on</strong>g> <str<strong>on</strong>g>Inspecti<strong>on</strong></str<strong>on</strong>g> <str<strong>on</strong>g>Method</str<strong>on</strong>g> <str<strong>on</strong>g>for</str<strong>on</strong>g> <str<strong>on</strong>g>the</str<strong>on</strong>g> <str<strong>on</strong>g>TFT</str<strong>on</strong>g>-<str<strong>on</strong>g>LCD</str<strong>on</strong>g><br />
<str<strong>on</strong>g>Image</str<strong>on</strong>g> <str<strong>on</strong>g>Based</str<strong>on</strong>g> <strong>on</strong> Human Visual System<br />
Tae-Eun S<strong>on</strong>g 1 , Se-Yun Kim 2 , J<strong>on</strong>g-Hwan Kim 3 , and Kil-Houm Park 4<br />
1 Department Name, University Name, City, State, Country<br />
2 Department Name, Company / Instituti<strong>on</strong> Name, City, State, Country<br />
Abstract - The <str<strong>on</strong>g>TFT</str<strong>on</strong>g>-<str<strong>on</strong>g>LCD</str<strong>on</strong>g> image has n<strong>on</strong>-uni<str<strong>on</strong>g>for</str<strong>on</strong>g>m<br />
brightness that is <str<strong>on</strong>g>the</str<strong>on</strong>g> major difficulty of finding <str<strong>on</strong>g>the</str<strong>on</strong>g> defect<br />
regi<strong>on</strong> called Mura. In order to facilitate Mura detecti<strong>on</strong>,<br />
globally large-varying background signal has to be leveled<br />
and also Mura signal has to be enlarged. In this paper,<br />
Mura signal magnificati<strong>on</strong> and background signal<br />
flattening methods by <str<strong>on</strong>g>the</str<strong>on</strong>g> use of adapted c<strong>on</strong>trast sensitivity<br />
functi<strong>on</strong>(ACSF) in DCT domain and polynomial<br />
regressi<strong>on</strong>(PR) are proposed. In <str<strong>on</strong>g>the</str<strong>on</strong>g> enhanced image, Trimodal<br />
thresholding segmentati<strong>on</strong> technique is used <str<strong>on</strong>g>for</str<strong>on</strong>g><br />
finding both Dark and White Mura at <strong>on</strong>ce. To leave out<br />
reliable defect, false regi<strong>on</strong> eliminati<strong>on</strong> algorithms based<br />
<strong>on</strong> HVS (Human Visual System) are also proposed. The<br />
experimental results prove that <str<strong>on</strong>g>the</str<strong>on</strong>g> proposed algorithm is<br />
novel enhancement method and it can be applicable to real<br />
automated inspecti<strong>on</strong> system.<br />
Keywords: <str<strong>on</strong>g>TFT</str<strong>on</strong>g>-<str<strong>on</strong>g>LCD</str<strong>on</strong>g> (Thin Film Transistor-Liquid Crystal<br />
Display), Polynomial Regressi<strong>on</strong>, Discrete Cosine<br />
Trans<str<strong>on</strong>g>for</str<strong>on</strong>g>m, Human Visual System, C<strong>on</strong>trast Sensitivity<br />
Functi<strong>on</strong>.<br />
1 Introducti<strong>on</strong><br />
Recently, <str<strong>on</strong>g>the</str<strong>on</strong>g> thin film transistor liquid crystal displays<br />
(<str<strong>on</strong>g>TFT</str<strong>on</strong>g>-<str<strong>on</strong>g>LCD</str<strong>on</strong>g>s) has become <str<strong>on</strong>g>the</str<strong>on</strong>g> major flat panel displays<br />
(FPDs) <str<strong>on</strong>g>for</str<strong>on</strong>g> <str<strong>on</strong>g>the</str<strong>on</strong>g>ir volume and versatile usage [1]. The more<br />
<str<strong>on</strong>g>the</str<strong>on</strong>g> <str<strong>on</strong>g>TFT</str<strong>on</strong>g>-<str<strong>on</strong>g>LCD</str<strong>on</strong>g> market grows <str<strong>on</strong>g>the</str<strong>on</strong>g> more need <str<strong>on</strong>g>for</str<strong>on</strong>g> automated<br />
inspecti<strong>on</strong> systems exist. However most of <str<strong>on</strong>g>the</str<strong>on</strong>g> final<br />
inspecti<strong>on</strong>s of <str<strong>on</strong>g>LCD</str<strong>on</strong>g> panels have been d<strong>on</strong>e by human<br />
observers. Human visi<strong>on</strong>-based inspecti<strong>on</strong> [2] systems have<br />
some disadvantages that each observer tends to have<br />
subjective defect decisi<strong>on</strong> levels which can vary according<br />
to time and physical c<strong>on</strong>diti<strong>on</strong>s. There<str<strong>on</strong>g>for</str<strong>on</strong>g>e, in order to<br />
increase <str<strong>on</strong>g>the</str<strong>on</strong>g> productivity and reliability of products<br />
automated inspecti<strong>on</strong> systems are highly required.<br />
The <str<strong>on</strong>g>TFT</str<strong>on</strong>g>-<str<strong>on</strong>g>LCD</str<strong>on</strong>g> panel images have n<strong>on</strong>-uni<str<strong>on</strong>g>for</str<strong>on</strong>g>m illuminati<strong>on</strong><br />
variati<strong>on</strong>s due to imperfecti<strong>on</strong> of light source and unequal<br />
liquid crystal distributi<strong>on</strong> and so <strong>on</strong>. The <str<strong>on</strong>g>TFT</str<strong>on</strong>g>-<str<strong>on</strong>g>LCD</str<strong>on</strong>g> panels<br />
do not have a light source, <str<strong>on</strong>g>the</str<strong>on</strong>g>y need an external light source<br />
called back light unit (BLU). Despite every ef<str<strong>on</strong>g>for</str<strong>on</strong>g>t to make<br />
BLU as an ideal plane light source, BLU still allow<br />
illuminati<strong>on</strong> variati<strong>on</strong>s measured by luminance uni<str<strong>on</strong>g>for</str<strong>on</strong>g>mity<br />
(LU) as more than 80% [3]. The LU is expressed by <str<strong>on</strong>g>the</str<strong>on</strong>g><br />
following equati<strong>on</strong>:<br />
Luminance<br />
L min<br />
Uni<str<strong>on</strong>g>for</str<strong>on</strong>g>mity (LU) 100<br />
(1)<br />
L<br />
where L and max L are <str<strong>on</strong>g>the</str<strong>on</strong>g> maximum and minimum<br />
min<br />
luminance values under <str<strong>on</strong>g>the</str<strong>on</strong>g> predefined positi<strong>on</strong>s of a <str<strong>on</strong>g>TFT</str<strong>on</strong>g>-<br />
<str<strong>on</strong>g>LCD</str<strong>on</strong>g> panel.<br />
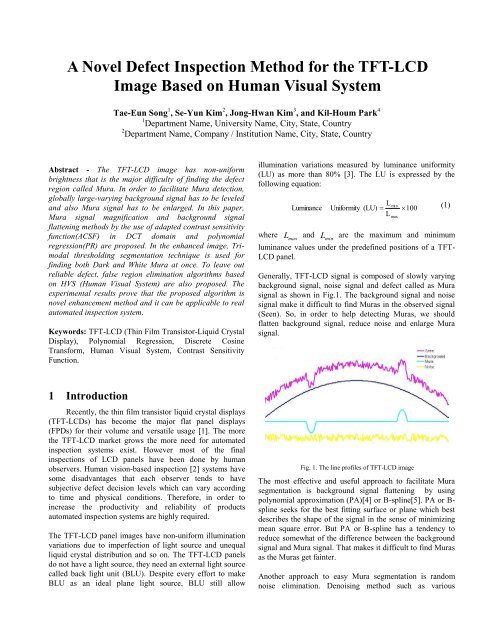
Generally, <str<strong>on</strong>g>TFT</str<strong>on</strong>g>-<str<strong>on</strong>g>LCD</str<strong>on</strong>g> signal is composed of slowly varying<br />
background signal, noise signal and defect called as Mura<br />
signal as shown in Fig.1. The background signal and noise<br />
signal make it difficult to find Muras in <str<strong>on</strong>g>the</str<strong>on</strong>g> observed signal<br />
(Seen). So, in order to help detecting Muras, we should<br />
flatten background signal, reduce noise and enlarge Mura<br />
signal.<br />
max<br />
Fig. 1. The line profiles of <str<strong>on</strong>g>TFT</str<strong>on</strong>g>-<str<strong>on</strong>g>LCD</str<strong>on</strong>g> image<br />
The most effective and useful approach to facilitate Mura<br />
segmentati<strong>on</strong> is background signal flattening by using<br />
polynomial approximati<strong>on</strong> (PA)[4] or B-spline[5]. PA or Bspline<br />
seeks <str<strong>on</strong>g>for</str<strong>on</strong>g> <str<strong>on</strong>g>the</str<strong>on</strong>g> best fitting surface or plane which best<br />
describes <str<strong>on</strong>g>the</str<strong>on</strong>g> shape of <str<strong>on</strong>g>the</str<strong>on</strong>g> signal in <str<strong>on</strong>g>the</str<strong>on</strong>g> sense of minimizing<br />
mean square error. But PA or B-spline has a tendency to<br />
reduce somewhat of <str<strong>on</strong>g>the</str<strong>on</strong>g> difference between <str<strong>on</strong>g>the</str<strong>on</strong>g> background<br />
signal and Mura signal. That makes it difficult to find Muras<br />
as <str<strong>on</strong>g>the</str<strong>on</strong>g> Muras get fainter.<br />
Ano<str<strong>on</strong>g>the</str<strong>on</strong>g>r approach to easy Mura segmentati<strong>on</strong> is random<br />
noise eliminati<strong>on</strong>. Denoising method such as various
Wavelet Trans<str<strong>on</strong>g>for</str<strong>on</strong>g>m domain research has <str<strong>on</strong>g>the</str<strong>on</strong>g> best results in<br />
case of precise noise modeling [6][7]. There is a problem in<br />
<str<strong>on</strong>g>the</str<strong>on</strong>g> random noise modeling because <str<strong>on</strong>g>the</str<strong>on</strong>g> random noise is<br />
expressed by camera noise, camera distorti<strong>on</strong> and random<br />
noise, etc.<br />
And <str<strong>on</strong>g>the</str<strong>on</strong>g> o<str<strong>on</strong>g>the</str<strong>on</strong>g>r method to help Mura segmentati<strong>on</strong> is <str<strong>on</strong>g>the</str<strong>on</strong>g><br />
enlargement of Mura signal. If <str<strong>on</strong>g>the</str<strong>on</strong>g> frequency band of Mura<br />
signal could be found exactly, we could emphasize it by<br />
magnifying this band. Generally, because <str<strong>on</strong>g>the</str<strong>on</strong>g> signal affects<br />
all frequency spectrums, finding precise cut-off frequency of<br />
<str<strong>on</strong>g>the</str<strong>on</strong>g> Mura signal is impossible. But from <str<strong>on</strong>g>the</str<strong>on</strong>g> human visual<br />
system point of view, we can emphasize more visible<br />
frequency given by <str<strong>on</strong>g>the</str<strong>on</strong>g> CSF experiment [8-10]. One of<br />
major HVS characteristics is that <str<strong>on</strong>g>the</str<strong>on</strong>g> HVS has different<br />
frequency sensitivity. Adapted CSF is proposed to visualize<br />
more salient object such as Muras.<br />
In this paper, <str<strong>on</strong>g>the</str<strong>on</strong>g> <str<strong>on</strong>g>TFT</str<strong>on</strong>g>-<str<strong>on</strong>g>LCD</str<strong>on</strong>g> image defect detecti<strong>on</strong><br />
algorithm based <strong>on</strong> HVS is proposed. The PR is used <str<strong>on</strong>g>for</str<strong>on</strong>g><br />
background signal flattening while <str<strong>on</strong>g>the</str<strong>on</strong>g> proposed ACSF are<br />
used to enlarge Mura signal. Then tri-modal thresholding,<br />
which determines defect candidate as out of mean value, is<br />
employed <str<strong>on</strong>g>for</str<strong>on</strong>g> Mura segmentati<strong>on</strong>. Finally, false positive<br />
defects are eliminated based <strong>on</strong> HVS.<br />
2 The Characteristics of <str<strong>on</strong>g>TFT</str<strong>on</strong>g>-<str<strong>on</strong>g>LCD</str<strong>on</strong>g> <str<strong>on</strong>g>Image</str<strong>on</strong>g><br />
Inherently <str<strong>on</strong>g>TFT</str<strong>on</strong>g>-<str<strong>on</strong>g>LCD</str<strong>on</strong>g> panel is n<strong>on</strong>-light emitting<br />
display devices, thus <str<strong>on</strong>g>the</str<strong>on</strong>g>y need an external light source<br />
called BLU. There have been many ef<str<strong>on</strong>g>for</str<strong>on</strong>g>ts to make BLU as<br />
ideal plane light sources so that <str<strong>on</strong>g>the</str<strong>on</strong>g> illuminati<strong>on</strong> from <str<strong>on</strong>g>the</str<strong>on</strong>g><br />
fr<strong>on</strong>tal panel can be uni<str<strong>on</strong>g>for</str<strong>on</strong>g>m [7]. Because <str<strong>on</strong>g>the</str<strong>on</strong>g> BLU is placed<br />
at <str<strong>on</strong>g>the</str<strong>on</strong>g> panel border, <str<strong>on</strong>g>the</str<strong>on</strong>g> light from <str<strong>on</strong>g>the</str<strong>on</strong>g> source would decrease<br />
according to <str<strong>on</strong>g>the</str<strong>on</strong>g> distance. To make <str<strong>on</strong>g>the</str<strong>on</strong>g> light more uni<str<strong>on</strong>g>for</str<strong>on</strong>g>mly<br />
distributed several additi<strong>on</strong>al sheets such as diffuser sheet,<br />
horiz<strong>on</strong>tal and vertical prism sheets are required. Through<br />
<str<strong>on</strong>g>the</str<strong>on</strong>g>se sheets a light can be diffused and be c<strong>on</strong>centrated.<br />
Examples of a BLU structure and highlighted n<strong>on</strong>-uni<str<strong>on</strong>g>for</str<strong>on</strong>g>m<br />
light transmissi<strong>on</strong> from <str<strong>on</strong>g>the</str<strong>on</strong>g> source are shown in Fig. 2.<br />
(a)<br />
Gray Level<br />
(b)<br />
Fig. 2. The structure of a BLU and light transmissi<strong>on</strong> from <str<strong>on</strong>g>the</str<strong>on</strong>g> light source<br />
(a) The BLU structure (b) light emitting from a light source.<br />
(a)<br />
(b)<br />
Line Profiles<br />
200 Line<br />
183 Line<br />
190<br />
180<br />
170<br />
160<br />
150<br />
140<br />
130<br />
120<br />
110<br />
100<br />
90<br />
0 50 100 150 200 250<br />
Positi<strong>on</strong><br />
(c)<br />
Fig.3. Sample <str<strong>on</strong>g>TFT</str<strong>on</strong>g>-<str<strong>on</strong>g>LCD</str<strong>on</strong>g> image with Mura defects and its characteristics.<br />
(a) The <str<strong>on</strong>g>TFT</str<strong>on</strong>g>-<str<strong>on</strong>g>LCD</str<strong>on</strong>g> image with Mura defects, (b) signal generated <str<strong>on</strong>g>TFT</str<strong>on</strong>g>-<str<strong>on</strong>g>LCD</str<strong>on</strong>g><br />
image having Muras of various size and strength and (c) line profiles of<br />
dotted circle and arrow.
The light is diffused and c<strong>on</strong>centrated through <str<strong>on</strong>g>the</str<strong>on</strong>g>se sheets.<br />
But <str<strong>on</strong>g>the</str<strong>on</strong>g>re still exist some illuminati<strong>on</strong> variati<strong>on</strong>s measured<br />
by LU of more than 80%. Above 80% LU is c<strong>on</strong>sidered<br />
acceptable in industry. The luminance values <str<strong>on</strong>g>for</str<strong>on</strong>g> calculating<br />
<str<strong>on</strong>g>the</str<strong>on</strong>g> LU are acquired from <str<strong>on</strong>g>the</str<strong>on</strong>g> predetermined positi<strong>on</strong>s.<br />
Mura defects are darker or brighter than <str<strong>on</strong>g>the</str<strong>on</strong>g>ir neighboring<br />
normal regi<strong>on</strong>s in <str<strong>on</strong>g>TFT</str<strong>on</strong>g>-<str<strong>on</strong>g>LCD</str<strong>on</strong>g> images. They have various<br />
shapes and strengths according to <str<strong>on</strong>g>the</str<strong>on</strong>g> cause of generati<strong>on</strong>.<br />
Some of <str<strong>on</strong>g>the</str<strong>on</strong>g>m occur when unexpected <str<strong>on</strong>g>for</str<strong>on</strong>g>eign materials are<br />
inserted into <str<strong>on</strong>g>the</str<strong>on</strong>g> layers in a display panel and <str<strong>on</strong>g>the</str<strong>on</strong>g>y can be<br />
generated due to n<strong>on</strong>-uni<str<strong>on</strong>g>for</str<strong>on</strong>g>m liquid crystal distributi<strong>on</strong>, air<br />
inserti<strong>on</strong>, and partial press by external <str<strong>on</strong>g>for</str<strong>on</strong>g>ces, etc [8].<br />
Because of <str<strong>on</strong>g>the</str<strong>on</strong>g> n<strong>on</strong>-uni<str<strong>on</strong>g>for</str<strong>on</strong>g>m illuminati<strong>on</strong> characteristic of <str<strong>on</strong>g>the</str<strong>on</strong>g><br />
background signal, dark Mura can be brighter than <str<strong>on</strong>g>the</str<strong>on</strong>g><br />
normal background regi<strong>on</strong>. Two of our experimental <str<strong>on</strong>g>TFT</str<strong>on</strong>g>-<br />
<str<strong>on</strong>g>LCD</str<strong>on</strong>g> panel images are shown in Fig. 3(a), (b). Fig. 3(a)<br />
includes 4 White and Dark Mura defects and Fig. 3(b) has<br />
<str<strong>on</strong>g>the</str<strong>on</strong>g> signal generated Muras with various size and strength.<br />
The positi<strong>on</strong> of Muras are encircled or marked with arrows.<br />
The line profile of dotted circle and arrow is shown in Fig.3<br />
(c). From <str<strong>on</strong>g>the</str<strong>on</strong>g>se figures, <str<strong>on</strong>g>the</str<strong>on</strong>g> illuminati<strong>on</strong> of <str<strong>on</strong>g>TFT</str<strong>on</strong>g>-<str<strong>on</strong>g>LCD</str<strong>on</strong>g> image<br />
shows local and global variati<strong>on</strong>s at <str<strong>on</strong>g>the</str<strong>on</strong>g> same time.<br />
3 Proposed <str<strong>on</strong>g>Defect</str<strong>on</strong>g> Detecti<strong>on</strong> Algorithm<br />
No<br />
Not Mura<br />
Input <str<strong>on</strong>g>Image</str<strong>on</strong>g><br />
Discrete Cosine Trans<str<strong>on</strong>g>for</str<strong>on</strong>g>m<br />
Adapted CSF Filtering<br />
Inverse<br />
Discrete Cosine Trans<str<strong>on</strong>g>for</str<strong>on</strong>g>m<br />
Polynomial Regressi<strong>on</strong> Analysis<br />
Tri-modal Thresholding<br />
Labeling<br />
L<br />
if C<br />
L<br />
Result <str<strong>on</strong>g>Image</str<strong>on</strong>g><br />
Mura<br />
Fig.4. The proposed block diagram <str<strong>on</strong>g>for</str<strong>on</strong>g> <str<strong>on</strong>g>TFT</str<strong>on</strong>g>-<str<strong>on</strong>g>LCD</str<strong>on</strong>g> image defect detecti<strong>on</strong><br />
Yes<br />
The flow chart of <str<strong>on</strong>g>the</str<strong>on</strong>g> proposed algorithm is seen in Fig.<br />
4. First, <str<strong>on</strong>g>the</str<strong>on</strong>g> input image is DCT trans<str<strong>on</strong>g>for</str<strong>on</strong>g>med and <str<strong>on</strong>g>the</str<strong>on</strong>g>n<br />
proposed ACSF filter is applied to enlarge <str<strong>on</strong>g>the</str<strong>on</strong>g> Mura signal.<br />
After <str<strong>on</strong>g>the</str<strong>on</strong>g> signal is inverse Discrete Cosine Trans<str<strong>on</strong>g>for</str<strong>on</strong>g>med,<br />
polynomial regressi<strong>on</strong> (PR) process is employed <str<strong>on</strong>g>for</str<strong>on</strong>g><br />
flattening. Then <str<strong>on</strong>g>the</str<strong>on</strong>g> enhanced image is segmented by trimodal<br />
thresholding to find White and Dark Mura at <strong>on</strong>ce.<br />
To leave out reliable defects, false defects are eliminated if<br />
<str<strong>on</strong>g>the</str<strong>on</strong>g> mean gray level of a defect does not have much<br />
difference from <str<strong>on</strong>g>the</str<strong>on</strong>g>ir background.<br />
3.1 Adapted CSF in DCT Domain<br />
The human visual system(HVS) has different<br />
frequency sensitivity and that is ma<str<strong>on</strong>g>the</str<strong>on</strong>g>matically represented<br />
as CSF given by <str<strong>on</strong>g>the</str<strong>on</strong>g> experiment[8][9][10]. The HVS can<br />
detect more easily <str<strong>on</strong>g>the</str<strong>on</strong>g> difference varying in low frequency<br />
than high frequency. The CSF can be expressed by a<br />
functi<strong>on</strong> and CSF graph is shown in Fig. 5.<br />
Where,<br />
1.<br />
1<br />
H( f ) 2.<br />
6(<br />
0.<br />
192 0.<br />
114 f ) exp( (<br />
0.<br />
114 f ) ) (2)<br />
f f f is <str<strong>on</strong>g>the</str<strong>on</strong>g> frequency having unit of<br />
2<br />
x<br />
2<br />
y<br />
cycle/degree. HVS have best sensitivity around<br />
8[cycles/degree] and above 40[cycles/degree] its value<br />
become smaller and smaller.<br />
CSF Value<br />
1.4<br />
1.2<br />
1<br />
0.8<br />
0.6<br />
0.4<br />
0.2<br />
0<br />
CSF Graph<br />
0 4 8 12 16 20 24 28 32 36 40 44 48 52 56 60<br />
Frequency[Cycle/Degree]<br />
Fig.5. The c<strong>on</strong>trast sensitivity functi<strong>on</strong> graph.<br />
There have been many ef<str<strong>on</strong>g>for</str<strong>on</strong>g>ts to use CSF to <str<strong>on</strong>g>the</str<strong>on</strong>g>ir<br />
applicati<strong>on</strong>s, especially in compressi<strong>on</strong>. In order to use <str<strong>on</strong>g>the</str<strong>on</strong>g><br />
CSF in real applicati<strong>on</strong> relative sensitivity value is<br />
important[10]. Without loss of generality, <str<strong>on</strong>g>the</str<strong>on</strong>g> maximum<br />
CSF frequency can be normalized as 2 in DCT domain.<br />
The DCT has good energy compacti<strong>on</strong> property and it has<br />
also fast algorithm. The DCT has no phase in<str<strong>on</strong>g>for</str<strong>on</strong>g>mati<strong>on</strong>, it<br />
<strong>on</strong>ly c<strong>on</strong>sider <str<strong>on</strong>g>the</str<strong>on</strong>g> magnitude of trans<str<strong>on</strong>g>for</str<strong>on</strong>g>med data. The CSF<br />
has <strong>on</strong>ly magnitude, so it will be enough to c<strong>on</strong>sider <str<strong>on</strong>g>the</str<strong>on</strong>g><br />
proposed ACSF in DCT domain. The proposed adapted CSF<br />
in DCT is ma<str<strong>on</strong>g>the</str<strong>on</strong>g>matically expressed by <str<strong>on</strong>g>the</str<strong>on</strong>g> followings.
H(<br />
f / 64<br />
2<br />
)<br />
ACSF( f Nor ) <br />
H(<br />
0)<br />
Where, H ( 0)<br />
is <str<strong>on</strong>g>the</str<strong>on</strong>g> c<strong>on</strong>stant value having 0.4992 and <str<strong>on</strong>g>the</str<strong>on</strong>g><br />
adapted 1-d and 3-d CSF are shown in Fig. 6.<br />
Value<br />
2.5<br />
2<br />
1.5<br />
1<br />
0.5<br />
0<br />
0<br />
Proposed Adapted CSF in DCT Domain<br />
<br />
Frequency<br />
(a)<br />
(b)<br />
Fig. 6. The adapted CSF in DCT domain. (a) 1-d ACSF, (b) 3-d ACSF.<br />
The proposed ACSF is low frequency boost and high<br />
frequency reducti<strong>on</strong> filter shape. This filter enlarge Mura<br />
signal regi<strong>on</strong> approximately 2 times and it also enlarge<br />
background signal fluctuati<strong>on</strong> a little. As <str<strong>on</strong>g>the</str<strong>on</strong>g> LU is<br />
decreased, <str<strong>on</strong>g>the</str<strong>on</strong>g> background signal is more magnified so level<br />
adjustment process must be needed. The following secti<strong>on</strong><br />
describes how to flat <str<strong>on</strong>g>the</str<strong>on</strong>g> emphasized signal.<br />
3.2 Polynomial Regressi<strong>on</strong><br />
In general, regressi<strong>on</strong> method is used to trace general<br />
tendency of <str<strong>on</strong>g>the</str<strong>on</strong>g> signal. This method represents its target<br />
signal with best fitting functi<strong>on</strong> in mean square error (MSE)<br />
point. Out of trace signal such as Mura signal in <str<strong>on</strong>g>TFT</str<strong>on</strong>g>-<str<strong>on</strong>g>LCD</str<strong>on</strong>g><br />
image does not much affect to find degenerated signal. Each<br />
line of <str<strong>on</strong>g>TFT</str<strong>on</strong>g>-<str<strong>on</strong>g>LCD</str<strong>on</strong>g> image can be degenerated by<br />
2<br />
(3)<br />
f<br />
B<br />
R<br />
M<br />
<br />
<br />
f ( x,<br />
y)<br />
x<br />
1or<br />
y 1<br />
( x,<br />
y)<br />
<br />
M<br />
( fˆ<br />
m<br />
R ( x,<br />
y)<br />
f ( x,<br />
y))<br />
(4)<br />
Where, f ( x,<br />
y)<br />
B is biased PR functi<strong>on</strong>, R f ( x,<br />
y)<br />
is original<br />
signal, fˆ ( x,<br />
y)<br />
m is m th order estimated PR functi<strong>on</strong> and<br />
R<br />
M is <str<strong>on</strong>g>the</str<strong>on</strong>g> number of pixels.<br />
The PR in horiz<strong>on</strong>tal directi<strong>on</strong> is expressed as<br />
m<br />
m<br />
i<br />
fˆ<br />
( x,<br />
y)<br />
a x <br />
(5)<br />
R<br />
<br />
i0<br />
Where, a is i th order weight value, m is PR estimated<br />
i<br />
order and is <str<strong>on</strong>g>the</str<strong>on</strong>g> error.<br />
MSE is used to find <str<strong>on</strong>g>the</str<strong>on</strong>g> best fitting line. One horiz<strong>on</strong>tal- line<br />
MSE, E, is expressed to <str<strong>on</strong>g>the</str<strong>on</strong>g> following Eq. (6)<br />
E <br />
n<br />
<br />
i0<br />
2<br />
n<br />
m<br />
m<br />
<br />
f x,<br />
y)<br />
fˆ<br />
R ( x,<br />
y)<br />
f ( x,<br />
y)<br />
<br />
i<br />
k <br />
( ak<br />
xi<br />
<br />
(6)<br />
i0<br />
<br />
k0<br />
<br />
In order to find minimizing E , partial differentiati<strong>on</strong><br />
employed given by<br />
E<br />
a<br />
j<br />
<br />
<br />
n<br />
<br />
i0<br />
n<br />
<br />
i0<br />
<br />
2<br />
f ( x,<br />
y)<br />
<br />
<br />
f ( x ) x<br />
i<br />
j<br />
i i<br />
The equati<strong>on</strong> is expressed as<br />
n<br />
j<br />
f ( xi<br />
) x i i<br />
i0<br />
<br />
a<br />
n<br />
<br />
a<br />
m<br />
m<br />
<br />
k0<br />
n<br />
a <br />
k<br />
k0<br />
i0<br />
jk<br />
xi<br />
a<br />
m<br />
k j<br />
ak<br />
xi<br />
(<br />
xi<br />
)<br />
<br />
x<br />
jk<br />
i<br />
j<br />
xi<br />
a1<br />
0<br />
i0<br />
i0<br />
k<br />
i0<br />
i0<br />
Matrix representati<strong>on</strong> is given by<br />
<br />
<br />
<br />
<br />
<br />
<br />
<br />
<br />
n<br />
<br />
x<br />
x<br />
i<br />
m<br />
i<br />
<br />
<br />
<br />
<br />
x<br />
x<br />
x<br />
i<br />
2<br />
i<br />
m1<br />
i<br />
<br />
<br />
<br />
<br />
n<br />
<br />
<br />
<br />
x<br />
<br />
x<br />
m<br />
i<br />
m1<br />
i<br />
x<br />
2m<br />
i<br />
n<br />
x<br />
n<br />
jm<br />
i<br />
0<br />
x<br />
j1<br />
i<br />
0<br />
a<br />
0 <br />
<br />
<br />
<br />
a1<br />
<br />
<br />
<br />
<br />
<br />
<br />
am<br />
<br />
<br />
<br />
<br />
<br />
2<br />
E is<br />
a<br />
i<br />
(7)<br />
(8)<br />
f ( xi<br />
) <br />
<br />
f ( xi<br />
) xi<br />
(9)<br />
<br />
m <br />
f ( xi<br />
) xi<br />
<br />
Gauss-Jordan eliminati<strong>on</strong> is used to find <str<strong>on</strong>g>the</str<strong>on</strong>g> polynomial<br />
coefficient a . i<br />
3.3 Tri-modal Thresholding<br />
After <str<strong>on</strong>g>the</str<strong>on</strong>g> <str<strong>on</strong>g>TFT</str<strong>on</strong>g>-<str<strong>on</strong>g>LCD</str<strong>on</strong>g> image is enhanced, tri-modal<br />
Thresholding [3] is used to segment Dark and Bright Mura
at <strong>on</strong>ce. The tri-modal thresholding functi<strong>on</strong> fT ( x,<br />
y)<br />
is<br />
given by<br />
f T<br />
255<br />
if ( f ( x,<br />
y)<br />
m k<br />
)<br />
<br />
( x,<br />
y)<br />
128<br />
else if ( f ( x,<br />
y)<br />
m k<br />
)<br />
<br />
0<br />
else<br />
(10)<br />
Where, f ( x,<br />
y)<br />
is <str<strong>on</strong>g>the</str<strong>on</strong>g> gray level at positi<strong>on</strong> at ( x , y)<br />
, m , <br />
are <str<strong>on</strong>g>the</str<strong>on</strong>g> mean and standard deviati<strong>on</strong> respectively and k is<br />
c<strong>on</strong>trolled c<strong>on</strong>stant to access <str<strong>on</strong>g>the</str<strong>on</strong>g> amounts of abnormal gray<br />
level. After tri-modal thresholding <str<strong>on</strong>g>the</str<strong>on</strong>g> Bright Muras have<br />
value of 255, <str<strong>on</strong>g>the</str<strong>on</strong>g> Dark Muras have 128 and background<br />
regi<strong>on</strong> have value of 0.<br />
3.4 <str<strong>on</strong>g>Defect</str<strong>on</strong>g> Analysis<br />
The segmented result can have false defects such noise,<br />
neglectful small regi<strong>on</strong>, etc. So reliable defect c<strong>on</strong>firmati<strong>on</strong>,<br />
defect analysis process is needed. In this paper, HVS based<br />
false regi<strong>on</strong> eliminati<strong>on</strong> method is proposed. The noticeable<br />
Luminance difference is given by <str<strong>on</strong>g>the</str<strong>on</strong>g> Weber C<strong>on</strong>stant C Weber<br />
in <str<strong>on</strong>g>the</str<strong>on</strong>g> Weber regi<strong>on</strong> as <str<strong>on</strong>g>the</str<strong>on</strong>g> following Equati<strong>on</strong> (11) [11].<br />
C W eber<br />
L<br />
(11)<br />
L<br />
Where, L, L<br />
are <str<strong>on</strong>g>the</str<strong>on</strong>g> background regi<strong>on</strong> luminance and <str<strong>on</strong>g>the</str<strong>on</strong>g><br />
luminance differences between <str<strong>on</strong>g>the</str<strong>on</strong>g> background regi<strong>on</strong> and<br />
defect regi<strong>on</strong>. We use C value as 0.02 in this paper.<br />
Weber<br />
4 Experimental Results<br />
The proposed method is tested by using <str<strong>on</strong>g>the</str<strong>on</strong>g> 160 real<br />
Muras and 40 generated <strong>on</strong>es. The acquired <str<strong>on</strong>g>TFT</str<strong>on</strong>g>-<str<strong>on</strong>g>LCD</str<strong>on</strong>g><br />
images have 400 m spatial resoluti<strong>on</strong> <str<strong>on</strong>g>for</str<strong>on</strong>g> each pixel and an<br />
8-bit brightness resoluti<strong>on</strong>. To evaluate <str<strong>on</strong>g>the</str<strong>on</strong>g> per<str<strong>on</strong>g>for</str<strong>on</strong>g>mance of<br />
proposed algorithm, <strong>on</strong>e dimensi<strong>on</strong>al line profile, <str<strong>on</strong>g>the</str<strong>on</strong>g><br />
enhanced result image and final segmented Muras al<strong>on</strong>g<br />
with detecti<strong>on</strong> accuracy table are shown in this paper.<br />
The proposed defect detecti<strong>on</strong> results are shown in Fig. 7.<br />
The test image Fig. 7(a) has artificially generated Muras<br />
with various strengths and sizes. In <str<strong>on</strong>g>the</str<strong>on</strong>g> enhanced result<br />
image, Fig. 7(b), <str<strong>on</strong>g>the</str<strong>on</strong>g> defect is more visible than original<br />
image and that are evident in Fig.7 (e),(h),(k) also. The<br />
original image of Fig. 7(g) has much background variati<strong>on</strong>,<br />
so <str<strong>on</strong>g>the</str<strong>on</strong>g> defects are rarely seen in <str<strong>on</strong>g>the</str<strong>on</strong>g> original image. But <str<strong>on</strong>g>the</str<strong>on</strong>g><br />
enhanced image has relatively flattening background and <str<strong>on</strong>g>the</str<strong>on</strong>g><br />
defects are more salient. In <str<strong>on</strong>g>the</str<strong>on</strong>g> test image Fig. 7(j), novel<br />
enhancement result is given and that helps final<br />
segmentati<strong>on</strong> result.<br />
(a) (b) (c)<br />
(d) (e) (f)<br />
(g) (h) (i)<br />
(j) (k) (l)<br />
Fig. 7 The results of proposed methods. (a),(d),(g),(j) are test images,<br />
(b),(e),(h),(k) are enhanced results and (c),(f),(i),(l) are final segmented<br />
results of original image (a),(d),(g),(j) respectively.<br />
The microscopic enhancement results by <str<strong>on</strong>g>the</str<strong>on</strong>g> line profiles are<br />
shown in Fig. 8. Fig. 8 is <str<strong>on</strong>g>the</str<strong>on</strong>g> enhancement results’ profiles<br />
of Fig. 7. By that, <str<strong>on</strong>g>the</str<strong>on</strong>g> effectiveness of our algorithm is seen<br />
more clearly. In <str<strong>on</strong>g>the</str<strong>on</strong>g> filtered line profile results, our proposed<br />
enhancement method can flatten <str<strong>on</strong>g>the</str<strong>on</strong>g> background signal<br />
fluctuati<strong>on</strong> and emphasize <str<strong>on</strong>g>the</str<strong>on</strong>g> defect regi<strong>on</strong>.<br />
The final per<str<strong>on</strong>g>for</str<strong>on</strong>g>mance results are summarized in Table 1.<br />
false-positive and false-negative measure are used to<br />
evaluate <str<strong>on</strong>g>the</str<strong>on</strong>g> accuracy of defect detecti<strong>on</strong> result. There are<br />
some problems to <str<strong>on</strong>g>the</str<strong>on</strong>g> eliminati<strong>on</strong> of defects existing at <str<strong>on</strong>g>the</str<strong>on</strong>g><br />
boundary regi<strong>on</strong> and very weak-small-size defects. Except<br />
such cases, <str<strong>on</strong>g>the</str<strong>on</strong>g> false-positive rate and false-negative rate are<br />
quite acceptable.<br />
Table 1. Experimental results <str<strong>on</strong>g>for</str<strong>on</strong>g> <str<strong>on</strong>g>the</str<strong>on</strong>g> detecti<strong>on</strong> of <str<strong>on</strong>g>the</str<strong>on</strong>g><br />
Muras.<br />
Number of<br />
<str<strong>on</strong>g>Defect</str<strong>on</strong>g>s<br />
False-positive Falsenegative<br />
Artificially<br />
Generated Mura<br />
160 0.04 0.03<br />
Real Mura 40 0.03 0.02
Gray Level<br />
Gray Level<br />
Gray Level<br />
Gray Level<br />
150<br />
140<br />
130<br />
120<br />
110<br />
100<br />
Line Profiles<br />
Original 183 Line<br />
Enhanced 183 Line<br />
90<br />
0 50 100 150 200 250<br />
110<br />
105<br />
100<br />
95<br />
90<br />
85<br />
Positi<strong>on</strong><br />
(a)<br />
Line Profiles<br />
Original 95 Line<br />
Enhanced 95 line<br />
80<br />
0 50 100 150 200 250<br />
190<br />
180<br />
170<br />
160<br />
150<br />
140<br />
130<br />
Positi<strong>on</strong><br />
(b)<br />
Line Profiles<br />
Original 200 Line<br />
Enhanced 200 Line<br />
120<br />
0 50 100 150 200 250<br />
200<br />
190<br />
180<br />
170<br />
160<br />
Positi<strong>on</strong><br />
(c)<br />
Line Profiles<br />
Original 128 Line<br />
Enhanced 128 Line<br />
150<br />
0 50 100 150 200 250<br />
Positi<strong>on</strong><br />
(d)<br />
Fig. 8 The line profiles of original image and enhanced result. (a),(b),(c),(d)<br />
are line profiles of Fig. 7(a),(d),(g),(j) and Fig. 7(b),(e),(h),(k) respectively.<br />
5 C<strong>on</strong>clusi<strong>on</strong>s<br />
In this paper, a novel defect detecti<strong>on</strong> algorithm in <str<strong>on</strong>g>TFT</str<strong>on</strong>g>-<br />
<str<strong>on</strong>g>LCD</str<strong>on</strong>g> image with <str<strong>on</strong>g>the</str<strong>on</strong>g> guidance of enhanced image using<br />
ACSF and PR is proposed. The ACSF in DCT domain is<br />
used to emphasize defect regi<strong>on</strong> while PR is employed to<br />
level <str<strong>on</strong>g>the</str<strong>on</strong>g> background signal. Tri-modal thresholding<br />
segmentati<strong>on</strong> method is utilized in order to find White Mura<br />
and Dark Mura at <str<strong>on</strong>g>the</str<strong>on</strong>g> same time. The defect candidates are<br />
given by <str<strong>on</strong>g>the</str<strong>on</strong>g> distant gray level from <str<strong>on</strong>g>the</str<strong>on</strong>g> mean. For reliable<br />
defect c<strong>on</strong>firmati<strong>on</strong>, Weber’s C<strong>on</strong>stant is used <str<strong>on</strong>g>for</str<strong>on</strong>g> <str<strong>on</strong>g>the</str<strong>on</strong>g><br />
purpose of eliminating false detected defects.<br />
The effectiveness of our methods is tested by <str<strong>on</strong>g>the</str<strong>on</strong>g> two points.<br />
One is image enhancement and <str<strong>on</strong>g>the</str<strong>on</strong>g> o<str<strong>on</strong>g>the</str<strong>on</strong>g>r is final<br />
segmentati<strong>on</strong> result. Mura signal is clearly enlarged al<strong>on</strong>g<br />
with background signal flatten. The final defect detecti<strong>on</strong><br />
results are evaluated by false-positive and false-negative<br />
measure. By <str<strong>on</strong>g>the</str<strong>on</strong>g> experimental results our proposed method<br />
has novel result in finding defects in <str<strong>on</strong>g>TFT</str<strong>on</strong>g>-<str<strong>on</strong>g>LCD</str<strong>on</strong>g> image and it<br />
can be applicable to similar FPD images.<br />
6 References<br />
[1] B. K. Noh, K. H. Kim, et al., <str<strong>on</strong>g>LCD</str<strong>on</strong>g> ENGINEERING,<br />
Sung An Dang, 2002.<br />
[2] VESA Flat Panel Display Measurements Standard Ver<br />
2.0, June 1,2001.<br />
[3] J.H. Oh, D.M. Kwak, K. B Lee, et al. "Line defect<br />
detecti<strong>on</strong> in <str<strong>on</strong>g>TFT</str<strong>on</strong>g>-<str<strong>on</strong>g>LCD</str<strong>on</strong>g> using directi<strong>on</strong>al filter bank and<br />
adaptive multilevel thresholding", Key Engineering<br />
Materials, vol..270-273, 233-238 2004.<br />
[4] Seung-Il Baek, Woo-Seob, Tak-mo Koo, Il Choi and<br />
Kil-Houm Park, "INSPECTION OF DEFECT ON <str<strong>on</strong>g>LCD</str<strong>on</strong>g><br />
PANEL USING POLYNOMIAL APPROXIMATION,"<br />
TENCON 2004.2004 IEEE Regi<strong>on</strong> 10 C<strong>on</strong>ference Volume<br />
A. 21-24 Nov. 2004 pp. 235~238.Vol. 2004.<br />
[5] Gyu-B<strong>on</strong>g Lee, Cho<strong>on</strong>g-Gun Lee, Se-Yun Kim, Kil-<br />
Houm Park, "Adative Surface Fitting <str<strong>on</strong>g>for</str<strong>on</strong>g> <str<strong>on</strong>g>Inspecti<strong>on</strong></str<strong>on</strong>g> of FPD<br />
Devicess Using Multilevel B-spline Approximati<strong>on</strong>," The<br />
21st Internati<strong>on</strong>al Technical C<strong>on</strong>ference <strong>on</strong> Circuits/Systems,<br />
Computers and Communicati<strong>on</strong>s vol. 2, pp. 205~208. 2006.<br />
[6] David L.D<strong>on</strong>oho, Iain M. Johnst<strong>on</strong>e, et al, "Adapting<br />
to Unknown Smoothness via Wavelet Shrinkage",<br />
[7] Imola K. Fodor, Chandrika Kamath, "Denoising<br />
Through Wavelet Shrinkage: An Empirical Study", Journal<br />
of Electr<strong>on</strong>ic Imaging, July 27, 2001<br />
[8] Xiao Liang, Wu Huizh<strong>on</strong>g, "Multiple Perceptual<br />
Watermarks Using Multiple-<str<strong>on</strong>g>Based</str<strong>on</strong>g> Number C<strong>on</strong>versi<strong>on</strong> in<br />
Wavelet Domain," Proceedings of ICCT2003, pp. 213 - 216,<br />
2003<br />
[9] Ajeetkumar Gaddipatti, Raghu Maciraju, R<strong>on</strong>i Yagel,<br />
"Steering <str<strong>on</strong>g>Image</str<strong>on</strong>g> Generati<strong>on</strong> with Wavelet <str<strong>on</strong>g>Based</str<strong>on</strong>g> Perceptual<br />
Metric",Gaddipati et al.<br />
[10] Garrett M.Johns<strong>on</strong> and Mark D.Fairchild Munsell<br />
Color Science Laboratory, Center <str<strong>on</strong>g>for</str<strong>on</strong>g> Imaging Science<br />
Rochester Institude of Technology, Rochester New York,<br />
"On C<strong>on</strong>trast Sensitivity in an <str<strong>on</strong>g>Image</str<strong>on</strong>g> Diffrence Model"<br />
[11] Hecht, "The visual discriminati<strong>on</strong> of intensity and <str<strong>on</strong>g>the</str<strong>on</strong>g><br />
Weber-Fechner law", J. Gen. Phsiol., vol.7, pp.241, 1924.
[12] S. G. Mallat, "A <str<strong>on</strong>g>the</str<strong>on</strong>g>ory of multiresoluti<strong>on</strong> signal<br />
decompositi<strong>on</strong> : <str<strong>on</strong>g>the</str<strong>on</strong>g> wavelet representati<strong>on</strong>," IEEE Trans.<br />
Patten Analysis Machine Intell. Vol. 11, pp. 674-493, 1989.<br />
[13] Leslie Lamport. “LaTeX: A Document Preparati<strong>on</strong><br />
System”. Addis<strong>on</strong>-Wesley Publishing Company, 1986.<br />
[14] Ree Source Pers<strong>on</strong>. “Title of Research Paper”; name of<br />
journal (name of publisher of <str<strong>on</strong>g>the</str<strong>on</strong>g> journal), Vol. No., Issue<br />
No., Page numbers (eg.728—736), M<strong>on</strong>th, and Year of<br />
publicati<strong>on</strong> (eg. Oct 2006).