Municipal Waste Management Strategy for County Durham
Municipal Waste Management Strategy for County Durham
Municipal Waste Management Strategy for County Durham

You also want an ePaper? Increase the reach of your titles
YUMPU automatically turns print PDFs into web optimized ePapers that Google loves.
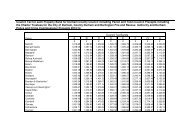
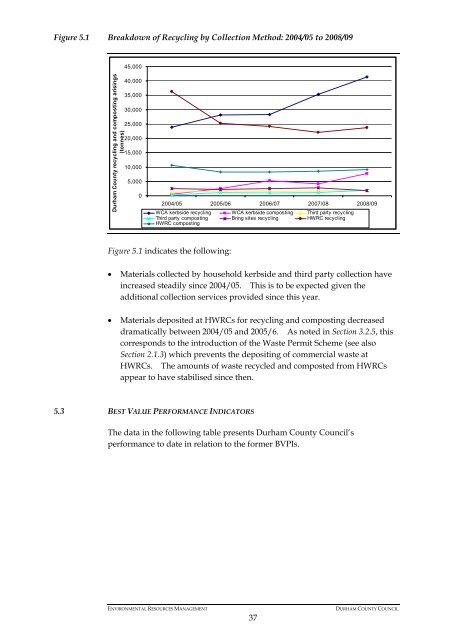
Figure 5.1 Breakdown of Recycling by Collection Method: 2004/05 to 2008/09<br />
<strong>Durham</strong> <strong>County</strong> recycling and composting arisings<br />
(tonnes)<br />
45,000<br />
40,000<br />
35,000<br />
30,000<br />
25,000<br />
20,000<br />
15,000<br />
10,000<br />
5,000<br />
0<br />
Figure 5.1 indicates the following:<br />
• Materials collected by household kerbside and third party collection have<br />
increased steadily since 2004/05. This is to be expected given the<br />
additional collection services provided since this year.<br />
• Materials deposited at HWRCs <strong>for</strong> recycling and composting decreased<br />
dramatically between 2004/05 and 2005/6. As noted in Section 3.2.5, this<br />
corresponds to the introduction of the <strong>Waste</strong> Permit Scheme (see also<br />
Section 2.1.3) which prevents the depositing of commercial waste at<br />
HWRCs. The amounts of waste recycled and composted from HWRCs<br />
appear to have stabilised since then.<br />
5.3 BEST VALUE PERFORMANCE INDICATORS<br />
2004/05 2005/06 2006/07 2007/08 2008/09<br />
WCA kerbside recycling WCA kerbside composting Third party recycling<br />
Third party composting Bring sites recycling HWRC recycling<br />
HWRC composting<br />
The data in the following table presents <strong>Durham</strong> <strong>County</strong> Council’s<br />
per<strong>for</strong>mance to date in relation to the <strong>for</strong>mer BVPIs.<br />
ENVIRONMENTAL RESOURCES MANAGEMENT DURHAM COUNTY COUNCIL<br />
37