Municipal Waste Management Strategy for County Durham
Municipal Waste Management Strategy for County Durham
Municipal Waste Management Strategy for County Durham

You also want an ePaper? Increase the reach of your titles
YUMPU automatically turns print PDFs into web optimized ePapers that Google loves.
<strong>Municipal</strong> <strong>Waste</strong> <strong>Management</strong> <strong>Strategy</strong><br />
Baseline Assessment<br />
March 2010
<strong>Durham</strong> <strong>County</strong> Council<br />
<strong>Municipal</strong> <strong>Waste</strong> <strong>Management</strong><br />
<strong>Strategy</strong> <strong>for</strong> <strong>County</strong> <strong>Durham</strong>:<br />
Baseline Data Assessment<br />
Draft Final Report<br />
ERM Project: 0103952/01<br />
Prepared by: Saori Smith, Peter Braithwaite &<br />
Phil Short<br />
For and on behalf of<br />
Environmental Resources <strong>Management</strong><br />
Approved by: Paul Fletcher<br />
Signed:<br />
Position: Partner<br />
Date: 23 rd November 2009<br />
This report has been prepared by Environmental Resources<br />
<strong>Management</strong> the trading name of Environmental Resources<br />
<strong>Management</strong> Limited, with all reasonable skill, care and diligence<br />
within the terms of the Contract with the client, incorporating our<br />
General Terms and Conditions of Business and taking account of the<br />
resources devoted to it by agreement with the client.<br />
We disclaim any responsibility to the client and others in respect of<br />
any matters outside the scope of the above.<br />
This report is confidential to the client and we accept no responsibility<br />
of whatsoever nature to third parties to whom this report, or any part<br />
thereof, is made known. Any such party relies on the report at their<br />
own risk.
CONTENTS<br />
1 INTRODUCTION 1<br />
1.1 WASTE MANAGEMENT IN COUNTY DURHAM 1<br />
1.2 BACKGROUND 1<br />
1.3 COUNTY DURHAM’S WASTE STRATEGY 3<br />
1.4 SCOPE OF THE DATA REVIEW 4<br />
1.5 STRUCTURE OF THIS REPORT 5<br />
2 CURRENT WASTE SERVICES AND INFRASTRUCTURE 5<br />
2.1 HOUSEHOLD WASTE COLLECTION 7<br />
2.2 NON-HOUSEHOLD WASTE COLLECTIONS 12<br />
2.3 TRANSFER, TREATMENT AND DISPOSAL OF WASTE 12<br />
2.4 TREATMENT OPTIONS 15<br />
2.5 DISPOSAL 15<br />
3 WASTE ARISINGS DATA 17<br />
3.1 MUNICIPAL SOLID WASTE ARISINGS 17<br />
3.2 HOUSEHOLD WASTE 20<br />
3.3 NON-HOUSEHOLD WASTE 29<br />
4 WASTE COMPOSITION AND CAPTURE ANALYSIS 31<br />
4.1 COMPOSITION OF DURHAM COUNTY MUNICIPAL SOLID WASTE 31<br />
4.2 MATERIALS CAPTURE ANALYSIS 33<br />
5 RECYCLING & COMPOSTING PERFORMANCE 35<br />
5.1 DURHAM COUNTY WASTE TARGETS 35<br />
5.2 RECYCLING AND COMPOSTING RATES 36<br />
5.3 BEST VALUE PERFORMANCE INDICATORS 37<br />
5.4 LATS POSITION 42<br />
6 WASTE ARISINGS PROJECTIONS 45<br />
ANNEX A KERBSIDE COLLECTION SERVICES (2008/09)<br />
ANNEX B DETAILED WASTE DATE 2006/07 TO 2008/09<br />
ANNEX C HOUSEHOLD WASTE RECYCLING CENTRES: WASTE ARISINGS<br />
ANNEX D WASTE TREATMENT AND DISPOSAL DATA<br />
ANNEX E MATERIALS CAPTURE ANALYSIS
1 INTRODUCTION<br />
1.1 WASTE MANAGEMENT IN COUNTY DURHAM<br />
<strong>Durham</strong> <strong>County</strong> Council wishes to take a sustainable approach to the<br />
management of municipal waste in the county, which fully explores waste<br />
management options other than landfill. European and UK legislation has<br />
set challenging targets <strong>for</strong> increased levels of reuse, recycling and composting<br />
and <strong>for</strong> the reduction of residual waste to landfill. In this context, <strong>Durham</strong><br />
<strong>County</strong> Council has established the <strong>Waste</strong> Solutions Project (WSP) (1) in order<br />
to provide a long-term solution to the county’s waste treatment requirements.<br />
<strong>Durham</strong> <strong>County</strong> Council recognises the importance of robust and transparent<br />
waste management data to support the review and ongoing development of<br />
the waste strategy within the framework of the WSP. There<strong>for</strong>e, this baseline<br />
data assessment, along with other technical reports and options appraisals,<br />
will be used to in<strong>for</strong>m the development of the Council’s <strong>Municipal</strong> <strong>Waste</strong><br />
<strong>Management</strong> <strong>Strategy</strong> (MWMS) and other procurement plans within the WSP.<br />
This document presents the findings of a baseline data assessment to establish<br />
the current situation of the <strong>County</strong>’s waste infrastructure, arisings and<br />
management routes.<br />
1.2 BACKGROUND<br />
<strong>Durham</strong> <strong>County</strong> covers 226,000 hectares extending from the North Sea<br />
heritage coast to the east of the high moors of the North Pennines area of<br />
outstanding natural beauty in the west. In April 2009, the new Unitary<br />
Authority was created, prior to which a two tier system operated with local<br />
government being split between the <strong>County</strong> Council and the seven <strong>for</strong>mer<br />
district councils listed below.<br />
• Chester-le-Street District Council;<br />
• Derwentside District Council;<br />
• <strong>Durham</strong> City Council;<br />
• Easington District Council;<br />
• Sedgefield Borough Council;<br />
• Teesdale District Council; and<br />
• Wear Valley District Council.<br />
In 2005, Acorn was commissioned to undertake a data profile of <strong>County</strong><br />
<strong>Durham</strong> (2) . <strong>County</strong> <strong>Durham</strong> has a population of approximately 505,000 (3) .<br />
There is considerable variation between the seven <strong>for</strong>mer district areas, most<br />
(1) http://www.durhamwsp.info/Pages/Home.aspx<br />
(2) Acorn data profile report<br />
(3) ONS data - mid 2007 estimate<br />
ENVIRONMENTAL RESOURCES MANAGEMENT DURHAM COUNTY COUNCIL<br />
1
notably between the densely populated <strong>for</strong>mer districts of <strong>Durham</strong> City and<br />
Easington and the rural area of Teesdale.<br />
Figure 1.1 Population of <strong>Durham</strong> <strong>County</strong> by Former District (2007)<br />
Population (000's)<br />
100.0<br />
90.0<br />
80.0<br />
70.0<br />
60.0<br />
50.0<br />
40.0<br />
30.0<br />
20.0<br />
10.0<br />
-<br />
Chester-le-<br />
Street<br />
Derwentside <strong>Durham</strong> Easington Sedgefield Teesdale Wear Valley<br />
The Acorn <strong>County</strong> Profile report identified the following points in relation to<br />
the <strong>County</strong>’s demographic situation.<br />
• In total, approximately 33% of the population are ranked as ‘hard-pressed’.<br />
• The main area of deprivation is in the East <strong>Durham</strong> area, covering a<br />
portion of Easington, through south <strong>Durham</strong> City and into northern<br />
Sedgefield and east of Wear Valley.<br />
• Chester-le-Street and Derwentside present a mixed picture with ‘hardpressed’<br />
areas alongside areas of varying degrees of affluence.<br />
• The majority of Teesdale and the western portion of Wear Valley have<br />
been ranked as ‘wealthy achievers’.<br />
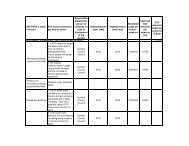
Table 1.1 Number of households in <strong>Durham</strong> <strong>County</strong> by district<br />
Unitary Authority Area Former District Name<br />
Number of households<br />
2001 2009*<br />
Area North<br />
Chester-le-Street<br />
Derwentside<br />
25,000<br />
37,000<br />
24,668<br />
41,722<br />
Area East<br />
<strong>Durham</strong> City<br />
Easington<br />
37,000<br />
39,000<br />
39,244<br />
43,234<br />
Sedgefield 38,000 40,859<br />
Area South<br />
Teesdale 11,000 11,843<br />
Wear Valley 27,000 30,594<br />
TOTAL 214,000 232,164<br />
*Source: Valuation Office Agency of Her Majesty's Revenue & Customs, 29.03.09.<br />
Until recently the responsibility <strong>for</strong> waste management in the county was split<br />
as follows:<br />
ENVIRONMENTAL RESOURCES MANAGEMENT DURHAM COUNTY COUNCIL<br />
2
• the seven district councils were <strong>Waste</strong> Collection Authorities (WCAs); and<br />
• the <strong>County</strong> Council was the <strong>Waste</strong> Disposal Authority (WDA).<br />
Since April 2009, the newly <strong>for</strong>med Unitary Authority, <strong>Durham</strong> <strong>County</strong><br />
Council, has been responsible <strong>for</strong> both the collection and disposal of municipal<br />
waste in <strong>County</strong> <strong>Durham</strong>.<br />
The Unitary Authority has been split into three Operational Delivery Areas<br />
(ODAs) covering 14 Area Action Partnerships (AAPs), which group areas that<br />
have similar requirements together. The three ODAs have boundaries based<br />
on the <strong>for</strong>mer district council areas as follows:<br />
• Chester-le-Street and Derwentside;<br />
• <strong>Durham</strong> City and Easington; and<br />
• Sedgefield, Teesdale and Wear Valley.<br />
The baseline year assessed in this study represents the 12 month period from<br />
April 2008 to March 2009, which is be<strong>for</strong>e the new responsibilities of the<br />
Unitary Authority commenced. There<strong>for</strong>e, the assessment of baseline data in<br />
this report is based on the old local authority structure. This should be taken<br />
into consideration in the event of the use of this report in context of the new<br />
Unitary Authority structure.<br />
1.3 COUNTY DURHAM’S WASTE STRATEGY<br />
1.3.1 <strong>Strategy</strong> Development<br />
In 2001, <strong>County</strong> <strong>Durham</strong> published a Joint <strong>Municipal</strong> <strong>Waste</strong> <strong>Management</strong><br />
<strong>Strategy</strong> (JMWMS) covering the period 2001-2020. This was subsequently<br />
reviewed and the Revised JMWMS was adopted by <strong>Durham</strong> <strong>County</strong> Council<br />
in May 2008 as a framework document.<br />
The <strong>Strategy</strong> seeks to meet the recycling and recovery targets set in the<br />
(national) <strong>Waste</strong> <strong>Strategy</strong> 2000 and also makes reference to the EU Landfill<br />
Directive targets and National Indicators (NIs), which replaced Best Value<br />
Per<strong>for</strong>mance Indicators (BVPIs) in 2008/09.<br />
Key elements of the <strong>Strategy</strong> are:<br />
• Reduction in creation of waste: Promotion of waste reduction initiatives,<br />
introduction of HWRC permits and changes to waste collection methods to<br />
encourage the reduction of waste arisings.<br />
• Reuse of materials: Promotion of schemes that reuse unwanted materials,<br />
such as furniture.<br />
ENVIRONMENTAL RESOURCES MANAGEMENT DURHAM COUNTY COUNCIL<br />
3
• Recycling & composting: Promotion of recycling and composting<br />
schemes, including kerbside collections and awareness raising.<br />
• Development of secondary materials market: Commitment to collaborate<br />
with the waste industry to further develop and promote the market <strong>for</strong><br />
recycled materials.<br />
• Residual waste: Commitment to investigate options to achieve recycling<br />
and composting and Landfill Allowance Trading Scheme (LATS) targets,<br />
whilst demonstrating value <strong>for</strong> money.<br />
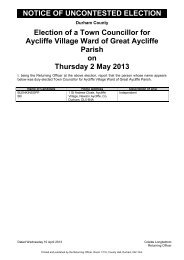
Figure 1.2 shows the relationship between the JMWMS and this baseline data<br />
assessment and other supporting documents. This report is one of a number<br />
of documents that support the headline strategy, which updates and replaces<br />
the ‘<strong>County</strong> <strong>Durham</strong> Joint <strong>Municipal</strong> <strong>Waste</strong> <strong>Management</strong> <strong>Strategy</strong>: Baseline<br />
Assessment’ report of August 2005.<br />
Figure 1.2 <strong>County</strong> <strong>Durham</strong> Joint <strong>Municipal</strong> <strong>Waste</strong> <strong>Management</strong> System and Supporting<br />
Documents<br />
Other supporting<br />
documents<br />
Baseline<br />
Assessment<br />
Note: The JMWMS is currently being reviewed, so documents may change in the future.<br />
Following the <strong>for</strong>mation of the Unitary Authority, the current strategy is being<br />
reviewed and a number of the other supporting technical reports may be<br />
updated or replaced.<br />
1.4 SCOPE OF THE DATA REVIEW<br />
<strong>Waste</strong> Prevention<br />
& Reuse<br />
DCC<br />
JMWMS<br />
Action<br />
Plans<br />
Technical Reports and Options Appraisals<br />
The objectives of this review and assessment are:<br />
Recycling<br />
& Composting<br />
Strategic Environmental<br />
Assessment<br />
Residual <strong>Waste</strong><br />
<strong>Management</strong><br />
• to collate waste arisings and material stream data <strong>for</strong> <strong>County</strong> <strong>Durham</strong><br />
including identification of trends over time;<br />
ENVIRONMENTAL RESOURCES MANAGEMENT DURHAM COUNTY COUNCIL<br />
4
• to identify the materials and composition of the various waste streams;<br />
• to outline the current waste collection services within <strong>County</strong> <strong>Durham</strong> and<br />
the fate of materials;<br />
• to present recent recycling and composting data and provide<br />
interpretation of the factors affecting rates;<br />
• to detail specific local, regional and national indicators and targets; and<br />
• to define a base year to enable further modelling studies to be projected<br />
<strong>for</strong>ward and the options of alternative collection scenarios to be appraised.<br />
It is the intention of this report to collate data and present key statistics from<br />
actual data sources linking to <strong>for</strong>mal sources of data reporting, including<br />
Defra’s <strong>Waste</strong> Data Flow.<br />
1.5 STRUCTURE OF THIS REPORT<br />
The remainder of this report comprises the following sections:<br />
Section 2: Current <strong>Waste</strong> Services and Infrastructure<br />
Section 3: <strong>Waste</strong> Arisings Data<br />
Section 4: <strong>Waste</strong> Composition and Capture Analysis<br />
Section 5: Recycling and Composting Per<strong>for</strong>mance<br />
Section 6: Current <strong>Waste</strong> Services and Infrastructure<br />
ENVIRONMENTAL RESOURCES MANAGEMENT DURHAM COUNTY COUNCIL<br />
5
ENVIRONMENTAL RESOURCES MANAGEMENT DURHAM COUNTY COUNCIL<br />
6
2 CURRENT WASTE SERVICES AND INFRASTRUCTURE<br />
2.1 HOUSEHOLD WASTE COLLECTION<br />
For the period studied in this baseline assessment report, the responsibility of<br />
waste collection in <strong>County</strong> <strong>Durham</strong> fell to the individual district WCAs. As<br />
of April 2009, this became the responsibility of <strong>Durham</strong> <strong>County</strong> Council<br />
Unitary Authority. <strong>Waste</strong> collection and re-use, recycling and composting in<br />
<strong>County</strong> <strong>Durham</strong> is currently undertaken by the following methods:<br />
• Kerbside collection of recyclable materials and residual waste;<br />
• Bring banks <strong>for</strong> a range of materials;<br />
• Household <strong>Waste</strong> Recycling Centres (HWRCs), <strong>for</strong>merly Civic Amenity<br />
Sites;<br />
• Third party re-use, recycling and composting collection; and<br />
• Commercial waste collection (on contract).<br />
2.1.1 Kerbside Collection<br />
Kerbside collection of household residual waste, recycling and green waste <strong>for</strong><br />
composting was the responsibility of the WCAs, but is now the responsibility<br />
of the Unitary Authority. Each district <strong>for</strong>merly operated its own collection<br />
service under its own arrangements. Table 2.1 shows the collection services<br />
provided by each of the seven <strong>for</strong>mer district WCAs.<br />
Table 2.1 Summary of Kerbside Material Collections<br />
Collection<br />
Authority<br />
Residual Dry Recycling (separate or co-mingled) Organics<br />
(separate<br />
or comingled)<br />
Weekly<br />
Alternate weekly<br />
Paper<br />
Cardboard<br />
Food & Beverage<br />
Cartons<br />
Chester-le-Street <br />
Derwentside <br />
<strong>Durham</strong> City <br />
Easington <br />
Sedgefield <br />
Teesdale <br />
Wear Valley <br />
Specific details of the collection services provided by each of the seven district<br />
WCAs <strong>for</strong> the baseline year are presented in Annex A.<br />
ENVIRONMENTAL RESOURCES MANAGEMENT DURHAM COUNTY COUNCIL<br />
7<br />
Plastic<br />
Glass<br />
Cans<br />
Textiles<br />
Garden waste<br />
Food waste
2.1.2 Bring Sites<br />
Household Refuse Collection<br />
The collection of household waste is carried out by <strong>Durham</strong> <strong>County</strong> Council’s<br />
in-house service.<br />
Household Recycling and Composting Collection<br />
Schemes <strong>for</strong> the collection of recyclables operate in all <strong>for</strong>mer district areas.<br />
These materials are then sorted, bulked delivered to re-processors who recycle<br />
the materials into new products. In 2008/09 four separate schemes were<br />
currently in operation in <strong>Durham</strong> <strong>County</strong>. Greencycle operated one<br />
collection scheme <strong>for</strong> four of the <strong>for</strong>mer districts (Chester le Street, <strong>Durham</strong><br />
City, Easington and Sedgefield), an alternate weekly collection was operated<br />
in Derwentside, and different schemes were also operated in Teesdale and<br />
Wear Valley.<br />
Greencycle were contracted to operate the recycling scheme in the districts of<br />
Chester-le-Street, <strong>Durham</strong> City, Easington and Sedgefield since April 2008.<br />
Prior to this, recycling in these districts was provided by Premier <strong>Waste</strong><br />
<strong>Management</strong> from its ‘Kerb-it’ scheme. The Greencycle collections ceased at<br />
the end of March 2009 when the company went into administration. These<br />
services have now been brought in house and are currently under review.<br />
The downstream management of collected materials from Teesdale and Wear<br />
Valley is contracted to Foreman Recycling Limited, a local recycling company.<br />
JMB Metals is contracted <strong>for</strong> the downstream management of materials from<br />
Derwentside.<br />
Special Collection Services<br />
Currently, there are individual arrangements with regard to special collections<br />
in each of the <strong>for</strong>mer WCA areas. These include collections <strong>for</strong> white goods,<br />
DIY rubble, clinical waste, etc.<br />
Prior to UA status, the WCAs provided several sites where recyclable<br />
materials could be brought <strong>for</strong> collection and subsequent re-processing. In<br />
total, there are 79 bring sites in <strong>County</strong> <strong>Durham</strong>, spread throughout six of the<br />
<strong>for</strong>mer seven districts. Table 2.2 shows the bring bank facilities provided in<br />
each of the districts in the <strong>County</strong> and the materials that are accepted.<br />
ENVIRONMENTAL RESOURCES MANAGEMENT DURHAM COUNTY COUNCIL<br />
8
Table 2.2 Materials Collected at Bring Sites<br />
Chester-le-<br />
Street<br />
Derwentside<br />
<strong>Durham</strong><br />
City<br />
Former district areas<br />
Easington Sedgefield Teesdale Wear<br />
Valley<br />
No. of sites 5 29 6 18 0 11 10<br />
Paper <br />
Card<br />
Cans <br />
Glass <br />
Plastic <br />
Cartons <br />
Textiles <br />
Shoes <br />
Scrap metal <br />
2.1.3 Household <strong>Waste</strong> Recycling Centres (HWRCs)<br />
There are currently fifteen HWRCs in <strong>Durham</strong> <strong>County</strong>, operated by the<br />
<strong>County</strong> Council’s waste contractor Premier <strong>Waste</strong> <strong>Management</strong>, who<br />
subcontracts these to operatives. These receive household residual waste,<br />
various types of recyclable waste and green waste <strong>for</strong> composting but they are<br />
not licensed to receive wastes from commercial properties. In order to limit<br />
the illegal depositing of commercial waste at HWRCs, a permit is required to<br />
visit an HWRC in a van, trailer or pick-up, under the <strong>Waste</strong> Permit Scheme (1)<br />
introduced in 2004/5.<br />
Table 2.3 lists the names of the HWRCs across the county and the materials<br />
accepted, Figure 2.1 shows the locations.<br />
(1) http://www.durham.gov.uk/Pages/Service.aspx?ServiceId=6266<br />
ENVIRONMENTAL RESOURCES MANAGEMENT DURHAM COUNTY COUNCIL<br />
9
Table 2.3 Materials Accepted at HWRC<br />
Former District Name of HWRC<br />
Soil &<br />
rubble<br />
Green waste<br />
Wood<br />
Scrap metal<br />
Gas bottles<br />
<strong>Waste</strong> oil<br />
Car<br />
batteries<br />
Tyres<br />
Household<br />
batteries<br />
TVs &<br />
monitors<br />
Chester-le-Street Hett Hills <br />
Derwentside<br />
<strong>Durham</strong> City<br />
Easington<br />
Sedgefield<br />
Teesdale<br />
Wear Valley<br />
Annfield Plain <br />
Brooms Dene <br />
Coxhoe <br />
Potterhouse <br />
Horden <br />
Seaham <br />
Thornley <br />
Heighington Lane <br />
Tudhoe <br />
Cragwood <br />
Middleton <br />
Stainton Grove <br />
Romanway <br />
Todhill (Scoby<br />
Scaur<br />
Fridges<br />
Fluorescent<br />
tube lights<br />
<br />
Cardboard<br />
Cans<br />
Glass<br />
Paper<br />
Textiles<br />
Shoes<br />
Nonrecyclables
KEY:<br />
HWRC<br />
<strong>Durham</strong> <strong>County</strong> Boundary<br />
Former District Boundaries<br />
Delivery Area<br />
Wear Valley<br />
Middleton<br />
Teesdale<br />
Stanley<br />
!<br />
Consett Broomsdene<br />
!<br />
Hett Hills<br />
!<br />
Annfield Plain<br />
Chester-le-Street<br />
Chester-le-Street<br />
Derwentside<br />
Stainton Grove<br />
! Barnard Castle<br />
.<br />
0 10<br />
Kilometres<br />
! Crook<br />
Cragwood<br />
Potterhouse Lane<br />
! <strong>Durham</strong><br />
<strong>Durham</strong> City<br />
Tudhoe<br />
Todhills (Scoby ! Scaur)<br />
! Bishop Auckland<br />
Romanway<br />
Coxhoe<br />
Sedgefield<br />
! Newton Aycliffe<br />
Heighington Lane<br />
Easington !<br />
Peterlee<br />
! Sedgefield<br />
! Seaham<br />
Thornley Station<br />
CLIENT: SIZE: TITLE:<br />
Horden<br />
<strong>Durham</strong> <strong>County</strong> Council A4 Figure 2.1<br />
<strong>Durham</strong> <strong>County</strong> Council<br />
ERM<br />
Norloch House<br />
36 King's Stables Road<br />
Edinburgh, EH1 2EU<br />
Tel: 0131 478 6000<br />
Fax: 0131 656 5813<br />
SOURCE: Reproduced from Ordnance Survey digital map data. © Crown<br />
copyright, All rights reserved. 2009 License number 0100031673.<br />
PROJECTION: British National Grid<br />
Location of HWRC<br />
DATE: 20/11/2009 CHECKED: PB<br />
PROJECT: 0103952<br />
DRAWN: JJH APPROVED:PF SCALE: 1:400,000<br />
DRAWING: REV:<br />
LocationOfHWRC.mxd 0<br />
File: 0103952<strong>Durham</strong><strong>Waste</strong>_JH_SS\MAPS\LocationOfHWRC.mxd
2.1.4 Third Party Recycling and Composting Collection<br />
In addition to kerbside collections, HWRCs and bring sites, third party<br />
contractors collect recyclables and materials <strong>for</strong> re-use throughout the county.<br />
The vast majority of materials collected by third parties are textiles, green<br />
waste and paper. For the most part, these organisations are charities or not<strong>for</strong>-profit<br />
organisations and the same organisations operate throughout the<br />
county. The key contractors that collect the most significant quantities of<br />
recyclables are listed in Table 2.4 below.<br />
Table 2.4 Third Party Collection Organisations<br />
Name of contractor Materials collected<br />
TCV Green waste<br />
Eventex Textiles<br />
Riverdale paper Paper<br />
World UK Trading Textiles<br />
Colltex Ltd Textiles<br />
2.2 NON-HOUSEHOLD WASTE COLLECTIONS<br />
2.2.1 Commercial <strong>Waste</strong> Collection<br />
2.2.2 Fly Tipping<br />
A number of the <strong>for</strong>mer WCAs operated a service to collect waste from a<br />
number of trade properties. Unlike the service provided to domestic<br />
properties, this is undertaken under contract and a fee is charged. <strong>Durham</strong><br />
<strong>County</strong> Council continues to operate this service in five of the <strong>for</strong>mer district<br />
areas.<br />
<strong>Durham</strong> <strong>County</strong> Council operates a fly tipping collection service. A<br />
householder is able to call the Council and report where the fly tipped<br />
material is and what it comprises. The Council will aim to pick up and<br />
dispose of this waste within 24 hours.<br />
2.3 TRANSFER, TREATMENT AND DISPOSAL OF WASTE<br />
Figure 2.2 shows the locations of the transfer, treatment and disposal facilities<br />
in <strong>County</strong> <strong>Durham</strong>.<br />
Currently the following waste transfer, treatment and disposal options are<br />
utilised <strong>for</strong> the processing of waste materials collected in the <strong>County</strong>.<br />
• Transfer stations;<br />
• MRFs – in <strong>County</strong> <strong>Durham</strong>;<br />
• MRFs – outside of <strong>County</strong> <strong>Durham</strong>;<br />
• Open windrow composting;<br />
ENVIRONMENTAL RESOURCES MANAGEMENT DURHAM COUNTY COUNCIL<br />
12
• Aerobic digestion;<br />
• Landfill – in <strong>County</strong> <strong>Durham</strong>; and<br />
• Landfill – outside of <strong>County</strong> <strong>Durham</strong>.<br />
2.3.1 Transfer Stations<br />
<strong>Durham</strong> <strong>County</strong> Council currently uses four waste transfer stations, located at<br />
Annfield Plain, Heighington Lane, Stainton Grove and Thornley, as shown in<br />
Figure 2.2. All four transfer stations are operated by Premier <strong>Waste</strong><br />
<strong>Management</strong>. The transfer stations are used <strong>for</strong> the bulking of the waste<br />
prior to further transport to processing or disposal facilities.<br />
At present, Annfield Plain, Heighington Lane and Stainton Grove accept<br />
residual waste from WCA collections and HWRCs, which is <strong>for</strong>warded onto<br />
landfill at Joint Stocks or Blaydon. At Thornley, some of the residual waste<br />
received is sorted <strong>for</strong> aerobic digestion (see Section 2.4.2 below). However, in<br />
the baseline year of 2008/09, the aerobic digester was not operational because<br />
it could not meet regulatory requirements and there<strong>for</strong>e all waste delivered to<br />
Thornley was landfilled.<br />
2.3.2 <strong>Management</strong> of Dry Recyclables<br />
Recyclables collected from the kerbside by Greencycle from the districts of<br />
Chester-le-Street, <strong>Durham</strong> City, Easington and Sedgefield were brought to<br />
Greencycles own facility at Tursdale be<strong>for</strong>e onward transfer to re-processors.<br />
For 2009/10 the service has been brought in-house and materials are currently<br />
delivered to 3 MRFs.<br />
Recyclables collected from the other <strong>for</strong>mer districts of Derwentside, Teesdale<br />
and Wear Valley were (and are currently) not brought to any of the <strong>County</strong><br />
Council’s transfer stations but were instead delivered to materials recycling<br />
facilities (MRFs) operated by third parties. Materials collected in Teesdale<br />
and Wear Valley were delivered to the MRF in Spenneymoor, operated by<br />
Foreman Recycling Limited. Materials collected from Derwentside were<br />
delivered to a variety of MRFs during 2008/9. At the MRFs, the recyclable<br />
materials are sorted and graded prior to onward movement to reprocessors.<br />
2.3.3 <strong>Management</strong> of Residual <strong>Waste</strong><br />
Residual household waste from WCA kerbside collections is delivered <strong>for</strong><br />
disposal at Joint Stocks Landfill Site or Blaydon Landfill Site. A portion of<br />
the waste is delivered directly by the refuse collection vehicles to the landfill<br />
whilst the remainder goes via one of the four waste transfer facilities.<br />
Occasionally residual waste goes to other landfill sites when local sites are<br />
closed due to inclement weather or when commercially advantageous.<br />
ENVIRONMENTAL RESOURCES MANAGEMENT DURHAM COUNTY COUNCIL<br />
13
KEY:<br />
w/<br />
x/ Landfills<br />
v/<br />
Aerobic Digestion Plant<br />
Open Windrow Composting Facility<br />
<strong>Waste</strong> Transfer Sites<br />
Wear Valley<br />
Teesdale<br />
v/<br />
Consett<br />
!<br />
Derwentside<br />
!<br />
Barnard Castle<br />
<strong>Durham</strong> <strong>County</strong> Boundary<br />
Former District Boundaries<br />
.<br />
Delivery Area<br />
0 10<br />
Kilometres<br />
x/ Blaydon Landfill<br />
v/<br />
! Crook<br />
! Stanley<br />
! Chester-le-Street<br />
Chester-le-Street<br />
! <strong>Durham</strong><br />
<strong>Durham</strong> City<br />
! Spennymoor<br />
! Bishop Auckland<br />
v/<br />
x/v/<br />
Sedgefield<br />
! Newton Aycliffe<br />
v/ w/<br />
! Sedgefield<br />
! Seaham<br />
Peterlee<br />
!<br />
Easington<br />
Joint Stocks Landfill<br />
CLIENT: SIZE: TITLE:<br />
<strong>Durham</strong> <strong>County</strong> Council A4 Figure 2.2<br />
<strong>Durham</strong> <strong>County</strong> Council<br />
ERM<br />
Norloch House<br />
36 King's Stables Road<br />
Edinburgh, EH1 2EU<br />
Tel: 0131 478 6000<br />
Fax: 0131 656 5813<br />
SOURCE: Reproduced from Ordnance Survey digital map data. © Crown<br />
copyright, All rights reserved. 2009 License number 0100031673.<br />
PROJECTION: British National Grid<br />
<strong>Waste</strong> <strong>Management</strong> Facilities<br />
DATE: 20/11/2009 CHECKED: PB<br />
PROJECT: 0103952<br />
DRAWN: JJH APPROVED:PF SCALE: 1:400,000<br />
DRAWING: REV:<br />
<strong>Waste</strong><strong>Management</strong>Facilities.mxd 0<br />
File: 0103952<strong>Durham</strong><strong>Waste</strong>_JH_SS\MAPS\<strong>Waste</strong><strong>Management</strong>Facilities.mxd
2.4 TREATMENT OPTIONS<br />
2.4.1 Open Windrow Composting<br />
There is an open windrow composting facility at Coxhoe in <strong>Durham</strong> City, as<br />
shown in Figure 2.2, which is operated by Premier <strong>Waste</strong> <strong>Management</strong>. The<br />
facility is used to compost green wastes from kerbside and third party<br />
collections and from bring sites. The resulting compost is sold commercially<br />
as a soil conditioner and is also either used on-site or at other landfills <strong>for</strong><br />
restoration purposes.<br />
2.4.2 Aerobic Digestion<br />
2.5 DISPOSAL<br />
2.5.1 Landfill<br />
An aerobic digestion facility (known as the Digester) is located at Thornley in<br />
Easington, as shown in Figure 2.2. The Digester is operated by Premier <strong>Waste</strong><br />
<strong>Management</strong> and has a maximum capacity of 55,000 tonnes of waste per<br />
annum. This facility is designed to recycle and convert into compost<br />
approximately 50-60% of the through put.<br />
The Digester accelerates the composting of mixed municipal waste such that<br />
approximately six days after delivery, all biodegradable material has been<br />
converted to a ‘soil conditioner’ often referred to as a ‘compost like output’<br />
(CLO). Materials such as metals, glass and plastics, are mechanically sorted<br />
from the output of the digestion process and <strong>for</strong>warded onto reprocessers.<br />
The detailed input and output data <strong>for</strong> the Digester are presented in Annex D.<br />
Limited outlets have been found <strong>for</strong> the organic digestate and it is primarily<br />
used as restoration materials at landfill sites. <strong>Durham</strong> <strong>County</strong> Council and<br />
Premier <strong>Waste</strong> <strong>Management</strong> are working together to investigate alternative<br />
outlets <strong>for</strong> this output.<br />
The Digester was decommissioned in early 2008, because it could not meet<br />
regulatory requirements, and it operated to a limited capacity <strong>for</strong> the 12<br />
months prior to this. <strong>Durham</strong> <strong>County</strong> Council expects these issues to be<br />
resolved at some stage but it is not clear when the Digester will resume<br />
operations.<br />
Premier <strong>Waste</strong> <strong>Management</strong> currently operates one landfill site in <strong>County</strong><br />
<strong>Durham</strong> at Joint Stocks, Coxhoe in <strong>Durham</strong> City and one landfill out of<br />
<strong>County</strong> at Blaydon, as shown in Figure 2.2. This landfill has a throughput of<br />
around 300,000 tonnes of residual waste per year. As of August 2009, the<br />
landfill site had a remaining capacity of 2,400,000 m 3.<br />
Currently, the bulk of the residual waste received at Joint Stocks is from<br />
kerbside collections or from the fifteen HWRCs located in the <strong>County</strong>. In<br />
ENVIRONMENTAL RESOURCES MANAGEMENT DURHAM COUNTY COUNCIL<br />
15
addition, residue from the aerobic digestion process is also received at Joint<br />
Stocks <strong>for</strong> landfill.<br />
ENVIRONMENTAL RESOURCES MANAGEMENT DURHAM COUNTY COUNCIL<br />
16
3 WASTE ARISINGS DATA<br />
3.1 MUNICIPAL SOLID WASTE ARISINGS<br />
This section presents <strong>County</strong> <strong>Durham</strong>’s municipal solid waste (MSW) arisings<br />
<strong>for</strong> 2008/09 and compares this with historical arisings since 2004/05. The<br />
waste arising data are presented as totals <strong>for</strong> the county as well as being<br />
broken down to identify specific trends by district, collection method and<br />
management route.<br />
Figure 3.1 shows the total municipal waste arisings in <strong>County</strong> <strong>Durham</strong> from<br />
2004/05 to the baseline year of 2008/09 and Figure 3.2 provides a breakdown<br />
by district. The detailed data <strong>for</strong> the last three years are presented in Annex<br />
B.<br />
The graphs show that total municipal waste arisings have decreased in the<br />
five year period across all seven districts. The most significant decrease in<br />
municipal waste arisings occurred between 2004/05 and 2005/06. This<br />
corresponds to the implementation of the <strong>Waste</strong> Permit Scheme (see Section<br />
2.1.3) which restricted the disposal of commercial waste at HWRCs. The<br />
impact of the <strong>Waste</strong> Permit Scheme on waste arisings is discussed in further<br />
detail in Section 3.2.5.<br />
Figure 3.1 Total MSW in <strong>Durham</strong> <strong>County</strong>: 2004/05 to 2008/09<br />
Tonnes<br />
340,000<br />
330,000<br />
320,000<br />
310,000<br />
300,000<br />
290,000<br />
280,000<br />
270,000<br />
260,000<br />
250,000<br />
2004/05 2005/06 2006/07 2007/08 2008/09<br />
Figure 3.2 shows that total MSW arisings are generally proportional to<br />
population within the districts. As shown in Figure 1.1, the district with the<br />
lowest population is Teesdale, which has the lowest waste arisings and the<br />
district with the highest population is Easington, which has the highest waste<br />
arisings.<br />
ENVIRONMENTAL RESOURCES MANAGEMENT DURHAM COUNTY COUNCIL<br />
17<br />
`
Figure 3.2 Total MSW in <strong>Durham</strong> <strong>County</strong> by District: 2004/05 to 2008/09<br />
Total municipal waste arisings (tonnes)<br />
Figure 3.3 provides a breakdown of municipal waste arisings <strong>for</strong> the baseline<br />
year of 2008/09 which shows the proportion of each of the waste collection<br />
streams in <strong>County</strong> <strong>Durham</strong>.<br />
Figure 3.3 Breakdown of <strong>Municipal</strong> <strong>Waste</strong> Arisings: 2008/09<br />
Tonnes<br />
100,000<br />
90,000<br />
80,000<br />
70,000<br />
60,000<br />
50,000<br />
40,000<br />
30,000<br />
20,000<br />
10,000<br />
0<br />
160,000<br />
140,000<br />
120,000<br />
100,000<br />
80,000<br />
60,000<br />
40,000<br />
20,000<br />
0<br />
2004/05 2005/06 2006/07 2007/08 2008/09<br />
3.1.1 Breakdown of <strong>Municipal</strong> <strong>Waste</strong> Arisings<br />
Kerbside residual<br />
Kerbside recycling<br />
Kerbside composting<br />
Third party recycling<br />
Third party composting<br />
Chester-le-Street<br />
<strong>Durham</strong> City<br />
Derwentside<br />
Easington<br />
Sedgefield<br />
Teesdale<br />
Wear Valley<br />
HWRC<br />
The total MSW arisings in <strong>County</strong> <strong>Durham</strong> from 2004/05 up to the baseline<br />
year of 2008/09 are presented in Table 3.1. The table provides a breakdown<br />
ENVIRONMENTAL RESOURCES MANAGEMENT DURHAM COUNTY COUNCIL<br />
18<br />
Bring sites recycling<br />
HWRC residual<br />
HWRC recycling<br />
HWRC composting<br />
Trade<br />
Fly-tip
of the total MSW based on how it is collected and managed. The following<br />
points are evident based on the data <strong>for</strong> the five years in the table:<br />
• Total MSW arisings have decreased from approximately 330,000 tonnes in<br />
2004/05 to approximately 280,000 tonnes in the baseline year of 2008/09.<br />
The most significant drop was between 2004/05 and 2005/06 when total<br />
MSW arisings decreased by over 10%. This drop was mainly due to a<br />
substantial reduction in the amount of waste delivered to HWRCs and<br />
coincided with the introduction of a permit scheme which restricts the<br />
depositing of commercial waste at HWRCs.<br />
• Kerbside collection of waste is the most significant method of waste<br />
collection, accounting <strong>for</strong> around 70% of total MSW over the five year<br />
period.<br />
• Total recycling and composting in <strong>County</strong> <strong>Durham</strong> has increased from<br />
19% of MSW arisings in 2004/05 to 31% in 2008/09.<br />
Table 3.1 Breakdown of <strong>Municipal</strong> <strong>Waste</strong> Arisings in <strong>County</strong> <strong>Durham</strong>: 2004/05 to<br />
2008/09<br />
2004/05 2005/06 2006/07 2007/08 2008/09<br />
HOUSEHOLD<br />
Kerbside<br />
Residual 200,745 186,995 180,519 164,864 151,245<br />
Recycling 20,716 24,954 25,276 38,064 45,087<br />
Green (composting) 597 3,754 4,001 4,107 9,786<br />
Bulky 3,130 3,214 2,990 4,169<br />
Sub-total<br />
Third party<br />
225,188 218,917 212,786 211,204 206,119<br />
Recycling 1,291 1,631 1,517 1,701 1,839<br />
Green (composting) 287 1,070 977 1,155 1,998<br />
Sub-total<br />
Bring sites<br />
1,577 2,701 2,494 2,856 3,837<br />
Recycling<br />
HWRCs<br />
2,430 2,238 2,512 2,791 1,780<br />
Residual 41,361 28,406 31,524 31,524 29,251<br />
Recycling 36,254 25,203 24,218 22,118 23,724<br />
Green (composting) 10,635 8,249 8,330 8,596 9,122<br />
Sub-total<br />
NON-HOUSEHOLD<br />
Trade waste<br />
88,250 61,858 64,072 62,238 62,096<br />
Residual<br />
Fly-tip<br />
8,086 8,328 8,328 8,184 7,867<br />
Residual 8,370 6,103 5,467 5,066 4,986<br />
TOTAL 333,901 300,145 295,659 290,212 281,068<br />
ENVIRONMENTAL RESOURCES MANAGEMENT DURHAM COUNTY COUNCIL<br />
19
3.2 HOUSEHOLD WASTE<br />
Household waste <strong>for</strong>ms by far the most significant proportion of municipal<br />
waste in <strong>Durham</strong> <strong>County</strong>, accounting <strong>for</strong> approximately 95% of total waste<br />
arisings between 2004/05 and 2008/09.<br />
As described in Section 2.1, household waste in <strong>County</strong> <strong>Durham</strong> is collected by<br />
the following means:<br />
• Kerbside collections of dry recyclables and residual waste;<br />
• HWRCs;<br />
• Bring sites; and<br />
• Third party collections.<br />
The following sections present the waste arisings from each of the above<br />
collection methods in more detail.<br />
3.2.1 Kerbside collection<br />
Table 3.2 provides a breakdown of the municipal waste collected by WCA<br />
managed kerbside collections between 2004/05 and 2008/09.<br />
Section 2.1.1 provides further detail on the kerbside collection services offered,<br />
to which this data refers.<br />
Table 3.2 Breakdown of Kerbside Collected <strong>Waste</strong>: 2004/05 to 2008/09<br />
<strong>Waste</strong> Type 2004/05 2005/06 2006/07 2007/08 2008/09<br />
Residual 200,745 186,995 180,519 164, 864 151,245<br />
Recycling 20,716 24,954 25,276 38,064 45,087<br />
Composting 597 3,754 4,001 4,107 9,786<br />
Bulky 3,130 3,214 2,990 4,169 *<br />
TOTAL 225,188 218,917 212,786 211,204 206,119<br />
* Bulky waste figures were not provided separately from kerbside residual/recycling in the<br />
baseline year<br />
The following conclusions may be drawn from Table 3.2.<br />
• Residual waste makes up the most significant proportion of waste<br />
collected from the kerbside although this is steadily decreasing, whilst<br />
recycling and composting is increasing.<br />
• Kerbside recycling has increased steadily up to 2008/09, with an increase<br />
of over a 50% from the 2004/05 figure. This corresponds with increases<br />
in the range of materials collected at the kerbside over the five year period.<br />
A description of how the kerbside recyclables collection services have<br />
evolved in each of the seven districts is provided in Section 2.1.1.<br />
ENVIRONMENTAL RESOURCES MANAGEMENT DURHAM COUNTY COUNCIL<br />
20
Figure 3.4 Breakdown of Kerbside Collected Dry Recycling: 2004/05 to 2008/09<br />
Tonnes<br />
The following chart shows the mix of dry recyclable materials collected at the<br />
kerbside in 2008/9. This is the total <strong>for</strong> the <strong>County</strong>. Paper and card make<br />
up by far the largest proportion of materials collected, comprising 58% of the<br />
total weight of dry recyclables collected. Glass is the next highest proportion,<br />
comprising 24% of the total.<br />
Figure 3.5 Breakdown of Kerbside Collected Materials by Weight (2008/09)<br />
Tonnes<br />
25,000<br />
20,000<br />
15,000<br />
10,000<br />
5,000<br />
3.2.2 Third Party Collection<br />
0<br />
30,000<br />
25,000<br />
20,000<br />
15,000<br />
10,000<br />
5,000<br />
0<br />
2004/05 2005/06 2006/07 2007/08 2008/09<br />
paper &<br />
card<br />
cans plastic glass textiles scrap<br />
metal<br />
white<br />
goods<br />
Paper & Card<br />
Figure 3.6 shows the amount of municipal waste collected by third parties<br />
between 2004/05 and 2008/09. The waste collected by third parties<br />
comprises recyclables or compostable material, which is subsequently<br />
<strong>for</strong>warded onto re-processers.<br />
ENVIRONMENTAL RESOURCES MANAGEMENT DURHAM COUNTY COUNCIL<br />
21<br />
Glass<br />
Metals<br />
Textiles<br />
Green<br />
Plastic<br />
other
Section 2.1.4 provides further detail on third party collections, to which this<br />
data refers.<br />
Figure 3.6 Third Party Collections (2004/05 - 2008/09)<br />
Tonnes<br />
4,500<br />
4,000<br />
3,500<br />
3,000<br />
2,500<br />
2,000<br />
1,500<br />
1,000<br />
500<br />
3.2.3 Bring Sites<br />
0<br />
2004/05 2005/06 2006/07 2007/08 2008/09<br />
The chart above shows that third party collection is not a significant collection<br />
method in <strong>Durham</strong> <strong>County</strong>, however it has increased over the past 5 years.<br />
The waste collected at bring sites is comprised purely of recyclables, which are<br />
subsequently <strong>for</strong>warded onto re-processers. Section 2.1.2 provides further<br />
detail on bring sites. Figure 3.7 shows the 5 year trend in bring site tonnages.<br />
Figure 3.7 Total Bring Site Recycling (2004/05 - 2008/09)<br />
Tonnes<br />
3,000<br />
2,500<br />
2,000<br />
1,500<br />
1,000<br />
500<br />
0<br />
Third party recycling Third party composting<br />
2004/05 2005/06 2006/07 2007/08 2008/09<br />
ENVIRONMENTAL RESOURCES MANAGEMENT DURHAM COUNTY COUNCIL<br />
22
Figure 3.8 Breakdown of Bring Site Material Recycling (2004/05 - 2008/09)<br />
Tonnes<br />
1,800<br />
1,600<br />
1,400<br />
1,200<br />
1,000<br />
800<br />
600<br />
400<br />
200<br />
0<br />
2004/05 2005/06 2006/07 2007/08 2008/09<br />
Paper/ Card Mixed<br />
Collection from bring sites does not account <strong>for</strong> a significant proportion of<br />
waste in <strong>County</strong> <strong>Durham</strong>. Indeed, the proportion of waste collected from<br />
bring sites has decreased over the last five years. This could be a result of<br />
enhanced kerbside recyclables collections over the same time period. There<br />
are a number of ‘peaks’ in recycling of particular materials at bring sites over<br />
the five year period. As tonnages collected are so small, these peaks are not<br />
as extreme as it may appear.<br />
Figure 3.9 presents a more detailed breakdown of the materials collected from<br />
brings sites during the baseline year of 2008/09. This shows that glass<br />
dominates the materials collected at the bring banks in most areas. Paper is<br />
more prevalent in Chester le Street and Derwentside. Textiles are recycled in<br />
notable amounts in Wear Valley, Derwentside and <strong>Durham</strong> City.<br />
ENVIRONMENTAL RESOURCES MANAGEMENT DURHAM COUNTY COUNCIL<br />
23<br />
Glass<br />
Cans<br />
Textiles<br />
Plastic<br />
Shoes
Figure 3.9 Breakdown of Recyclable Materials Collected at Bring Sites: 2008/09<br />
Tonnes<br />
300<br />
250<br />
200<br />
150<br />
100<br />
3.2.4 Dry Recycling - Summary<br />
50<br />
3.2.5 HWRCs<br />
0<br />
Chester-le-Street<br />
Derwentside<br />
<strong>Durham</strong> City<br />
Easington<br />
Sedgefield<br />
Teesdale<br />
Wear Valley<br />
Dry recycling is collected via kerbside collections, third party collections,<br />
bring sites and HWRCs (these are dealt with in the following section).<br />
Further detail on the types of materials collected via each route is provided in<br />
Section 2.1. The following is evident from the data presented above<br />
regarding the splits of waste collections:<br />
• Paper and card were recycled in the greatest quantities over the studied<br />
time period, accounting <strong>for</strong> more than twice the amount of glass, which<br />
was collected in the second greatest quantities. The amount collected<br />
increased relatively steadily between 2004/05 and 2008/09.<br />
• The collection of glass has also increased relatively steadily between<br />
2004/05 and 2008/09.<br />
paper & card<br />
• Paper/ card and glass account <strong>for</strong> at least 90% of the combined kerbside<br />
and bring site collected recycling between 2004/05 and 2006/07, and 86%<br />
and 68% <strong>for</strong> 2007/08 and 2008/09 respectively.<br />
• The tonnages of plastics have been relatively small between 2004/05 and<br />
2006/07 but showed a significant increase between 2007/08 and 2008/09.<br />
Table 3.3 shows the tonnage of municipal waste collected at HWRCs between<br />
2004/05 and 2008/09. Figure 3.10 shows the trend over this five year period.<br />
Section 2.1.3 provides further detail on HWRCs, to which this data refers.<br />
ENVIRONMENTAL RESOURCES MANAGEMENT DURHAM COUNTY COUNCIL<br />
24<br />
cans<br />
plastic<br />
glass<br />
textiles<br />
shoes<br />
cartons<br />
scrap metal
Table 3.3 Breakdown of HWRC Collected <strong>Waste</strong>: 2004/05 to 2008/09<br />
Material / year 2004/05 2005/06 2006/07 2007/08 2008/09<br />
Residual 41,361 28,406 31,524 31,524 29,251<br />
Recycling 36,254 25,203 24,218 22,118 23,724<br />
Green (composting) 10,635 8,249 8,330 8,596 9,122<br />
TOTAL 88,250 61,858 64,072 62,238 62,097<br />
Figure 3.10 HWRC Collected <strong>Waste</strong> Arisings: 2004/05 to 2008/09<br />
HWRC waste arisings (tonnes)<br />
100,000<br />
90,000<br />
80,000<br />
70,000<br />
60,000<br />
50,000<br />
40,000<br />
30,000<br />
20,000<br />
10,000<br />
0<br />
2004/05 2005/06 2006/07 2007/08 2008/09<br />
Residual to<br />
landfill<br />
Recycling<br />
Composting<br />
TOTAL<br />
Total waste collected at HWRCs decreased dramatically between 2004/05 and<br />
2005/06. This corresponds to the introduction of the <strong>Waste</strong> Permit Scheme<br />
(see Section 2.1.3) which restricts the depositing of commercial waste at<br />
HWRCs. With the implementation of the scheme, commercial waste was no<br />
longer deposited at HWRCs, which explains the sharp drop in tonnage.<br />
Following this, the tonnage remained relatively constant up to 2008/09. The<br />
combined recycling and composting rate is fairly constant over the time<br />
period too, and is currently at 53%. This includes re-use/recycling of soil<br />
and rubble, which are not classified as household waste and which there<strong>for</strong>e<br />
do not count towards the household recycling rates <strong>for</strong> NIs and BVPIs. If this<br />
tonnage is excluded from the recycling and composting calculations then the<br />
household recycling rate across the HWRCs reduces to 30%. The following<br />
chart shows the difference that including or excluding the inert waste<br />
recycling makes.<br />
ENVIRONMENTAL RESOURCES MANAGEMENT DURHAM COUNTY COUNCIL<br />
25
Figure 3.11 2008/9 HWRC Tonnages - Total, R&C and R&C not including Inerts<br />
Tonnes<br />
8000<br />
7000<br />
6000<br />
5000<br />
4000<br />
3000<br />
2000<br />
1000<br />
0<br />
Annfield Plain<br />
Coxhoe<br />
Heighington<br />
Horden<br />
Breakdown of HWRC <strong>Waste</strong><br />
Potterhouse<br />
Romanway<br />
Seaham<br />
Thornley<br />
Todhills<br />
Tudhoe<br />
Broomsdene<br />
Total R&C R&C (no Inert)<br />
Cragwood<br />
Hett Hills<br />
Middleton<br />
Stainton Grove<br />
<strong>Waste</strong> collected at HWRCs can be broadly categorised into residual waste, dry<br />
recycling and composting. A detailed breakdown of the composition of<br />
waste collected at each of the fifteen HWRCs in the <strong>County</strong> between 2004/05<br />
and 2008/09 is provided in Annex C. Summary data <strong>for</strong> 2008/09 is presented<br />
in Table 3.4.<br />
From the HWRCs, waste is <strong>for</strong>warded to re-processors <strong>for</strong> recycling, sent<br />
directly to landfill, sent to landfill via a transfer station, or sent to aerobic<br />
digestion via a transfer station. Further detail on the collection and<br />
management of waste at HWRCs is provided in Section 2.1.3.<br />
ENVIRONMENTAL RESOURCES MANAGEMENT DURHAM COUNTY COUNCIL<br />
26
Table 3.4 Materials Collected at all HWRCs: 2008/09<br />
Material Type Tonnes<br />
Large WEEE 201<br />
Small WEEE 319<br />
Heavy steel 105<br />
Light steel 1,498<br />
Lead 4<br />
Brass 15<br />
Copper 35<br />
Stainless steel 12<br />
Aluminium 47<br />
Cardboard 1,110<br />
Batteries 16<br />
Cans 20<br />
Gas Bottles 25<br />
Glass 215<br />
Paper 406<br />
TVs & Monitors 588<br />
Oil 84<br />
Fridges 327<br />
Textiles 147<br />
Shoes 21<br />
Fluorescent tubes 4<br />
Bric-a-brac 166<br />
Tyres 290<br />
Cartons 2<br />
Bikes 1<br />
Green waste 9,122<br />
Timber 3,661<br />
Soil & rubble 14,406<br />
Total Recycled 32,846<br />
Residual to landfill 29,251<br />
Total Tonnage 62,097<br />
• Soil and rubble is the most abundant recyclable collected at HWRCs,<br />
accounting <strong>for</strong> at least 45% of total recycling between 2004/05 and<br />
2008/09.<br />
• ‘Other recycling’, comprising materials such as paper, cans and glass<br />
which are also collected at the kerbside, has decreased steadily since<br />
2004/05.<br />
ENVIRONMENTAL RESOURCES MANAGEMENT DURHAM COUNTY COUNCIL<br />
27
Table 3.5 HWRC Throughput by District in 2008/9<br />
Former district Site Tonnage<br />
Derwentside<br />
Annsfield Plain<br />
Brooms Dene<br />
4,496<br />
5,991<br />
Chester-le-Street Hett Hills 7,501<br />
<strong>Durham</strong> City<br />
Coxhoe<br />
Potterhouse<br />
4,227<br />
6,846<br />
Horden 3,318<br />
Easington<br />
Seaham 4,574<br />
Thornley 2,966<br />
Cragwood 1,976<br />
Teesdale<br />
Middleton 684<br />
Stainton Grove 1,371<br />
Sedgefield<br />
HLTS<br />
Tudhoe<br />
4,444<br />
4,648<br />
Wear Valley<br />
Todhills<br />
Romanway<br />
4,120<br />
4,852<br />
Figure 3.12 shows the variation in site recycling rate <strong>for</strong> individual sites. The<br />
smaller sites at Middleton, Stainton Grove and Cragwood all have the lowest<br />
recycling rates. This is due to lack of space on site and not having the ability<br />
to offer sufficient receptacles to allow separate collection of the range of<br />
different materials. These sites operate primarily as a collection point <strong>for</strong><br />
general refuse.<br />
The majority of sites recycle between 50% and 70% of the material received,<br />
hence the high average recycling and composting rate of 53% <strong>for</strong> all sites.<br />
However, two large sites (looking at throughput, not size), Brooms Dene and<br />
Hett Hills have a recycling rate of only 30 - 40%. Recycling rates seem to<br />
have increased across the board from 2007/08 to 2008/09.<br />
Figure 3.13 shows that the tonnage accepted at Romanway HWRC dropped<br />
away in 2007/8 due to the site being closed <strong>for</strong> a number of months. A<br />
corresponding peak at other sites suggests that people used alternative sites<br />
whilst Romanway was out of commission.<br />
ENVIRONMENTAL RESOURCES MANAGEMENT DURHAM COUNTY COUNCIL<br />
28
Figure 3.12 HWRC Recycling Rates by Site (2004/5 – 2008/9)<br />
Recycling Rate (%)<br />
Figure 3.13 Total Throughput at HWRCs 2004/5 - 2008/9<br />
Tonnes per annum<br />
100%<br />
90%<br />
80%<br />
70%<br />
60%<br />
50%<br />
40%<br />
30%<br />
20%<br />
10%<br />
0%<br />
10,000<br />
9,000<br />
8,000<br />
7,000<br />
6,000<br />
5,000<br />
4,000<br />
3,000<br />
2,000<br />
1,000<br />
3.3 NON-HOUSEHOLD WASTE<br />
0<br />
2004-5 2005-6 2006-7 2007-8 2008-9<br />
2004-5 2005-6 2006-7 2007-8 2008-9<br />
Table 3.6 shows the amounts of non-household waste collected in <strong>County</strong><br />
<strong>Durham</strong> between 2004/05 and 2008/09.<br />
Table 3.6 Non-household <strong>Waste</strong> Arisings in <strong>Durham</strong> <strong>County</strong>: 2004/05 to 2008/09<br />
Annfield Plain<br />
Coxhoe<br />
Heighington<br />
Horden<br />
Potterhouse<br />
Romanway<br />
Seaham<br />
Thornley<br />
Todhills<br />
Tudhoe<br />
Broomsdene<br />
Cragwood<br />
Hett Hills<br />
Middleton<br />
Stainton Grove<br />
Annfield Plain<br />
Coxhoe<br />
Heighington<br />
Horden<br />
Potterhouse<br />
Romanw ay<br />
Seaham<br />
Thornley<br />
Todhills<br />
Tudhoe<br />
Broomsdene<br />
Cragw ood<br />
Hett Hills<br />
Middleton<br />
Stainton Grove<br />
<strong>Waste</strong> Source 2004/05 2005/06 2006/07 2007/08 2008/09<br />
Trade 8,086 8,328 8,328 8,184 7,867<br />
Fly-tip 8,370 6,103 5,467 5,066 4,986<br />
TOTAL 16,456 14,431 13,795 13,250 12,853<br />
% of TOTAL MSW 4.93% 4.83% 4.65% 4.61% 4.57%<br />
ENVIRONMENTAL RESOURCES MANAGEMENT DURHAM COUNTY COUNCIL<br />
29
In total, non-household waste arisings have decreased between 2004/05 and<br />
2008/09. Trade waste has remained fairly constant over the five year period<br />
but fly-tipped waste has decreased to approximately 60% of the 2004/05 levels<br />
by 2008/09, accounting <strong>for</strong> less than 5,000 tonnes per annum.<br />
ENVIRONMENTAL RESOURCES MANAGEMENT DURHAM COUNTY COUNCIL<br />
30
4 WASTE COMPOSITION AND CAPTURE ANALYSIS<br />
4.1 COMPOSITION OF DURHAM COUNTY MUNICIPAL SOLID WASTE<br />
4.1.1 Comparative <strong>Waste</strong> Composition Report: November 2007<br />
In 2007, a comparative waste composition study of <strong>County</strong> <strong>Durham</strong>’s<br />
municipal solid waste was undertaken by Resource Futures. Fourteen<br />
samples, two from each WCA, of kerbside collected materials were taken <strong>for</strong><br />
analysis over a four week period in each season. Residual waste from<br />
HWRCs (<strong>for</strong>mer civic amenity sites) was also included in the waste<br />
composition analysis.<br />
The samples took into consideration the specific demographic make up within<br />
each of the districts within the <strong>County</strong>. Key findings from the report are as<br />
follows:<br />
• Residual waste arisings <strong>for</strong> the county was 11.41 kg per household per<br />
week.<br />
• Food and plastic waste accounted <strong>for</strong> 32% and 12% respectively of residual<br />
waste in the county.<br />
• Dry recycling arisings accounted <strong>for</strong> an average of 5.00 kg per household<br />
per week.<br />
• Paper and glass recyclables accounted <strong>for</strong> 54% and 28% respectively of dry<br />
recycling in the county.<br />
Table 4.1 presents the results of the comparative waste composition study.<br />
ENVIRONMENTAL RESOURCES MANAGEMENT DURHAM COUNTY COUNCIL<br />
31
Table 4.1 Results of <strong>Durham</strong> <strong>County</strong> Council Comparative <strong>Waste</strong> Composition Report:<br />
November 2007<br />
<strong>Waste</strong><br />
Category<br />
Garden<br />
waste<br />
<strong>Waste</strong> Sub-category<br />
kg/ hh/<br />
wk<br />
TOTAL MSW Dry Recycling Residual<br />
% of total<br />
Kg/ hh/<br />
wk<br />
% of<br />
total<br />
kg/ hh/<br />
wk<br />
% of<br />
total<br />
Bulky, woody garden<br />
waste<br />
0.038 0.20% - 0.00% 0.038 0.30%<br />
Turf and soil 0.065 7.01% 0.35% - 0.00% 0.065 0.51%<br />
Leaves, clippings, cuttings<br />
and plants<br />
1.211<br />
6.46% 0.003 0.05% 1.207 9.50%<br />
Food waste Fruit and vegetable kitchen<br />
waste<br />
2.060<br />
21.69%<br />
11.00% 0.005 0.08% 2.054 16.17%<br />
Meat kitchen waste 2.002<br />
10.69% 0.007 0.11% 1.994 15.70%<br />
Paper Newspapers & magazines 4.135 22.08% 2.981 49.49% 0.659 5.19%<br />
Directories & catalogues<br />
(no Yellow)<br />
0.085 0.45% 0.039 0.64% 0.040 0.32%<br />
Yellow directories 0.032 28.74% 0.17% 0.010 0.16% 0.021 0.16%<br />
Junk mail & other<br />
recyclable<br />
0.546 2.92% 0.212 3.52% 0.299 2.35%<br />
Wall paper/non-recyclable 0.584<br />
3.12% 0.102 1.70% 0.464 3.66%<br />
Cardboard Cardboard<br />
Tetra Pak containers<br />
1.093<br />
0.049<br />
6.10%<br />
5.84%<br />
0.26%<br />
0.329<br />
0.011<br />
5.46%<br />
0.18%<br />
0.709<br />
0.037<br />
5.58%<br />
0.29%<br />
Wood Un-treated timber 0.028 0.15% - 0.00% 0.028 0.22%<br />
Treated timber 0.039 0.78% 0.21% - 0.00% 0.039 0.31%<br />
MDF and chipboard 0.078<br />
0.42% - 0.00% 0.078 0.61%<br />
Glass Glass bottles and jars<br />
Other glass<br />
2.075<br />
0.025<br />
11.21%<br />
11.08%<br />
0.13%<br />
1.446<br />
-<br />
24.01%<br />
0.00%<br />
0.389<br />
0.025<br />
3.06%<br />
0.19%<br />
Plastic Plastic bottles 0.464 2.48% 0.119 1.98% 0.325 2.56%<br />
Plastic film 0.749 4.00% 0.052 0.87% 0.688 5.42%<br />
Solid Plastic Packaging 0.358 9.51% 1.91% 0.028 0.47% 0.325 2.56%<br />
Expanded Polystyrene 0.030 0.16% 0.002 0.02% 0.028 0.22%<br />
Other plastic 0.179<br />
0.96% 0.003 0.05% 0.176 1.38%<br />
Metals Metals, Cans and Foil.<br />
Other metals<br />
0.864<br />
0.107<br />
5.18%<br />
4.61%<br />
0.57%<br />
0.460<br />
0.003<br />
7.65%<br />
0.05%<br />
0.327<br />
0.104<br />
2.57%<br />
0.82%<br />
Textiles<br />
and shoes<br />
Suitable <strong>for</strong> charity shop<br />
0.124 0.66% 0.020 0.33% 0.101 0.79%<br />
Unsuitable <strong>for</strong> charity shop 0.181 2.60% 0.97% 0.004 0.06% 0.177 1.39%<br />
Shoes 0.073 0.39% 0.003 0.04% 0.070 0.55%<br />
Other textiles 0.108<br />
0.57% 0.000 0.01% 0.107 0.84%<br />
Clinical<br />
waste<br />
Disposable nappies<br />
0.459<br />
2.59%<br />
2.45% 0.001 0.01% 0.459 3.61%<br />
Other Clinical <strong>Waste</strong> 0.026<br />
0.14% - 0.00% 0.026 0.21%<br />
Household Household Batteries<br />
hazardous<br />
waste<br />
0.010 0.06% - 0.00% 0.010 0.08%<br />
Lightbulbs and fluorescent<br />
tubes<br />
0.003<br />
0.22%<br />
0.01% 0.000 0.00% 0.002 0.02%<br />
Other household<br />
hazardous waste<br />
0.028<br />
0.15% 0.000 0.01% 0.028 0.22%<br />
WEEE Electrical & electronic<br />
Battery operated<br />
0.165<br />
0.011<br />
0.94%<br />
0.88%<br />
0.06%<br />
0.001<br />
-<br />
0.01%<br />
0.00%<br />
0.164<br />
0.011<br />
1.29%<br />
0.09%<br />
Miscellaneous<br />
items<br />
Pet waste<br />
0.564<br />
7.00%<br />
3.01% 0.001 0.02% 0.563 4.43%<br />
Miscellaneous items 0.746<br />
3.98% 0.137 2.27% 0.586 4.62%<br />
Fine<br />
elements<br />
Particles passing through a<br />
20mm sieve<br />
0.332 1.77% 1.77% 0.045 0.74% 0.280 2.20%<br />
ENVIRONMENTAL RESOURCES MANAGEMENT DURHAM COUNTY COUNCIL<br />
32
Although the kerbside and bring site collection services are provided in all<br />
seven districts in <strong>Durham</strong> <strong>County</strong>, it is recognised that not all residents in<br />
these areas will take advantage of the various schemes offered. The most<br />
recent assessment of participation in recycling collection schemes by residents<br />
of <strong>Durham</strong> <strong>County</strong> was undertaken in August 2009, which counted the<br />
number of houses which made use of kerbside recycling in each area. This is<br />
not an official participation rate study and due to the small survey size and<br />
limited time span it does not provide a robust enough data set to be used as<br />
such. WRAP are currently working with <strong>Durham</strong> <strong>County</strong> Council to review<br />
the options <strong>for</strong> undertaking a further participation study and if this is<br />
undertaken will be used in the future in place of this limited study.<br />
Table 4.2 shows the percentage of households participating in kerbside<br />
recycling in each of the seven districts.<br />
Table 4.2 Kerbside Recycling Collection Set Out Rate: August 2009<br />
Chester-le-Street<br />
Set out rate (%)<br />
*<br />
Derwentside 79%<br />
<strong>Durham</strong> City 77%<br />
Easington 67%<br />
Sedgefield 65%<br />
Teesdale 83%<br />
Wear Valley 72%<br />
TOTAL <strong>Durham</strong> <strong>County</strong> 74%<br />
* No figure provided <strong>for</strong> Chester le Street<br />
4.2 MATERIALS CAPTURE ANALYSIS<br />
4.2.1 Conclusions<br />
A detailed materials capture analysis was undertaken using <strong>Durham</strong> <strong>County</strong>’s<br />
2008/09 data in con<strong>for</strong>mance with Defra MSWM guidance (1) to develop an<br />
understanding of the potential additional recycling per<strong>for</strong>mance available<br />
from the local waste streams. This will also assist in helping in<strong>for</strong>m potential<br />
future collection service changes <strong>for</strong> collecting recyclables and organics.<br />
Detailed graphs of the analysis are presented in Annex E. The data presents<br />
the following <strong>for</strong> each <strong>for</strong>mer district:<br />
• Predicted material in household waste;<br />
• Quantity of material actually recycled in 2008/09; and<br />
• Potentially available material in the residual waste stream that can be<br />
targeted <strong>for</strong> capture.<br />
The capture analysis found that there are some materials <strong>for</strong> which there are<br />
high capture rates, and clearly a strong level of participation in the recycling<br />
(1) Defra (2006) A Practice Guide <strong>for</strong> the Development of <strong>Municipal</strong> <strong>Waste</strong> <strong>Management</strong> Strategies, In<strong>for</strong>mation Sheet 7, Material<br />
Capture Analysis. Defra, London.<br />
ENVIRONMENTAL RESOURCES MANAGEMENT DURHAM COUNTY COUNCIL<br />
33
of these materials. The materials that have the higher rates of capture, in<br />
excess of 60%, are newspapers and magazines and all types of glass. One<br />
main area that can be improved upon would be plastics, with material capture<br />
rates typically around 15%. Capture rates <strong>for</strong> cans are around the 40-50%<br />
mark, and as such can also be improved.<br />
ENVIRONMENTAL RESOURCES MANAGEMENT DURHAM COUNTY COUNCIL<br />
34
5 RECYCLING & COMPOSTING PERFORMANCE<br />
5.1 DURHAM COUNTY WASTE TARGETS<br />
Defra’s <strong>Waste</strong> <strong>Strategy</strong> <strong>for</strong> England 2007 (1) sets several challenging local and<br />
national targets relating to waste arisings and recycling and composting rates.<br />
<strong>County</strong> <strong>Durham</strong>’s specific targets relating to the management of waste, which<br />
take into account the overarching European and national targets, are listed in<br />
Table 5.1.<br />
Table 5.1 <strong>County</strong> <strong>Durham</strong> <strong>Waste</strong> Targets<br />
<strong>Waste</strong> <strong>Management</strong> Category <strong>Durham</strong> <strong>County</strong> Specific Target (2)<br />
Household waste, reuse,<br />
recycling and composting<br />
• by 2010: 40% of total household waste;<br />
• by 2015: 45% of total household waste; and<br />
• by 2020: 50% of total household waste.<br />
Household residual waste • by 2010: reduction by 29% from 2000 levels;<br />
• by 2015: reduction by 35% from 2000 levels; and<br />
• by 2020: reduction by 45% from 2000 levels.<br />
<strong>Municipal</strong> waste recovery<br />
Landfill Allowance and<br />
Trading Scheme (LATS)<br />
• by 2010: 53% of total household waste;<br />
• by 2015: 67% of total household waste; and<br />
• by 2020: 75% of total household waste.<br />
• in 2010: biodegradable municipal waste to landfill<br />
allowance of 118,088 tonnes;<br />
• in 2013: biodegradable municipal waste to landfill<br />
allowance of 78,655 tonnes; and<br />
• in 2020: biodegradable municipal waste to landfill<br />
allowance of 55,038 tonnes.<br />
5.1.1 National Indicators (NI) and Best Value Per<strong>for</strong>mance Indicators (BVPI)<br />
In order to achieve the national targets set in the <strong>Waste</strong> <strong>Strategy</strong> <strong>for</strong> England<br />
2007, statutory National Indicators (NI) have been set <strong>for</strong> WCAs and WDAs.<br />
NIs were introduced in April 2008 and replaced the Best Value Per<strong>for</strong>mance<br />
Indicators (BVPIs).<br />
Table 5.3 sets out the NIs adopted by <strong>Durham</strong> <strong>County</strong> Council, with reference<br />
to the corresponding <strong>for</strong>mer BVPI (see Table 5.2).<br />
(1) Defra (2007) <strong>Waste</strong> <strong>Strategy</strong> <strong>for</strong> England 2007, TSO, London.<br />
(2) <strong>Durham</strong> <strong>County</strong> Council (2009) <strong>Municipal</strong> <strong>Waste</strong> <strong>Management</strong> <strong>Strategy</strong> <strong>for</strong> <strong>County</strong> <strong>Durham</strong> 2009-2020, Revised Draft<br />
<strong>Strategy</strong><br />
ENVIRONMENTAL RESOURCES MANAGEMENT DURHAM COUNTY COUNCIL<br />
35
Table 5.2 Best Value Per<strong>for</strong>mance Indicators Reported by All Authorities<br />
BVPI<br />
BVPI 84 kg per head of household waste collected<br />
BVPI 82a % household waste recycled and % household waste<br />
and 82b composted<br />
BVPI 82c % household waste landfilled<br />
BVPI 82d % household waste to energy recovery<br />
BVPI 87 Cost per tonne <strong>for</strong> disposal (£)<br />
BVPI 90c % people satisfied with waste disposal<br />
Table 5.3 National Indicators that <strong>Durham</strong> Report<br />
National Indicator<br />
NI 191 Residual household waste per household<br />
NI 192 Household waste recycled and composted<br />
NI 193 <strong>Municipal</strong> waste landfilled<br />
5.2 RECYCLING AND COMPOSTING RATES<br />
Recycling and composting in <strong>County</strong> <strong>Durham</strong> comprises materials collected<br />
via the following routes:<br />
• Kerbside collections;<br />
• HWRCs;<br />
• Bring sites; and<br />
• Third party collections.<br />
Table 5.4 Household Recycling and Composting: 2004/05 to 2007/08<br />
2004/05 2005/06 2006/07 2007/08<br />
Chester-le-Street # 12.7% 24.66% 18.7%<br />
<strong>Durham</strong> City # 19.8% 28.31% 22.99%<br />
Derwentside # 11.9% 29.01% 26.92%<br />
Easington # 24.4% 33.99% 20.19%<br />
Sedgefield # 15.4% 26.28% 18.3%<br />
Teesdale # 23.5% 27.53% 35.31%<br />
Wear Valley # 15.2% 26.49% 21.74%<br />
DCC Average*<br />
* Including HWRCs<br />
18.48% 25.98% 29.25% 24.99%<br />
# No district breakdown available<br />
Recycling and composting rates <strong>for</strong> the <strong>County</strong> as a whole increased between<br />
2004/05 and 2007/08. There was a drop in per<strong>for</strong>mance in 2007/08<br />
compared to 2006/07, however the unaudited figures <strong>for</strong> 2008/09 suggest the<br />
increasing trend has continued.<br />
ENVIRONMENTAL RESOURCES MANAGEMENT DURHAM COUNTY COUNCIL<br />
36
Figure 5.1 Breakdown of Recycling by Collection Method: 2004/05 to 2008/09<br />
<strong>Durham</strong> <strong>County</strong> recycling and composting arisings<br />
(tonnes)<br />
45,000<br />
40,000<br />
35,000<br />
30,000<br />
25,000<br />
20,000<br />
15,000<br />
10,000<br />
5,000<br />
0<br />
Figure 5.1 indicates the following:<br />
• Materials collected by household kerbside and third party collection have<br />
increased steadily since 2004/05. This is to be expected given the<br />
additional collection services provided since this year.<br />
• Materials deposited at HWRCs <strong>for</strong> recycling and composting decreased<br />
dramatically between 2004/05 and 2005/6. As noted in Section 3.2.5, this<br />
corresponds to the introduction of the <strong>Waste</strong> Permit Scheme (see also<br />
Section 2.1.3) which prevents the depositing of commercial waste at<br />
HWRCs. The amounts of waste recycled and composted from HWRCs<br />
appear to have stabilised since then.<br />
5.3 BEST VALUE PERFORMANCE INDICATORS<br />
2004/05 2005/06 2006/07 2007/08 2008/09<br />
WCA kerbside recycling WCA kerbside composting Third party recycling<br />
Third party composting Bring sites recycling HWRC recycling<br />
HWRC composting<br />
The data in the following table presents <strong>Durham</strong> <strong>County</strong> Council’s<br />
per<strong>for</strong>mance to date in relation to the <strong>for</strong>mer BVPIs.<br />
ENVIRONMENTAL RESOURCES MANAGEMENT DURHAM COUNTY COUNCIL<br />
37
Table 5.5 BVPI Per<strong>for</strong>mance 2004-2008<br />
BVPI Description 2004/05 2005/06 2006/07 2007/08<br />
82a<br />
82b<br />
82c<br />
82d<br />
84<br />
% household waste<br />
recycled<br />
% household waste<br />
composted<br />
% household waste<br />
to energy recovery<br />
% household waste<br />
landfilled<br />
kg per household of<br />
total MSW collected<br />
Actual Target Actual Target Actual Target Actual Target<br />
14.10% 14.00% 15.75% 14.50% 16.62% 17.00% 19.10% 17.00%<br />
4.38% 6.00% 10.23% 10.00% 12.63% 11.00% 5.89% 15.50%<br />
0.05% 0.30% 0.08% 0.50% 0.01% 0.10% 0.00% 0.10%<br />
81.47% 79.70% 73.95% 75.00% 70.74% 71.90% 73.60% 67.40%<br />
575.34 555.00 534.10 560.00 526.25 530.00 519.15 523.00<br />
Figure 5.2 Figures 5.2 to 5.5 show that <strong>County</strong> <strong>Durham</strong> has a mixed<br />
per<strong>for</strong>mance against the waste-related BVPIs. Per<strong>for</strong>mance against each of<br />
the BVPI targets is presented in further detail in the sections below.<br />
Figure 5.2 Variance Between BVPI Target 82a and DCC Data 2004-2008<br />
25%<br />
20%<br />
15%<br />
10%<br />
5%<br />
0%<br />
BVPI 82a - % Household <strong>Waste</strong> Recycling<br />
Actual Target Actual Target Actual Target Actual Target<br />
2004/05 2005/06 2006/07 2007/08<br />
ENVIRONMENTAL RESOURCES MANAGEMENT DURHAM COUNTY COUNCIL<br />
38
Figure 5.3 Variance Between BVPI Target 82b and DCC Data 2004-2008<br />
18%<br />
16%<br />
14%<br />
12%<br />
10%<br />
8%<br />
6%<br />
4%<br />
2%<br />
0%<br />
BVPI 82b - % Household <strong>Waste</strong> Composting<br />
Figure 5.4 Variance Between BVPI Target 82c and DCC Data 2004-2008<br />
0.60%<br />
0.50%<br />
0.40%<br />
0.30%<br />
0.20%<br />
0.10%<br />
0.00%<br />
Actual Target Actual Target Actual Target Actual Target<br />
2004/05 2005/06 2006/07 2007/08<br />
BVPI 82c - % Household <strong>Waste</strong> Recovery<br />
Actual Target Actual Target Actual Target Actual Target<br />
2004/05 2005/06 2006/07 2007/08<br />
ENVIRONMENTAL RESOURCES MANAGEMENT DURHAM COUNTY COUNCIL<br />
39
Figure 5.5 Variance Between BVPI Target 82d and DCC Data 2004-2008<br />
90%<br />
80%<br />
70%<br />
60%<br />
50%<br />
40%<br />
30%<br />
20%<br />
10%<br />
0%<br />
5.3.1 Recycling and Composting Targets<br />
BVPI 82a - % household waste recycled<br />
The household recycling rate does show a clear increasing trend over the past<br />
five years with the rate ranging from 2% above to 0.4% below the BVPI target.<br />
BVPI 82b - % household waste composted<br />
The composting rate, as a proportion of total MSW, shows a trend of<br />
increasing per<strong>for</strong>mance from 2004/05 to 2006/07, starting off below target but<br />
then exceeding the target by 2006/07. However, there was a significant<br />
deterioration in 2007/08 with the achieved composting rate being only about<br />
one third of the target rate.<br />
5.3.2 Household <strong>Waste</strong> to Recovery Targets<br />
BVPI 82c– % household waste to recovery<br />
The recovery rate in <strong>Durham</strong> is extremely low. <strong>Durham</strong> has consistently<br />
been below target <strong>for</strong> this parameter, but the targets themselves are at such a<br />
low rate (0.1-0.5%) that the effect on overall recovery results are minimal.<br />
5.3.3 Household <strong>Waste</strong> to Landfill Targets<br />
BVPI 82d– % household waste to landfill<br />
BVPI 82d - % Household <strong>Waste</strong> Landfilled<br />
Actual Target Actual Target Actual Target Actual Target<br />
2004/05 2005/06 2006/07 2007/08<br />
This target is a measure of the quantity of residual waste that is diverted from<br />
landfill. <strong>Durham</strong> <strong>County</strong> makes use of the aerobic digestion plant to sort<br />
BMW and recyclable materials from the mixed residual waste, with the<br />
intention that this can be diverted from landfill. However, a use has not been<br />
found <strong>for</strong> the compost-like output from the digester and there<strong>for</strong>e the Audit<br />
Commission does not consider this to be included as a material diverted from<br />
landfill. The proportion of household waste that is disposed of to landfill<br />
ENVIRONMENTAL RESOURCES MANAGEMENT DURHAM COUNTY COUNCIL<br />
40
showed a steady improvement between 2004/05 to 2006/07. In 2007/08,<br />
however, the proportion of waste sent to landfill increased and, as a result, the<br />
target was missed by more than 6%, representing a significant decrease in<br />
per<strong>for</strong>mance. This is due at least in part to the Digester not being operational<br />
<strong>for</strong> this year.<br />
5.3.4 <strong>Municipal</strong> Solid <strong>Waste</strong> Targets<br />
BVPI 84 – kg municipal solid waste collected per head<br />
The amount of municipal waste produced per head has reduced over time in<br />
line with the targets set in the BVPIs. The per capita rate of waste generation<br />
has been slightly below the target maximum amount between 2005/06 and<br />
2007/08 and thus <strong>Durham</strong> exceeded the target.<br />
5.3.5 Comparison of Statutory Per<strong>for</strong>mance Standards with other Authorities<br />
The data in Table 5.6 compares <strong>County</strong> <strong>Durham</strong>’s average recycling and<br />
composting rate with other local authorities (1) . The year selected <strong>for</strong><br />
comparison is the most recent audited year of 2007/08. The local authorities<br />
in the table have been selected based on the benchmarking family identified<br />
<strong>for</strong> <strong>County</strong> <strong>Durham</strong> by the Chartered Institute of Public Finance Auditing<br />
(CIPFA), most recently amended in April 2009. It should be noted that this<br />
benchmarking family is based on the <strong>County</strong> Council’s new Unitary Authority<br />
status, whilst the BVPIs compared below are <strong>for</strong> 2007/08, which relates to the<br />
previous local authority structure.<br />
Table 5.6 Comparison of <strong>County</strong> <strong>Durham</strong>’s Statutory Per<strong>for</strong>mance Standards with that<br />
of other Authorities: 2007/08<br />
Authority<br />
Type BV 82a BV 82b BV 82c BV 82d BV 84<br />
<strong>Durham</strong> C 19% 6% 0% 74% 519.1<br />
Northumberland C 26% 10% 1% 63% 528.3<br />
Barnsley MD 17% 15% 0% 68% 439.5<br />
Bolton MD 19% 11% n/a n/a 418.5<br />
Doncaster MD 18% 16% 0% 65% 531.5<br />
Dudley MD 14% 13% 57% 16% 465.1<br />
Gateshead MD 15% 10% 0% 75% 514.4<br />
Kirklees MD 19% 7% 42% 32% 463.5<br />
Rotherham MD 21% 14% 0% 65% 470.5<br />
St Helens MD 12% 14% n/a n/a 438.2<br />
Tameside MD 20% 7% n/a n/a 385.9<br />
Wakefield MD 15% 11% 0% 74% 495.3<br />
Wigan MD 16% 10% 0% 74% 522.4<br />
North Lincolnshire UA 21% 22% 1% 56% 588.8<br />
Stockton-on-Tees UA 16% 10% 61% 13% 468.9<br />
Stoke-on-Trent UA 16% 9% 54% 21% 487.3<br />
Note: C= <strong>County</strong> Council, MD=Metropolitan District, UA=Unitary Authority<br />
(1) Audit Commission: ‘200708 BVPI Data Quartiles 190309’ downloaded from http://www.auditcommission.gov.uk/localgov/audit/BVPIs/Pages/200708bvpidataquartiles.aspx<br />
ENVIRONMENTAL RESOURCES MANAGEMENT DURHAM COUNTY COUNCIL<br />
41
5.4 LATS POSITION<br />
The Landfill Allowance and Trading Scheme (LATS) provides a system<br />
whereby tradable landfill allowances are allocated to waste disposal<br />
authorities each year. This enables allowances to be traded with other<br />
authorities, saved <strong>for</strong> future years (‘banked’) or brought <strong>for</strong>ward from future<br />
years (‘borrowed’). Allowances cannot be banked or borrowed into ‘target’<br />
years, which have been specified by Defra as 2010, 2013 and 2020<br />
(corresponding to the target years specified by the European Landfill<br />
Directive).<br />
Table 5.7 <strong>Durham</strong> <strong>County</strong> Council LATS Position 2004-2009<br />
2004/05 2005/06<br />
Tonnes<br />
2006/07 2007/08 2008/09<br />
LATS allowance target 195,902 188,120 176,448 160,885 141,432<br />
<strong>Waste</strong> sent to landfill 171,217 133,796 136,766 127,986 133,668<br />
If <strong>Durham</strong> continues to recycle and compost at the current rate and the<br />
quantities of residual materials are landfilled, then the LATS situation to 2020<br />
would be as presented in Figure 5.6.<br />
Figure 5.6 LATS Forecast Projection<br />
tonnes<br />
250000<br />
200000<br />
150000<br />
100000<br />
50000<br />
0<br />
2004/05<br />
2005/06<br />
2006/07<br />
2007/08<br />
2008/09<br />
2010 target<br />
2010/11<br />
2011/12<br />
2013 target<br />
2013/14<br />
2014/15<br />
2015/16<br />
2016/17<br />
2017/18<br />
2018/19<br />
2020 target<br />
Permissable BMW landfilled LATS permits required to be purchased<br />
LATS permits available to sell Tonnes of BMW allowed to be landfilled<br />
5.4.1 Diversion of Biodegradable <strong>Municipal</strong> <strong>Waste</strong> (BMW) from Landfill<br />
Residual municipal waste diverted from landfill comprises all materials that<br />
go to recycling and composting, as well as material that is processed through<br />
the aerobic digestion plant (and which is not landfilled).<br />
The majority of the diverted waste comprises recycled and composted<br />
materials from kerbside collection, bring sites and HWRCs. In addition,<br />
ENVIRONMENTAL RESOURCES MANAGEMENT DURHAM COUNTY COUNCIL<br />
42
some recyclable materials are sorted from the residual waste that is processed<br />
through the aerobic digestion plant. A compost-like material is produced<br />
from the digestion of residual waste but given that no use has been identified<br />
<strong>for</strong> this, it is used primarily as landfill cover material and is there<strong>for</strong>e not<br />
counted as diverted waste in this context. No diversion was reported to<br />
waste data flow <strong>for</strong> 2008/9, due to the digester not being operational in this<br />
period. Data <strong>for</strong> the previous year’s wastes sent to the digester is presented<br />
in Annex B.<br />
<strong>Durham</strong> will require substantially increased recycling and composting and/or<br />
additional treatment of residual waste, to divert sufficient waste from landfill<br />
to meet future LATS requirements unless the Authority is prepared to buy<br />
allowances from other authorities.<br />
ENVIRONMENTAL RESOURCES MANAGEMENT DURHAM COUNTY COUNCIL<br />
43
ENVIRONMENTAL RESOURCES MANAGEMENT DURHAM COUNTY COUNCIL<br />
44
6 WASTE ARISINGS PROJECTIONS<br />
It is vitally important that future waste arisings projections are based on<br />
sound evidence and data. The need <strong>for</strong> future infrastructure, and the<br />
potential size of this infrastructure will depend on such <strong>for</strong>ecasts.<br />
In February 2009, Enviros was commissioned by <strong>Durham</strong> <strong>County</strong> Council to<br />
undertake an Options Appraisal (1) , as part of the <strong>Waste</strong> Solutions Project.<br />
One aspect of the exercise was to identify likely future waste arisings on the<br />
basis of historical and predicted trends.<br />
The table below presents the four scenarios assessed in the Enviros modelling.<br />
Table 6.1 Projected <strong>Waste</strong> Arisings Scenarios<br />
Scenario # Scenario Name Description<br />
Scenario 1: Historical trend Growth based on historical waste arisings trend in<br />
<strong>Durham</strong> <strong>County</strong><br />
Scenario 2: No growth No growth of waste arisings – maintenance of the<br />
status quo<br />
Scenario 3: UK average trend Growth based on average waste arisings trend in the<br />
UK<br />
Scenario 4: Growth in number of<br />
households<br />
Growth of waste arisings linked to growth in the<br />
number of households<br />
For the purposes of the Options Appraisal, which is based on the outcome of<br />
the base flow modelling, Scenario 4: Growth in number of households was<br />
adopted to project future waste arisings. Scenario 4 assumes the following:<br />
• Growth in household numbers up to 2020 as per <strong>Durham</strong> <strong>County</strong> Council<br />
projections, with an annual growth rate of 0.5%; and<br />
• The amount of waste per household will continue to decline by 0.5% per<br />
annum up to 2011/12 and will subsequently decline at a steadily reducing<br />
rate up to 2020. This reflects the waste minimisation activities that are<br />
being implemented. After 2020, waste per household is assumed to<br />
remain constant.<br />
6.1.1 Projected <strong>Waste</strong> Arisings – Results<br />
Table 6.2 shows the changes in waste arisings up to 2020/21 on the basis of the<br />
chosen scenario outlined above.<br />
(1) Enviros (2009) Options Appraisal <strong>for</strong> <strong>Waste</strong> Solutions Project, March 2009<br />
ENVIRONMENTAL RESOURCES MANAGEMENT DURHAM COUNTY COUNCIL<br />
45
Table 6.2 Forecast Future <strong>Waste</strong> Arisings: 2007/08 to 2020/21<br />
Chosen Scenario % Increase<br />
2007/08 291,282 N/A<br />
2008/09 291,401 0.04%<br />
2009/10 290,907 -0.17%<br />
2010/11 290,444 -0.16%<br />
2011/12 290,034 -0.14%<br />
2012/13 291,326 0.45%<br />
2013/14 292,404 0.37%<br />
2014/15 294,270 0.64%<br />
2015/16 296,173 0.65%<br />
2016/17 298,457 0.77%<br />
2017/18 301,983 1.18%<br />
2018/19 306,680 1.56%<br />
2019/20 310,907 1.38%<br />
2020/21 314,983 1.31%<br />
The modelling relied on baseline data from 2007/8 and the predicted tonnages<br />
<strong>for</strong> 2008/9 do not match the actual tonnages managed. To realign the<br />
<strong>for</strong>ecast the tonnage data presented in this baseline assessment (281,068 tonnes<br />
MSW) was used as the new baseline figure. The percentage growth <strong>for</strong>ecasts<br />
produced by Enviros have been applied to this new baseline to give an<br />
amended waste <strong>for</strong>ecast, shown in Table 6.3.<br />
Table 6.3 New Forecast Future <strong>Waste</strong> Arisings: 2008/09 to 2020/21<br />
<strong>Waste</strong> <strong>for</strong>ecast with new baseline and<br />
chosen scenario % increase<br />
2008/09 281,068<br />
2009/10 280,591<br />
2010/11 280,145<br />
2011/12 279,749<br />
2012/13 280,995<br />
2013/14 282,035<br />
2014/15 283,835<br />
2015/16 285,671<br />
2016/17 287,874<br />
2017/18 291,275<br />
2018/19 295,805<br />
2019/20 299,882<br />
2020/21 303,814<br />
Figure 6.1 shows the last five years worth of data and the <strong>for</strong>ecast projection<br />
based on the data from Table 6.3.<br />
ENVIRONMENTAL RESOURCES MANAGEMENT DURHAM COUNTY COUNCIL<br />
46
Figure 6.1 MSW Historical Data and Future Projections (Tonnes)<br />
MSW (tonnes)<br />
340,000<br />
330,000<br />
320,000<br />
310,000<br />
300,000<br />
290,000<br />
280,000<br />
270,000<br />
260,000<br />
250,000<br />
2004/05<br />
2005/06<br />
2006/07<br />
2007/08<br />
2008/09<br />
2009/10<br />
2010/11<br />
2011/12<br />
2012/13<br />
2013/14<br />
2014/15<br />
2015/16<br />
2016/17<br />
2017/18<br />
2018/19<br />
2019/20<br />
2020/21<br />
ENVIRONMENTAL RESOURCES MANAGEMENT DURHAM COUNTY COUNCIL<br />
47
Annex A<br />
Kerbside Collection Services
A1 COUNTY DURHAM KERBSIDE COLLECTION SERVICES (2008/9)<br />
Table A1.1 Kerbside Collection Services in <strong>County</strong> <strong>Durham</strong> (2008/09)<br />
Collection Type Chester le Street Derwentside <strong>Durham</strong> City Easington Sedgefield Teesdale Wear Valley<br />
Coverage 98% 96% 100% 100% 100% 100% 100%<br />
Dry Recycling<br />
Refuse<br />
Green waste*<br />
Materials<br />
Receptacle<br />
Box - Glass, cans,<br />
Bag – paper &<br />
card, plastic, food<br />
& beverage cartons<br />
55 litre green box<br />
Green reusable bag<br />
Bin - cans; plastic<br />
bottles; food &<br />
beverage cartons;<br />
paper &<br />
cardboard; and<br />
textiles<br />
Box – glass only<br />
240 litre bin;<br />
55 litre green<br />
plastic box; and<br />
Green reusable bag<br />
(textiles)<br />
Box - Glass, cans,<br />
Bag – paper &<br />
card, plastic, food<br />
& beverage cartons<br />
55 litre green box<br />
Green reusable bag<br />
Box - Glass, cans,<br />
Bag – paper &<br />
card, plastic, food<br />
& beverage cartons<br />
Black plastic box;<br />
and Green<br />
reusable bag<br />
Box - Glass, cans,<br />
Bag – paper &<br />
card, plastic, food<br />
& beverage cartons<br />
55 litre green box<br />
Green reusable bag<br />
Black Box - Glass;<br />
Green Box - paper<br />
& cardboard;<br />
Blue Bag – mixed<br />
cans & plastics;<br />
55 litre green and<br />
black plastic boxes<br />
and Blue non<br />
reusable bag<br />
Glass; cans; paper<br />
& cardboard; and<br />
textiles<br />
55 litre black<br />
plastic box;<br />
Frequency Fortnightly Alternate Weekly Fortnightly Fortnightly Fortnightly Fortnightly Fortnightly<br />
Coverage 100% 100% 100% 100% 100% 100% 100%<br />
Receptacle<br />
240 litre wheeled<br />
bin<br />
240 litre wheeled<br />
bin<br />
240 litre wheeled<br />
bin<br />
240 litre wheeled<br />
bin<br />
240 litre wheeled<br />
bin<br />
240 litre wheeled<br />
bin<br />
180 litre wheeled<br />
bin<br />
Frequency Weekly Alternate Weekly Weekly Weekly Weekly Weekly Weekly<br />
Coverage 0 Unknown Unknown Unknown Unknown Unknown Unknown<br />
Receptacle n/a<br />
240 litre wheeled<br />
bin<br />
240 litre wheeled<br />
bin<br />
140 litre wheeled<br />
bin<br />
240 litre wheeled<br />
bin<br />
Unknown<br />
240 litre wheeled<br />
bin<br />
Frequency n/a Fortnightly Fortnightly Fortnightly Fortnightly Weekly Fortnightly<br />
Food waste<br />
Receptacle<br />
Frequency<br />
n/a<br />
n/a<br />
n/a<br />
n/a<br />
n/a<br />
n/a<br />
n/a<br />
n/a<br />
n/a<br />
n/a<br />
n/a<br />
n/a<br />
n/a<br />
n/a<br />
* Significant expansion of the green waste collection planned <strong>for</strong> following year.
Annex B<br />
Detailed <strong>Waste</strong> Data:<br />
2006/07 to 2008/09
B1 DETAILED WASTE DATA<br />
B1.1 DURHAM COUNTY DETAILED WASTE DATA: 2008/09<br />
Table B1.1 <strong>Municipal</strong> <strong>Waste</strong> Arisings: 2008/09 (tonnes)<br />
Chester-le-Street Derwentside <strong>Durham</strong> City Easington Sedgefield Teesdale Wear Valley HWRC TOTALS<br />
HOUSEHOLD WASTE<br />
Household recycling 5,449 9,391 8,271 7,866 7,108 2,213 4,790 23,724 68,811<br />
Household composting 0 1,379 877 3,886 543 1,998 1,103 9,122 18,908<br />
Household residual 15,968 23,886 25,168 31,021 27,174 7,478 20,550 29,251 180,495<br />
Sub-total 21,417 34,656 34,317 42,773 34,824 11,689 26,443 62,096 268,215<br />
NON-HOUSEHOLD WASTE<br />
Trade residual 870 2,251 0 2,135 1,943 668 0 7,867<br />
Trade recycling 0 0 0 0 0 0 0 0<br />
Fly-tip residual 713 671 1,540 708 767 15 573 4,986<br />
Sub-total 1,583 2,922 1,540 2,843 2,710 683 573 0 12,853<br />
RECYCLING & COMPOSTING<br />
Kerbside recycling 5,051 8,807 7,774 7,194 6,773 1,885 3,984 41,469<br />
Bring site recycling 240 316 211 301 165 221 325 1,780<br />
Third party recycling 158 268 285 371 170 107 481 1,839<br />
HWRC recycling 0 0 0 0 0 0 0 23,724 23,724<br />
Kerbside composting 0 1,379 877 3,886 543 0 1,103 7,788<br />
Third party composting 0 0 0 0 0 1,998 0 1,998<br />
HWRC composting 9,122 9,122<br />
Sub-total 5,449 10,770 9,149 11,752 7,650 4,211 5,893 32,846 87,719<br />
RESIDUAL WASTE 17,551 26,808 26,709 33,863 29,884 8,161 21,123 29,251 193,348<br />
TOTAL MSW 23,000 37,578 35,857 45,615 37,534 12,372 27,016 62,096 281,068
Table B1.2 Recycling and Composting: 2008/09 (tonnes)<br />
Chester-le-Street Derwentside <strong>Durham</strong> City Easington Sedgefield Teesdale Wear Valley HWRC TOTALS<br />
KERBSIDE<br />
kerbside - paper & card 2,736 5,830 4,232 3,762 3,690 1,107 2,737 24,095<br />
kerbside - cans 385 278 551 603 533 162 209 2,722<br />
kerbside - plastic 534 712 1,015 944 630 80 0 3,915<br />
kerbside - glass 1,255 1,940 1,854 1,683 1,612 536 933 9,812<br />
kerbside - green 0 1,379 877 3,886 543 0 1,103 7,788<br />
kerbside - textiles 0 47 0 0 0 0 36 82<br />
kerbside - scrap metal 0 0 0 0 0 0 0 0<br />
kerbside - white goods 10 0 112 202 208 0 69 601<br />
kerbside - other 133 0 10 0 99 0 0 242<br />
Sub-total 5,051 10,185 8,652 11,081 7,315 1,885 5,087 0 49,257<br />
BRING SITES<br />
bank - paper & card 126 124 32 53 29 68 52 0 484<br />
bank – cans 5 6 33 0 17 3 0 0 64<br />
bank – plastic 0 22 0 0 0 0 0 0 22<br />
bank – glass 79 87 63 248 120 149 198 0 944<br />
bank – textiles 24 78 50 0 0 0 67 0 220<br />
bank – shoes 4 0 0 0 0 0 6 0 10<br />
bank – cartons 1 0 0 0 0 0 2 0 3<br />
bank - scrap metal 0 0 34 0 0 0 0 0 34<br />
Sub-total 240 316 211 301 165 221 325 0 1,780<br />
HWRC<br />
Large WEEE 201 201<br />
Small WEEE 319 319<br />
Heavy steel 105 105<br />
Light steel 1,498 1,498<br />
Lead 4 4<br />
Brass 15 15<br />
Copper 35 35<br />
Stainless steel 12 12<br />
Aluminium 47 47<br />
Cardboard 1,110 1,110<br />
Batteries 16 16<br />
Cans 20 20<br />
Gas Bottles 25 25<br />
Glass 215 215
Chester-le-Street Derwentside <strong>Durham</strong> City Easington Sedgefield Teesdale Wear Valley HWRC TOTALS<br />
Paper 406 406<br />
TVs & Monitors 588 588<br />
Oil 84 84<br />
Fridges 327 327<br />
Textiles 147 147<br />
Shoes 21 21<br />
Fluorescent tubes 4 4<br />
Bric-a-brac 166 166<br />
Tyres 290 290<br />
Cartons 2 2<br />
Bikes 1 1<br />
Timber 3,661 3,661<br />
Soil & rubble 14,406 14,406<br />
Sub-total 23,725 23,725<br />
HWRC - Composting (green) 9,122 9,122<br />
Sub-total 9,122 9,122<br />
OTHER (THIRD PARTY)<br />
Paper and card 0.5 0.2 18.9 0.9 0.0 7.0 270.7 298<br />
Glass 0.0 0.0 0.0 0.0 0.0 0.0 0.0 0<br />
Cans 0.0 0.0 0.0 0.7 5.9 0.0 12.2 19<br />
Plastic 0.0 0.2 0.0 0.5 0.0 0.0 0.0 1<br />
Textiles 151 265 264 364 164 98 197 1,504<br />
Shoes 6.0 2.6 2.2 4.2 0.0 1.9 0.6 17<br />
Green 0 0 0 0 0 1,998 0 0 1,998<br />
Scrap metal 0 0 0 0 0 0 0 0 0<br />
Sub-total 158 268 285 371 170 2,105 481 0 3,837<br />
OTHER(DIGESTER OUTPUT)<br />
Light plastic 0 0 0 0 0 0 0 0 0<br />
Dense plastic 0 0 0 0 0 0 0 0 0<br />
Shredded textile 0 0 0 0 0 0 0 0 0<br />
Ferrous metals 0 0 0 0 0 0 0 0 0<br />
Non-ferrous metals 0 0 0 0 0 0 0 0 0<br />
Glass 0 0 0 0 0 0 0 0 0<br />
Sub-total 0 0 0 0 0 0 0 0 0<br />
Total Recycling 5,449 10,770 9,149 11,752 7,650 4,211 5,893 32,846 87,720
N.B. Given that the aerobic digestion facility at Thornley was non-operational <strong>for</strong> the baseline year, data relating to waste diverted from landfill by this means is not included.<br />
The eventual re-commencement of aerobic digestion as a waste processing technique will undoubtedly impact on the data. However it is not known how long the aerobic<br />
digestion facility will remain non-operational and it is there<strong>for</strong>e not considered to be representative to include it in this baseline assessment.
Table B1.3 <strong>Waste</strong> Disposal: 2008/09 (tonnes)<br />
Chester-le-Street Derwentside <strong>Durham</strong> City Easington Sedgefield Teesdale Wear Valley HWRC TOTALS<br />
HOUSEHOLD RESIDUAL<br />
to Landfill (Joint Stocks) 15,968 23,886 25,168 31,021 27,174 7,478 20,550 151,245<br />
to WTS (then landfill) 0<br />
to WTS (then digester) 0 0 0 0 0 0 0 0<br />
Sub-total 15,968 23,886 25,168 31,021 27,174 7,478 20,550 0 151,245<br />
HWRC RESIDUAL<br />
to Landfill (Joint Stocks) - - - - - - - 29,251 29,251<br />
to WTS (then landfill) - - - - - - - - -<br />
to WTS (then digester) - - - - - - - - -<br />
Sub-total - - - - - - - 29,251 29,251<br />
NON-HOUSEHOLD RESIDUAL<br />
to Landfill (Joint Stocks) 713 671 1,540 708 767 15 573 4,986<br />
to WTS (then landfill) 870 2,251 0 2,135 1,943 668 0 7,867<br />
to WTS (then digester) 0 0 0 0 0 0 0 0<br />
Sub-total 1,583 2,922 1,540 2,843 2,710 683 573 0 12,853<br />
Total Disposal 17,551 26,808 26,709 33,863 29,884 8,161 21,123 29,251 193,348
B2 DURHAM COUNTY DETAILED WASTE DATA: 2007/08<br />
B2.1 DURHAM COUNTY DETAILED WASTE DATA: 2007/08<br />
Table B2.1 <strong>Municipal</strong> <strong>Waste</strong> Arisings: 2007/08 (tonnes)<br />
Chester-le-Street Derwentside <strong>Durham</strong> City Easington Sedgefield Teesdale Wear Valley HWRC TOTALS<br />
HOUSEHOLD WASTE<br />
Household recycling 4,476 10,095 6,731 6,247 6,138 2,451 6,418 22,118 64,674<br />
Household composting - 31 867 1,907 505 1,155 797 8,596 13,859<br />
Household residual 17,550 27,666 25,980 37,195 32,168 8,533 20,085 31,524 200,700<br />
of which Digester recycling 11,586<br />
of which Digester residual 29,203<br />
Sub-total 22,026 37,792 33,578 45,349 38,811 12,139 27,300 62,238 279,232<br />
NON-HOUSEHOLD WASTE<br />
Trade residual 888 2,244 - 2,460 1,956 636 - - 8,184<br />
Trade recycling - - - - - - - - 0<br />
Fly-tip residual 994 643 1,204 706 885 22 611 - 5,066<br />
Sub-total 1,882 2,887 1,204 3,166 2,841 658 611 - 13,250<br />
RECYCLING & COMPOSTING<br />
Kerbside recycling 4,025 9,280 5,962 5,449 5,553 2,174 5,621 - 38,064<br />
Bring site recycling 301 565 508 463 397 222 335 - 2,791<br />
Third party recycling 150 250 261 335 188 56 461 - 1,701<br />
HWRC recycling - - - - - - - 22,118 22,118<br />
Digester recycling 11,586<br />
Kerbside composting - 31 867 1,907 505 - 797 - 4,107<br />
Third party composting - - - - - 1,155 - - 1,155<br />
HWRC composting - - - - - - - 8,596 8,596<br />
Sub-total 4,476 10,126 7,598 8,154 6,643 3,607 7,214 30,714 78,532<br />
RESIDUAL WASTE 19,432 30,553 27,184 40,361 35,008 9,192 20,696 31,524 213,950<br />
TOTAL MSW 23,908 40,679 34,783 48,515 41,651 12,798 27,911 62,238 290,212
Table B2.2 Recycling and Composting: 2007/08 (tonnes)<br />
Chester-le-Street <strong>Durham</strong> City Derwentside Easington Sedgefield Teesdale Wear Valley HWRC TOTALS<br />
KERBSIDE<br />
kerbside - paper & card 2,172 3,335 5,057 2,821 3,191 1,170 2,962 - 20,709<br />
kerbside - cans - - - - - - - - 0<br />
kerbside - plastic - - 306 - - 78 - - 384<br />
kerbside - glass 974 1,573 1,854 1,009 1,374 548 1,037 - 8,369<br />
kerbside - green 0 867 31 1,907 505 0 797 - 4,107<br />
kerbside - textiles 0 0 0 0 0 0 31 - 31<br />
kerbside - scrap metal 187 225 212 277 323 153 233 - 1,611<br />
kerbside - white goods 692 828 1,851 1,342 664 224 1,358 - 6,960<br />
Sub-total 4,025 6,829 9,310 7,356 6,058 2,174 6,419 - 42,171<br />
BRING SITES<br />
bank - paper & card 146 155 - 83 105 77 98 - 664<br />
bank – cans - - - - - - - - -<br />
bank - plastic - - - - - - - - -<br />
bank – glass 111 287 249 379 260 120 180 - 1,586<br />
bank - green 30 50 117 - - - 48 - 246<br />
bank - textiles 4 - - - - - 6 - 10<br />
bank - shoes 1 - - 1 - - 1 - 3<br />
bank - cartons 8 16 200 - 31 25 2 - 283<br />
bank - scrap metal<br />
Sub-total 301 508 565 463 397 222 335 - 2,791<br />
HWRC<br />
Tyres - - - - - - - 193 193<br />
Soil & rubble - - - - - - - 15,264 15,264<br />
Green - - - - - - - 8,596 8,596<br />
Wood - - - - - - - 4,058 4,058<br />
Fridges - - - - - - - 391 391<br />
Other - - - - - - - 2,212 2,212<br />
Rejected wood - - - - - - - 193 193<br />
Sub-total - - - - - - - 30,714 30,714
OTHER (THIRD PARTY)<br />
Paper and card - 16 5 - - 15 265 - 300<br />
Glass - - - - - - - - -<br />
Cans - - - - - - - - -<br />
Plastic - - - - - - - - -<br />
Textiles 150 245 244 335 188 41 174 - 1,377<br />
Shoes - - - - - - - - -<br />
Green - - - - - 1,155 - - 1,155<br />
Scrap metal - - - - - - 22 - 23<br />
Sub-total 150 261 250 335 188 1,211 461 - 2,856<br />
OTHER RECYCLING (DIGESTER OUTPUT)<br />
Light plastic - - - - - - - - 84<br />
Dense plastic - - - - - - - - 37<br />
Shredded textile - - - - - - - - 2,029<br />
Ferrous metals - - - - - - - - 1,672<br />
Secondary ferrous metals - - - - - - - - 0<br />
Non-ferrous metals - - - - - - - - 23<br />
Glass - - - - - - - - 2,266<br />
Process loss - - - - - - - - 5,475<br />
Sub-total - - - - - - - - 11,586<br />
TOTAL RECYCLING 4,476 7,598 10,126 8,154 6,643 3,606 7,215 30,714 90,119
Table B2.3 <strong>Waste</strong> Disposal: 2007/08 (tonnes)<br />
Chester-le-Street <strong>Durham</strong> City Derwentside Easington Sedgefield Teesdale Wear Valley HWRC TOTALS<br />
HOUSEHOLD RESIDUAL<br />
to Landfill (Joint Stocks) 52 12,211 - 6,452 1,009 - 815 - 20,539<br />
to WTS 18,884 16,589 28,970 34,260 33,525 1,770 21,913 - 155,912<br />
of which to landfill 17,728 7,361 27,253 12,937 28,141 1,441 20,263 - 115,123<br />
of which to Digester<br />
of which is residue to<br />
1,156 9,229 1,718 21,323 5,384 329 1,651 - 40,789<br />
landfill 29,203<br />
Sub-total 36,664 36,161 56,223 53,649 62,675 3,211 42,990 - 164,864<br />
HWRC RESIDUAL<br />
to Landfill (Joint Stocks) - - - - - - - 22,578 22,578<br />
to WTS(then landfill) - - - - - - - 8,946 8,946<br />
Sub-total - - - - - - - 31,524 31,524<br />
NON-HOUSEHOLD RESIDUAL<br />
to WTS (then landfill) 1,882 1,204 2,887 3,166 2,841 658 611 - 13,250<br />
to WTS (then digester) - - - - - - - - -<br />
Sub-total 1,882 1,204 2,887 3,166 2,841 658 611 - 13,250<br />
Total Disposal 38,546 37,365 59,111 56,815 65,516 3,869 43,602 31,524 209,638
B3 DURHAM COUNTY DETAILED WASTE DATA: 2006/07<br />
B3.1 DURHAM COUNTY DETAILED WASTE DATA: 2006/07<br />
Table B3.1 <strong>Municipal</strong> <strong>Waste</strong> Arisings: 2006/07 (tonnes)<br />
Chester-le-Street <strong>Durham</strong> City Derwentside Easington Sedgefield Teesdale Wear Valley HWRC TOTALS<br />
HOUSEHOLD WASTE<br />
Household recycling 4,157 5,626 1,779 4,157 5,135 6,344 3,926 24,218 55,341<br />
Household composting 0 980 34 1,743 508 0 737 8,330 12,331<br />
Household residual 18,579 27,604 30,569 40,113 33,873 9,087 20,694 31,524 212,042<br />
of which Digester recycling - - - - - - - - 13,402<br />
of which Digester residual - - - - - - - - 19,216<br />
Sub-total 22,736 34,209 32,382 46,012 39,515 15,431 25,357 64,072 279,715<br />
NON-HOUSEHOLD WASTE<br />
Trade residual 912 0 2,304 2,460 2,088 564 0 0 8,328<br />
Trade recycling 0 0 0 0 0 0 0 0 0<br />
Fly-tip residual 1,050 1,141 1,126 775 677 22 676 0 5,467<br />
Sub-total 1,962 1,141 3,430 3,235 2,765 586 676 0 13,795<br />
RECYCLING & COMPOSTING<br />
Kerbside recycling 3,923 5,171 1,486 3,770 4,769 5,878 3,613 0 28,611<br />
Bring site recycling 233 455 293 386 366 466 313 0 2,512<br />
Third party recycling 0 0 0 0 0 0 0 0 0<br />
HWRC recycling 0 0 0 0 0 0 0 24,218 24,218<br />
Digester recycling - - - - - - - - 13,402<br />
Kerbside composting 0 980 34 1,743 508 0 737 0 4,001<br />
Third party composting 0 0 0 0 0 0 0 0 0<br />
HWRC composting 0 0 0 0 0 0 0 8,330 8,330<br />
Sub-total 4,157 6,605 1,813 5,900 5,643 6,344 4,663 32,548 81,074<br />
RESIDUAL WASTE 20,541 28,745 34,000 43,348 36,637 9,673 21,370 31,524 212,436<br />
TOTAL MSW 24,698 35,351 35,812 49,248 42,280 16,017 26,033 64,072 293,510
Table B3.2 Recycling and Composting: 2006/07 (tonnes)<br />
Chester-le-Street <strong>Durham</strong> City Derwentside Easington Sedgefield Teesdale Wear Valley HWRC TOTALS<br />
KERBSIDE<br />
kerbside - paper & card 2,189 3,072 9 2,517 3,008 3,707 2,004 - 16,507<br />
kerbside – cans 185 208 21 247 129 492 128 - 1,411<br />
kerbside – plastic 4 - 34 - - 137 - - 175<br />
kerbside – glass 1,019 1,449 118 900 1,295 1,532 712 - 7,025<br />
kerbside – green 0 980 34 1,743 508 - 737 - 4,001<br />
kerbside - textiles 21 - 111 - - 4 22 - 158<br />
kerbside - scrap metal - - - - - - - - -<br />
kerbside - white goods 506 442 1,193 106 336 6 747 - 3,335<br />
Sub-total 3,923 6,150 1,520 5,513 5,277 5,878 4,350 - 32,612<br />
BRING SITES<br />
bank - paper & card 115 183 9 68 115 246 90 - 826<br />
bank – cans 4 - 21 15 25 163 75 - 303<br />
bank – plastic 4 - 34 - - - 148 - 185<br />
bank – glass 89 239 118 303 226 12 - - 987<br />
bank – green 21 33 111 - - 45 - - 210<br />
bank – textiles - - - - - - - - 0<br />
bank – shoes - - - - - - - - 0<br />
bank – cartons<br />
bank - scrap metal<br />
Sub-total 233 455 293 386 366 466 313 - 2,512<br />
HWRC<br />
Tyres - - - - - - - 262 262<br />
Soil & rubble - - - - - - - 16,058 16,058<br />
Green - - - - - - - 8,330 8,330<br />
Wood - - - - - - - 4,385 4,385<br />
Fridges - - - - - - - 391 391<br />
Other - - - - - - - 3,122 3,122<br />
Rejected wood - - - - - - - 262 262<br />
Sub-total - - - - - - - 32,548 32,548
OTHER (THIRD PARTY)<br />
Paper and card - - - - - - - - -<br />
Glass - - - - - - - - -<br />
Cans - - - - - - - - -<br />
Plastic - - - - - - - - -<br />
Textiles - - - - - - - - -<br />
Shoes - - - - - - - - -<br />
Green - - - - - - - - -<br />
Scrap metal - - - - - - - - -<br />
Sub-total - - - - - - - - -<br />
OTHER RECYCLING (DIGESTER OUTPUT)<br />
Light plastic - - - - - - - - 240<br />
Dense plastic - - - - - - - - 11<br />
Shredded textile - - - - - - - - 662<br />
Ferrous metals - - - - - - - - 1,158<br />
Secondary ferrous metals - - - - - - - - 42<br />
Non-ferrous metals - - - - - - - - 69<br />
Glass - - - - - - - - 1,379<br />
Process loss - - - - - - - - 9,842<br />
Sub-total - - - - - - - - 13,402<br />
TOTAL RECYCLING 4,157 6,605 1,813 5,900 5,643 6,344 4,663 32,548 81,074
Table B3.3 <strong>Waste</strong> Disposal: 2006/07 (tonnes)<br />
Chester-le-Street <strong>Durham</strong> City Derwentside Easington Sedgefield Teesdale Wear Valley HWRC TOTALS<br />
HOUSEHOLD RESIDUAL<br />
to Landfill (Joint Stocks) 7 11,909 - 3,488 923 288 3,777 - 20,392<br />
to WTS 20,086 18,195 32,469 39,172 35,073 9,128 19,269 - 173,392<br />
of which to landfill 17,306 13,430 27,446 27,641 30,261 8,817 15,874 - 140,774<br />
of which to Digester 2,780 4,765 5,023 11,532 4,812 310 3,395 - 32,618<br />
of which is residue to<br />
landfill<br />
- - - - - - -<br />
- 19,216<br />
Sub-total 180,382<br />
HWRC RESIDUAL<br />
to Landfill (Joint Stocks) - - - - - - - 22,578 22,578<br />
to WTS (then landfill) - - - - - - - 8,946 8,946<br />
Sub-total - - - - - - - 31,524 31,524<br />
NON-HOUSEHOLD RESIDUAL<br />
to Landfill (Todhills & Joint<br />
Stocks) 1,050 1,141 1,126 775 677 22 676 - 5,467<br />
to WTS (then landfill) 912 0 2,304 2,460 2,088 564 - - 8,328<br />
to WTS (then digester) - - - - - - - - -<br />
Sub-total 1,962 1,141 3,430 3,235 2,765 586 676 0 13,795<br />
TOTAL DISPOSAL 1,962 1,141 3,430 3,235 2,765 586 676 31,524 225,701
Annex C<br />
Household <strong>Waste</strong> Recycling<br />
Centres: <strong>Waste</strong> Arisings
C1 HWRC WASTE ARISINGS: 2008/09<br />
Table C1.1 HWRC <strong>Waste</strong> Arisings: 2008/09 (tonnes)<br />
Broomsdene<br />
Cragwood<br />
Hett Hills<br />
Middleton<br />
Stainton<br />
Grove<br />
Annfield<br />
Plain<br />
Large WEEE 36 3 27 3 6 28 15 11 10 26 3 16 4 3 9 201<br />
Small WEEE 51 10 12 13 4 37 19 24 32 65 13 5 6 6 21 319<br />
Heavy steel 29 19 29 0 1 0 0 0 0 0 0 9 18 0 0 105<br />
Light steel 80 31 29 7 18 130 102 117 51 303 178 140 90 99 124 1,498<br />
Lead 0 0 0 0 0 0 0 0 0 3 0 0 0 0 0 4<br />
Brass 1 1 3 0 0 0 1 1 0 4 0 0 1 1 1 15<br />
Copper 1 1 2 0 0 2 4 0 0 11 0 2 6 1 4 35<br />
Stainless steel 0 2 0 0 0 1 1 0 1 3 0 1 1 1 1 12<br />
Aluminium 2 2 3 0 0 1 5 2 1 15 0 3 5 3 5 47<br />
Cardboard 0 0 0 0 0 116 90 146 134 228 150 143 0 0 104 1,110<br />
Batteries 7 0 0 0 0 5 3 1 0 0 0 0 0 0 0 16<br />
Cans 0 0 0 8 0 0 0 2 0 8 0 0 0 0 2 20<br />
Gas Bottles 3 0 4 1 0 2 1 0 3 3 1 3 4 1 0 25<br />
Glass 0 0 0 26 0 10 13 22 17 31 34 15 16 10 21 215<br />
Paper 5 0 2 19 0 13 24 59 35 102 30 29 35 3 49 406<br />
TVs & Monitors 65 31 35 0 0 45 29 64 35 112 42 48 40 19 22 588<br />
Oil 8 0 10 0 0 4 7 5 6 7 8 6 7 8 8 84<br />
Fridges 42 14 35 0 0 34 15 38 9 28 20 16 34 24 18 327<br />
Textiles 17 0 0 0 0 20 20 18 0 30 0 13 12 0 17 147<br />
Shoes 5 0 1 0 0 3 1 1 2 3 1 0 1 3 1 21<br />
Fluorescent tubes 1 0 0 0 0 0 0 0 1 1 0 0 0 0 0 4<br />
Bric-a-brac 145 0 0 0 0 5 0 15 0 0 0 0 0 0 0 166<br />
Tyres 42 3 34 0 0 15 26 11 16 25 23 18 29 26 21 290<br />
Cartons 0 0 0 0 0 0 0 0 0 1 0 0 0 0 0 2<br />
Bikes 0 0 0 0 0 1 0 0 0 0 0 0 0 0 0 1<br />
Green waste 625 0 903 0 0 638 643 799 453 1,999 918 407 357 552 829 9,122<br />
Timber 133 0 78 0 0 362 239 415 446 382 317 583 265 272 169 3,661<br />
Soil & rubble 1,053 351 1,069 0 0 1,022 1,161 1,074 1,137 1,233 1,326 1,482 998 1,206 1,293 14,406<br />
Total Recycled 2,349 469 2,276 78 30 2,497 2,421 2,827 2,388 4,620 3,064 2,941 1,929 2,238 2,720 32,846<br />
Total Landfill 3,642 1,507 5,224 606 1,341 1,999 1,806 1,618 930 2,226 1,787 1,633 1,037 1,882 1,928 29,168<br />
Total 5,991 1,976 7,501 684 1,371 4,496 4,227 4,444 3,318 6,846 4,852 4,574 2,966 4,120 4,648 62,014<br />
Coxhoe<br />
Heighington<br />
Lane<br />
Horden<br />
Potterhouse<br />
Romanway<br />
Seaham<br />
Thornley<br />
Todhills<br />
Tudhoe<br />
TOTAL
Table C1.2 HWRC <strong>Waste</strong> Arisings: 2007/08 (tonnes)<br />
Broomsdene<br />
Cragwood<br />
Hett Hills<br />
Middleton<br />
Stainton<br />
Grove<br />
Annfield<br />
Plain<br />
Large WEEE 15 0 0 0 0 7 3 5 0 10 0 0 0 0 0 40<br />
Small WEEE 14 3 1 1 0 3 1 8 4 15 3 0 2 2 3 59<br />
Heavy steel 51 32 32 0 14 0 0 0 0 0 0 6 20 3 0 158<br />
Light steel 137 36 32 3 21 163 137 183 83 392 124 210 112 126 164 1,921<br />
Lead 1 1 0 0 0 0 0 0 0 1 0 0 0 0 1 5<br />
Brass 1 1 4 0 1 1 1 1 2 4 0 1 3 1 2 23<br />
Copper 2 1 2 0 1 5 5 0 2 13 0 2 5 1 5 45<br />
Stainless steel 1 2 0 0 1 1 1 1 2 3 0 1 2 1 1 16<br />
Aluminium 3 3 3 0 1 4 6 3 8 17 0 3 4 4 6 65<br />
Cardboard 0 0 0 0 0 68 93 201 160 304 95 140 39 0 137 1,239<br />
Batteries 3 0 0 0 0 4 3 2 0 3 0 2 2 0 0 20<br />
Cans 4 0 0 0 0 2 1 0 0 0 0 1 0 0 2 9<br />
Gas Bottles 0 0 0 6 0 0 0 33 0 0 0 0 0 0 32 71<br />
Glass 4 1 4 0 0 0 3 1 3 4 0 2 2 1 0 25<br />
Paper 0 0 0 24 0 0 15 86 24 55 0 34 31 0 73 341<br />
TVs & Monitors 6 0 5 21 0 11 16 49 43 111 12 15 34 3 52 379<br />
Oil 82 38 33 0 2 54 43 83 52 168 39 56 38 54 47 789<br />
Fridges 9 0 11 0 0 5 9 10 7 10 4 6 10 10 9 99<br />
Textiles 42 14 37 5 12 29 18 31 12 42 13 18 15 26 22 336<br />
Shoes 18 0 0 0 0 16 18 30 2 38 0 0 8 4 24 159<br />
Fluorescent tubes 5 0 1 0 0 0 1 2 2 6 1 0 1 3 1 22<br />
Bric-a-brac 0 0 0 0 0 0 0 1 1 0 0 0 0 0 0 3<br />
Tyres 185 0 0 0 0 0 0 25 0 0 0 0 0 0 0 210<br />
Cartons 17 0 26 0 0 24 17 16 10 21 12 17 17 24 16 217<br />
Bikes 0 0 0 0 0 0 0 0 0 0 0 0 0 0 0 1<br />
Green waste 607 0 807 1 0 628 608 910 496 1,941 370 475 372 595 782 8,593<br />
Timber 20 0 20 0 0 138 196 343 193 268 143 211 209 309 181 2,232<br />
Soil & rubble 1,087 372 1,126 0 0 1,164 1,159 1,412 1,323 1,443 683 1,656 1,063 1,374 1,402 15,263<br />
Total Recycled 2,315 502 2,143 59 53 2,327 2,355 3,438 2,428 4,870 1,500 2,858 1,989 2,543 2,960 32,342<br />
Total Landfill 4,220 1,991 5,046 726 1,502 2,586 1,822 2,083 1,279 2,986 1,229 2,051 1,203 2,290 2,165 33,180<br />
Total 6,536 2,494 7,189 785 1,556 4,914 4,177 5,521 3,706 7,856 2,729 4,909 3,193 4,833 5,125 65,523<br />
Coxhoe<br />
Heighington<br />
Lane<br />
Horden<br />
Potterhouse<br />
Romanway<br />
Seaham<br />
Thornley<br />
Todhills<br />
Tudhoe<br />
TOTAL
Table C1.3 HWRC <strong>Waste</strong> Arisings: 2006/07 (tonnes)<br />
Broomsdene<br />
Cragwood<br />
Hett Hills<br />
Middleton<br />
Stainton<br />
Grove<br />
Annfield<br />
Plain<br />
Coxhoe<br />
Large WEEE 0 0 0 0 0 0 0 0 0 0 0 0 0 0 0 0<br />
Small WEEE 0 0 0 0 0 0 0 0 0 0 0 0 0 0 0 0<br />
Heavy steel 66 29 23 0 14 9 16 0 9 50 2 1 18 19 18 274<br />
Light steel 180 33 58 0 7 192 156 170 93 302 179 237 116 80 155 1,956<br />
Lead 3 0 0 0 0 0 0 0 2 2 0 0 2 0 0 11<br />
Brass 3 1 2 0 1 1 2 1 2 6 0 2 20 1 3 45<br />
Copper 2 2 4 0 2 2 5 1 3 13 1 3 30 1 5 74<br />
Stainless steel 3 3 2 0 1 1 1 0 2 4 0 1 15 1 1 35<br />
Aluminium 4 2 3 0 3 3 7 1 9 17 1 3 10 3 6 73<br />
Cardboard 0 0 0 0 0 77 93 161 129 279 146 132 0 0 121 1,139<br />
Batteries 19 2 0 0 8 9 7 4 5 20 0 3 4 1 8 91<br />
Cans 0 0 0 6 0 0 0 25 1 3 0 1 1 0 20 55<br />
Gas Bottles 1 1 3 0 0 0 3 2 5 5 2 10 4 3 1 39<br />
Glass 0 0 0 20 0 0 13 54 30 59 1 37 39 0 28 280<br />
Paper 2 0 2 16 3 14 11 48 26 92 14 27 13 5 25 299<br />
TVs & Monitors 87 15 28 0 0 51 47 66 52 148 31 54 38 46 46 709<br />
Oil 4 0 3 0 0 1 6 6 3 7 7 8 8 4 2 59<br />
Fridges 58 11 49 8 10 34 21 22 16 48 25 19 13 28 19 381<br />
Textiles 17 0 2 0 0 14 18 23 6 24 0 20 16 1 23 164<br />
Shoes 4 0 2 0 0 1 1 1 2 4 1 0 0 4 1 21<br />
Fluorescent tubes 0 0 0 0 0 0 0 0 0 0 0 0 0 0 0 1<br />
Bric-a-brac 168 0 0 0 0 0 0 33 11 0 0 0 0 0 0 211<br />
Tyres 22 1 30 0 0 20 23 12 17 20 31 18 24 27 17 262<br />
Cartons 0<br />
Bikes 0<br />
Green waste 453 1 716 0 1 597 515 782 478 1,989 805 454 314 505 719 8,330<br />
Timber 149 0 171 5 0 172 266 363 591 1,071 295 588 245 400 213 4,529<br />
Soil & rubble 949 362 1,190 0 0 1,324 1,159 1,260 1,452 1,400 1,350 1,594 1,242 1,474 1,275 16,032<br />
Total Recycled 2,193 464 2,287 55 51 2,524 2,370 3,034 2,943 5,562 2,891 3,212 2,174 2,603 2,707 35,071<br />
Total Landfill 3,484 1,523 4,912 672 1,502 2,010 1,813 1,647 1,017 2,483 2,421 1,357 1,110 1,925 2,188 30,065<br />
Total 5,677 1,987 7,200 727 1,553 4,534 4,184 4,681 3,960 8,045 5,311 4,569 3,284 4,528 4,896 65,136<br />
Heighington<br />
Lane<br />
Horden<br />
Potterhouse<br />
Romanway<br />
Seaham<br />
Thornley<br />
Todhills<br />
Tudhoe<br />
TOTAL
Table C1.4 HWRC <strong>Waste</strong> Arisings: 2005/06 (tonnes)<br />
Broomsdene<br />
Cragwood<br />
Hett Hills<br />
Middleton<br />
Stainton<br />
Grove<br />
Annfield<br />
Plain<br />
Coxhoe<br />
Large WEEE 0 0 0 0 0 0 0 0 0 0 0 0 0 0 0 0<br />
Small WEEE 0 0 0 0 0 0 0 0 0 0 0 0 0 0 0 0<br />
Heavy steel 96 38 26 0 12 21 0 0 16 68 22 0 7 15 28 348<br />
Light steel 273 41 63 0 3 151 304 205 125 374 116 227 103 87 280 2,352<br />
Lead 1 0 0 0 0 0 1 0 1 1 0 0 0 0 1 6<br />
Brass 2 0 2 0 1 1 1 1 3 6 0 1 1 1 2 22<br />
Copper 3 1 1 0 0 1 1 1 3 9 0 4 1 1 2 27<br />
Stainless steel 1 1 0 0 0 1 1 1 0 3 0 1 0 1 1 11<br />
Aluminium 6 1 6 0 0 3 5 2 5 16 0 4 1 4 6 60<br />
Cardboard 0 0 0 0 0 102 84 137 128 266 141 99 0 0 99 1,056<br />
Batteries 17 4 0 0 2 7 9 2 9 21 0 13 1 9 12 105<br />
Cans 0 0 0 0 0 0 0 30 0 2 0 0 0 0 29 61<br />
Gas Bottles 0 0 2 0 0 0 2 2 4 5 1 2 5 2 2 27<br />
Glass 0 0 0 0 0 4 6 70 30 48 0 46 26 0 56 285<br />
Paper 5 0 4 0 0 10 6 32 0 81 14 8 6 5 13 184<br />
TVs & Monitors 30 2 21 2 4 20 16 34 24 64 40 22 24 22 21 346<br />
Oil 1 0 2 0 0 0 3 4 4 5 1 3 2 3 4 31<br />
Fridges 54 8 57 4 13 32 15 18 20 41 21 18 15 19 16 351<br />
Textiles 7 0 0 0 0 2 12 17 18 0 0 2 4 5 9 76<br />
Shoes 3 0 0 0 0 1 1 1 1 4 1 0 1 2 1 16<br />
Fluorescent tubes<br />
Bric-a-brac 130 0 0 0 0 0 0 24 27 21 0 0 0 0 0 201<br />
Tyres 26 0 20 0 0 15 21 2 13 21 27 15 22 25 11 217<br />
Cartons<br />
Bikes<br />
Green waste 356 0 710 0 0 484 600 813 558 1,941 844 470 267 485 706 8,234<br />
Timber 150 7 211 0 3 359 250 613 530 1,044 309 537 337 503 203 5,055<br />
Soil & rubble 858 398 1,261 0 0 1,059 1,102 1,304 1,173 1,361 1,468 1,488 1,105 1,364 1,170 15,110<br />
Total Recycled 2,018 499 2,385 6 38 2,273 2,440 3,312 2,691 5,400 3,004 2,959 1,927 2,555 2,672 34,181<br />
Total Landfill 3,430 1,748 5,159 642 1,585 1,410 1,635 1,413 978 2,113 2,342 1,303 1,169 1,500 1,834 28,261<br />
Total 5,448 2,247 7,544 648 1,623 3,683 4,075 4,725 3,669 7,513 5,346 4,262 3,096 4,055 4,506 62,442<br />
Heighington<br />
Lane<br />
Horden<br />
Potterhouse<br />
Romanway<br />
Seaham<br />
Thornley<br />
Todhills<br />
Tudhoe<br />
TOTAL
Table C1.5 HWRC <strong>Waste</strong> Arisings: 2004/05 (tonnes)<br />
Broomsdene<br />
Brown Houses<br />
Butsfield<br />
Cragwood<br />
Hett Hills<br />
Middleton<br />
Stainton Grove<br />
Annfield Plain<br />
Large WEEE 0 0 0 0 0 0 0 0 0 0 0 0 0 0 0 0<br />
Small WEEE 0 0 0 0 0 0 0 0 0 0 0 0 0 0 0 0<br />
Heavy steel 88 27 7 35 27 0 10 70 2 0 7 86 15 3 36 53 0 464<br />
Light steel 342 28 20 25 106 0 2 217 265 253 233 434 101 330 139 192 319 3,006<br />
Lead 1 1 0 0 0 0 0 0 0 0 4 1 0 1 0 0 0 10<br />
Brass 2 1 0 0 5 0 0 2 3 1 4 5 0 1 2 1 3 30<br />
Copper 3 2 0 1 5 0 1 5 3 1 5 9 0 3 2 3 3 45<br />
Stainless steel 1 1 0 3 0 0 0 1 2 1 1 3 0 1 0 1 1 16<br />
Aluminium 5 2 0 2 8 0 1 4 7 3 8 19 0 5 8 6 6 84<br />
Cardboard 0 0 0 0 0 0 0 91 83 147 122 351 119 107 0 9 101 1,130<br />
Batteries 14 3 1 5 9 0 0 3 6 6 10 20 1 8 11 5 21 122<br />
Cans 0 0 0 0 0 0 0 0 0 19 0 0 0 0 0 0 14 33<br />
Gas Bottles 0 0 1 0 2 0 0 4 1 4 5 5 8 3 8 4 6 52<br />
Glass 0 0 0 0 0 0 0 10 0 47 45 45 0 32 28 0 27 232<br />
Paper 5 0 0 0 4 0 0 15 6 11 0 6 8 0 6 8 14 83<br />
TVs & Monitors 0 0 0 0 0 0 0 0 0 0 0 0 0 0 0 0 0 0<br />
Oil 4 0 0 0 3 0 0 9 2 4 2 10 4 5 1 7 4 54<br />
Fridges 68 13 15 16 66 10 17 35 27 32 26 47 35 34 27 24 23 515<br />
Textiles 12 3 0 0 0 0 0 2 0 15 26 4 0 2 19 1 0 84<br />
Shoes 1 0 0 0 0 0 0 1 0 0 1 2 0 0 0 1 0 8<br />
Fluorescent tubes<br />
Bric-a-brac 121 0 0 0 0 0 0 58 0 21 13 122 0 0 38 3 0 376<br />
Tyres 10 0 0 0 15 0 0 14 12 0 14 14 19 8 24 21 6 157<br />
Cartons<br />
Bikes<br />
Green waste 12 0 0 0 649 0 0 758 866 1,107 1,031 2,255 1,384 797 403 493 739 10,496<br />
Timber 15 0 0 0 309 0 0 569 427 798 639 1,327 366 1,079 584 546 235 6,894<br />
Soil & rubble 1,557 0 0 470 1,494 0 12 1,674 1,904 1,663 1,933 1,767 2,293 2,618 2,275 1,624 1,714 22,998<br />
Total Recycled 2,259 81 45 557 2,702 10 42 3,541 3,617 4,134 4,130 6,532 4,354 5,037 3,612 3,002 3,235 46,888<br />
Total Landfill 4,794 1,949 2,061 2,333 6,583 925 2,331 953 2,317 1,950 1,989 2,048 3,092 2,033 1,881 1,699 2,433 41,370<br />
Total 6,053 2,030 2,106 2,890 9,285 935 2,373 4,493 5,934 6,083 6,119 8,580 7,446 7,069 5,493 4,701 5,669 88,259<br />
Coxhoe<br />
Heighington<br />
Lane<br />
Horden<br />
Potterhouse<br />
Romanway<br />
Seaham<br />
Thornley<br />
Todhills<br />
Tudhoe<br />
TOTAL
Annex D<br />
<strong>Waste</strong> Treatment and<br />
Disposal Data
D1 TREATED WASTE<br />
Table D1.1 <strong>Waste</strong> Treated at the Aerobic Digestion Facility – Thornley (tonnes)<br />
2004/05 2005/06 2006/07 2007/08 2008/09<br />
TOTAL input into digester from Thornley WTS - 28,651 32,618 40,789 -<br />
TOTAL output from digester - 28,471 32,618 40,789 -<br />
recycled Light Plastic - 61 240 84 -<br />
recycled Dense Plastic - - 11 37 -<br />
ferrous metals - 1,166 1,158 1,672 -<br />
secondary Ferrous metals - 104 42 - -<br />
non-Ferrous metals - 62 69 23 -<br />
glass - 1,321 1,379 2,266 -<br />
shredded textile - - - 2,029 -<br />
soil conditioner - 9,078 9,973 13,497 -<br />
water loss - 4,922 9,842 5,475 -<br />
to landfill - contrary & cover materials - 11,756 9,906 15,705 -<br />
to reprocessor - diverted BMW - 16,715 22,713 4,082 -<br />
to reprocessor - non-diverted BMW<br />
Note:<br />
- - - 21,002 -<br />
1. Due to technical reasons <strong>Durham</strong> <strong>County</strong> could claim diversion only <strong>for</strong> metals, glass and plastics in 2007-08.<br />
2. Due to regulator issues, the digester was non-operational in 2008/09.
D2 LANDFILL DISPOSAL<br />
Table D2.1 Landfill Inputs: 2004/05 to 2008/09 (tonnes)<br />
2004/05 2005/06 2006/07 2007/08 2008/09<br />
from HWRC 24,398 21,161 21,113 21,113 22,600<br />
from WCA collection 54,686 23,983 20,388 20,539 9,401<br />
from Digestor (residue) - 11,756 9,906 15,705 -<br />
from WTS 172,705 139,859 149,719 130,857 164,568<br />
from Thornley 51,743 23,345 18,719 8,756 44,265<br />
from Annfield 76,332 67,316 71,757 63,969 61,562<br />
from Stainton Grove 4,039 9,304 9,088 7,695 8,206<br />
from Heighington Lane 40,592 39,894 50,156 50,438 50,535<br />
TOTAL MSW to landfill 251,789 196,759 201,126 188,215 196,570<br />
NB. Residual waste received at Thornley is <strong>for</strong>warded onto landfill and to aerobic digestion. All residual waste from Annfield, Stainton Grove and Heighington Lane is<br />
<strong>for</strong>warded onto to landfill.
Annex E<br />
Materials Capture Analysis
E1 DURHAM COUNTY: MATERIAL CAPTURE ANALYSIS<br />
E1.1 MATERIALS CAPTURE ANALYSIS<br />
A materials capture analysis was undertaken using <strong>Durham</strong> <strong>County</strong>’s 2008/09<br />
data in con<strong>for</strong>mance with Defra MSWM guidance (1) to develop an<br />
understanding of the potential additional materials that might be available <strong>for</strong><br />
recycling from the different waste streams and, hence, to help in<strong>for</strong>m future<br />
potential changes in systems <strong>for</strong> collecting recyclables and compostables.<br />
A materials capture rate analysis is primarily a tool which can:<br />
• demonstrate existing per<strong>for</strong>mance levels, and potential improvements that<br />
can be gained from improving per<strong>for</strong>mance in respect of already targeted<br />
materials;<br />
• quantify the potential recycling available from materials currently not<br />
being targeted;<br />
• make appropriate comparisons between waste collection systems in<br />
different collection authorities to help understand why per<strong>for</strong>mance<br />
varies; and<br />
• identify which materials should be targeted <strong>for</strong> future campaigns and<br />
initiatives.<br />
This analysis will help to in<strong>for</strong>m priorities <strong>for</strong> which services should be<br />
changed, the impact of changes on both recycling and composting<br />
per<strong>for</strong>mance, and the consequent contribution to the diversion of waste from<br />
landfill.<br />
E1.1.1 Approach to Capture Analysis<br />
Stage 1: Material Potentially Available<br />
<strong>Waste</strong> composition figures were applied to waste arisings data to estimate the<br />
amount of material available in the waste stream. It should be noted that<br />
these were mapped as practically as possible, but allowances should be made<br />
when interpreting the data as similar materials are often bunched together<br />
such as paper and card etc.<br />
Stage 2: Comparison with Tonnages Recycled<br />
The second stage compared the tonnages potentially available with the<br />
tonnages of materials recycled. Data on the type and weight of materials<br />
(1) Defra (2006) A Practice Guide <strong>for</strong> the Development of <strong>Municipal</strong> <strong>Waste</strong> <strong>Management</strong> Strategies, In<strong>for</strong>mation Sheet 7,<br />
Material Capture Analysis. Defra, London.
collected by different collection services were collated at a <strong>County</strong> and district<br />
level.<br />
Stage 3: Material Remaining<br />
In order to estimate the materials remaining in the waste stream, the<br />
quantities of the materials collected were subtracted from those that are<br />
available within the waste stream.<br />
Stage 4: Percentage of Material Captured<br />
The percentage capture rate was calculated by dividing the material recycled<br />
by the material available.
Table E1.1 Material Capture Rates (%) <strong>for</strong> Former Districts<br />
Primary category Sub-category Chester le<br />
Paper and card<br />
Plastic film<br />
Dense plastic<br />
Textiles<br />
Misc. combustible<br />
Misc. noncombustible<br />
Glass<br />
Ferrous metal<br />
Non-ferrous metal<br />
Putrescibles<br />
Street<br />
Derwentside<br />
District Current Capture Rates<br />
Newspapers and magazines<br />
Directories and catalogues NO<br />
53% 94% 67% 61% 52% 67% 65%<br />
Yellow Pages 43% 86% 68% 35% 22% 78% 49%<br />
Junk mail and other recyclable paper 12% 38% 12% 14% 11% 17% 22%<br />
Wall paper/non-recyclable paper 2% 5% 4% 3% 3% 3% 4%<br />
Liquid Cartons 2% 0% 0% 0% 0% 0% 3%<br />
Cardboard non-corrugated 0% 0% 0% 0% 0% 0% 0%<br />
Cardboard corrugated 0% 0% 0% 0% 0% 0% 0%<br />
Refuse sacks and other plastic film 0% 0% 0% 0% 0% 0% 0%<br />
Carrier bags 0% 0% 0% 0% 0% 0% 0%<br />
PET bottles 15% 46% 17% 14% 14% 13% 0%<br />
HDPE bottles 0% 0% 0% 0% 0% 0% 0%<br />
Other plastic packaging 15% 29% 17% 14% 14% 7% 0%<br />
Polystyrene 0% 0% 0% 0% 0% 0% 0%<br />
Hard plastic 15% 26% 17% 14% 14% 6% 0%<br />
Clothes 28% 41% 35% 40% 26% 32% 50%<br />
Other textiles 0% 0% 0% 0% 0% 0% 0%<br />
Shoes 5% 1% 1% 2% 0% 3% 5%<br />
Non treated wood 0% 0% 0% 0% 0% 0% 0%<br />
Treated wood 0% 0% 0% 0% 0% 0% 0%<br />
Kitchen units 0% 0% 0% 0% 0% 0% 0%<br />
Other wood furniture 0% 0% 0% 0% 0% 0% 0%<br />
Non wood furniture 0% 0% 0% 0% 0% 0% 0%<br />
Carpet, underlay & carpet floor tiles 0% 0% 0% 0% 0% 0% 0%<br />
Disposable nappies 0% 0% 0% 0% 0% 0% 0%<br />
Other combustible 0% 0% 0% 0% 0% 0% 0%<br />
DIY rubble 0% 0% 0% 0% 0% 0% 0%<br />
Plasterboard 0% 0% 0% 0% 0% 0% 0%<br />
Other non combustible 0% 0% 0% 0% 0% 0% 0%<br />
Brown glass containers 66% 77% 75% 66% 62% 69% 64%<br />
Green glass containers 67% 77% 76% 67% 63% 70% 65%<br />
Clear glass containers 42% 55% 52% 41% 38% 45% 39%<br />
Blue glass containers 0% 0% 0% 0% 0% 0% 0%<br />
Non packaging glass 36% 34% 38% 7% 29% 38% 26%<br />
Ferrous food and beverage cans 37% 38% 55% 44% 43% 49% 32%<br />
Aerosols 15% 16% 27% 19% 18% 22% 12%<br />
Other ferrous 7% 7% 21% 8% 8% 9% 6%<br />
Non ferrous food and beverage cans 41% 42% 59% 47% 47% 53% 35%<br />
Aerosols 0% 0% 0% 0% 0% 0% 0%<br />
Foil 16% 16% 28% 19% 19% 23% 12%<br />
Other non ferrous 2% 3% 5% 3% 3% 4% 2%<br />
Raw fruit and vegetable matter 0% 0% 0% 0% 0% 0% 0%<br />
Cooked and prepared food 0% 0% 0% 0% 0% 0% 0%<br />
Garden waste 0% 38% 0% 77% 15% 0% 50%<br />
Soil 0% 0% 0% 0% 0% 0% 0%<br />
Other putrescibles 0% 0% 0% 0% 0% 0% 0%<br />
Fines
Figure E1.1 Chester-le-Street: Captured and Available Materials (Tonnage): 2008/09<br />
Material<br />
Hazardous<br />
WEEE<br />
Fines<br />
Other putrescibles<br />
Soil<br />
Garden waste<br />
Cooked & prepared food<br />
Raw fruit & vegetable matter<br />
Other non ferrous<br />
Foil<br />
Non-Ferrous Aerosols<br />
Non ferrous cans<br />
Other ferrous<br />
Ferrous Aerosols<br />
Ferrous cans<br />
Non packaging glass<br />
Clear glass<br />
Green glass<br />
Brown glass<br />
Other non combustible<br />
Disposable nappies<br />
Other wood furniture<br />
Treated wood<br />
Non treated wood<br />
Shoes<br />
Other textiles<br />
Clothes<br />
Hard plastic<br />
Polystyrene<br />
Other plastic packaging<br />
Plastic bottles<br />
Refuse sacks & other plastic film<br />
Cardboard<br />
Liquid Cartons<br />
Wall paper/non-recyclable paper<br />
Junk mail & other recyclable paper<br />
Directories & catalogues<br />
Newspapers & magazines<br />
Material in Hhd waste Hhd Recycled Available Material<br />
0 500 1,000 1,500 2,000 2,500 3,000 3,500<br />
Arisings (Tonnes)
Figure E1.2 Derwentside: Captured and Available Materials (Tonnage): 2008/09<br />
Material<br />
Hazardous<br />
WEEE<br />
Fines<br />
Other putrescibles<br />
Soil<br />
Garden waste<br />
Cooked & prepared food<br />
Raw fruit & vegetable matter<br />
Other non ferrous<br />
Foil<br />
Non-Ferrous Aerosols<br />
Non ferrous cans<br />
Other ferrous<br />
Ferrous Aerosols<br />
Ferrous cans<br />
Non packaging glass<br />
Clear glass<br />
Green glass<br />
Brown glass<br />
Other non combustible<br />
Disposable nappies<br />
Other wood furniture<br />
Treated wood<br />
Non treated wood<br />
Shoes<br />
Other textiles<br />
Clothes<br />
Hard plastic<br />
Polystyrene<br />
Other plastic packaging<br />
Plastic bottles<br />
Refuse sacks & other plastic film<br />
Cardboard<br />
Liquid Cartons<br />
Wall paper/non-recyclable paper<br />
Junk mail & other recyclable paper<br />
Directories & catalogues<br />
Newspapers & magazines<br />
Material in Hhd <strong>Waste</strong> Hhd Recycled Available Material<br />
0 1,000 2,000 3,000 4,000 5,000 6,000<br />
Arisings (Tonnes)
Figure E1.3 <strong>Durham</strong> City: Captured and Available Materials (Tonnage): 2008/09<br />
Material<br />
Hazardous<br />
WEEE<br />
Fines<br />
Other putrescibles<br />
Soil<br />
Garden waste<br />
Cooked & prepared food<br />
Raw fruit & vegetable matter<br />
Other non ferrous<br />
Foil<br />
Non-Ferrous Aerosols<br />
Non ferrous cans<br />
Other ferrous<br />
Ferrous Aerosols<br />
Ferrous cans<br />
Non packaging glass<br />
Clear glass<br />
Green glass<br />
Brown glass<br />
Other non combustible<br />
Disposable nappies<br />
Other wood furniture<br />
Treated wood<br />
Non treated wood<br />
Shoes<br />
Other textiles<br />
Clothes<br />
Hard plastic<br />
Polystyrene<br />
Other plastic packaging<br />
Plastic bottles<br />
Refuse sacks & other plastic film<br />
Cardboard<br />
Liquid Cartons<br />
Wall paper/non-recyclable paper<br />
Junk mail & other recyclable paper<br />
Directories & catalogues<br />
Newspapers & magazines<br />
Material in Hhd waste Hhd Recycled Available Material<br />
0 500 1,000 1,500 2,000 2,500 3,000 3,500 4,000 4,500 5,000<br />
Arisings (Tonnes)
Figure E1.4 Easington: Captured and Available Materials (Tonnage): 2008/09<br />
Material<br />
Hazardous<br />
WEEE<br />
Fines<br />
Other putrescibles<br />
Soil<br />
Garden waste<br />
Cooked & prepared food<br />
Raw fruit & vegetable matter<br />
Other non ferrous<br />
Foil<br />
Non-Ferrous Aerosols<br />
Non ferrous cans<br />
Other ferrous<br />
Ferrous Aerosols<br />
Ferrous cans<br />
Non packaging glass<br />
Clear glass<br />
Green glass<br />
Brown glass<br />
Other non combustible<br />
Disposable nappies<br />
Other wood furniture<br />
Treated wood<br />
Non treated wood<br />
Shoes<br />
Other textiles<br />
Clothes<br />
Hard plastic<br />
Polystyrene<br />
Other plastic packaging<br />
Plastic bottles<br />
Refuse sacks & other plastic film<br />
Cardboard<br />
Liquid Cartons<br />
Wall paper/non-recyclable paper<br />
Junk mail & other recyclable paper<br />
Directories & catalogues<br />
Newspapers & magazines<br />
Material in Hhd <strong>Waste</strong> Hhd Recycled Available Material<br />
0 1,000 2,000 3,000 4,000 5,000 6,000 7,000<br />
Arisings (Tonnes)
Figure E1.5 Sedgefield: Captured and Available Materials (Tonnage): 2008/09<br />
Material<br />
Hazardous<br />
WEEE<br />
Fines<br />
Other putrescibles<br />
Soil<br />
Garden waste<br />
Cooked & prepared food<br />
Raw fruit & vegetable matter<br />
Other non ferrous<br />
Foil<br />
Non-Ferrous Aerosols<br />
Non ferrous cans<br />
Other ferrous<br />
Ferrous Aerosols<br />
Ferrous cans<br />
Non packaging glass<br />
Clear glass<br />
Green glass<br />
Brown glass<br />
Other non combustible<br />
Disposable nappies<br />
Other wood furniture<br />
Treated wood<br />
Non treated wood<br />
Shoes<br />
Other textiles<br />
Clothes<br />
Hard plastic<br />
Polystyrene<br />
Other plastic packaging<br />
Plastic bottles<br />
Refuse sacks & other plastic film<br />
Cardboard<br />
Liquid Cartons<br />
Wall paper/non-recyclable paper<br />
Junk mail & other recyclable paper<br />
Directories & catalogues<br />
Newspapers & magazines<br />
Material in Hhd <strong>Waste</strong> Hhd Recycled Available Material<br />
0 500 1,000 1,500 2,000 2,500 3,000 3,500 4,000 4,500 5,000<br />
Arisings (Tonnes)
Figure E1.6 Teesdale: Captured and Available Materials (Tonnage): 2008/09<br />
Material<br />
Hazardous<br />
WEEE<br />
Fines<br />
Other putrescibles<br />
Soil<br />
Garden waste<br />
Cooked & prepared food<br />
Raw fruit & vegetable matter<br />
Other non ferrous<br />
Foil<br />
Non-Ferrous Aerosols<br />
Non ferrous cans<br />
Other ferrous<br />
Ferrous Aerosols<br />
Ferrous cans<br />
Non packaging glass<br />
Clear glass<br />
Green glass<br />
Brown glass<br />
Other non combustible<br />
Disposable nappies<br />
Other wood furniture<br />
Treated wood<br />
Non treated wood<br />
Shoes<br />
Other textiles<br />
Clothes<br />
Hard plastic<br />
Polystyrene<br />
Other plastic packaging<br />
Plastic bottles<br />
Refuse sacks & other plastic film<br />
Cardboard<br />
Liquid Cartons<br />
Wall paper/non-recyclable paper<br />
Junk mail & other recyclable paper<br />
Directories & catalogues<br />
Newspapers & magazines<br />
Material in Hhd <strong>Waste</strong> Hhd Recycled Available Material<br />
0 500 1,000 1,500 2,000 2,500<br />
Arisings (Tonnes)
Figure E1.7 Wear Valley: Captured and Available Materials (Tonnage): 2008/09<br />
Material<br />
Hazardous<br />
WEEE<br />
Fines<br />
Other putrescibles<br />
Soil<br />
Garden waste<br />
Cooked & prepared food<br />
Raw fruit & vegetable matter<br />
Other non ferrous<br />
Foil<br />
Non-Ferrous Aerosols<br />
Non ferrous cans<br />
Other ferrous<br />
Ferrous Aerosols<br />
Ferrous cans<br />
Non packaging glass<br />
Clear glass<br />
Green glass<br />
Brown glass<br />
Other non combustible<br />
Other wood furniture<br />
Treated wood<br />
Non treated wood<br />
Shoes<br />
Other textiles<br />
Clothes<br />
Hard plastic<br />
Polystyrene<br />
Other plastic packaging<br />
Plastic bottles<br />
Refuse sacks & other plastic film<br />
Cardboard<br />
Liquid Cartons<br />
Wall paper/non-recyclable paper<br />
Junk mail & other recyclable paper<br />
Directories & catalogues<br />
Newspapers & magazines<br />
Material in Hhd <strong>Waste</strong> Hhd Recycled Available Material<br />
0 500 1,000 1,500 2,000 2,500 3,000 3,500 4,000 4,500 5,000<br />
Arisings (Tonnes)
ERM has over 100 offices<br />
Across the following<br />
countries worldwide<br />
Argentina Netherlands<br />
Australia Peru<br />
Belgium Poland<br />
Brazil Portugal<br />
China Puerto Rico<br />
France Singapore<br />
Germany Spain<br />
Hong Kong Sweden<br />
Hungary Taiwan<br />
India Thailand<br />
Indonesia UK<br />
Ireland USA<br />
Italy Venezuela<br />
Japan Vietnam<br />
Korea<br />
Malaysia<br />
Mexico<br />
ERM’s Edinburgh Office<br />
Norloch House,<br />
36 King’s Stables Road<br />
Edinburgh, EH1 2EU<br />
Tel: +44 (0)131 478 6000<br />
Fax: +44 (0)131 478 3636<br />
ERM consulting services worldwide www.erm.com