

My PhD Thesis, PDF 3MB - Stanford University
My PhD Thesis, PDF 3MB - Stanford University
My PhD Thesis, PDF 3MB - Stanford University

You also want an ePaper? Increase the reach of your titles
YUMPU automatically turns print PDFs into web optimized ePapers that Google loves.
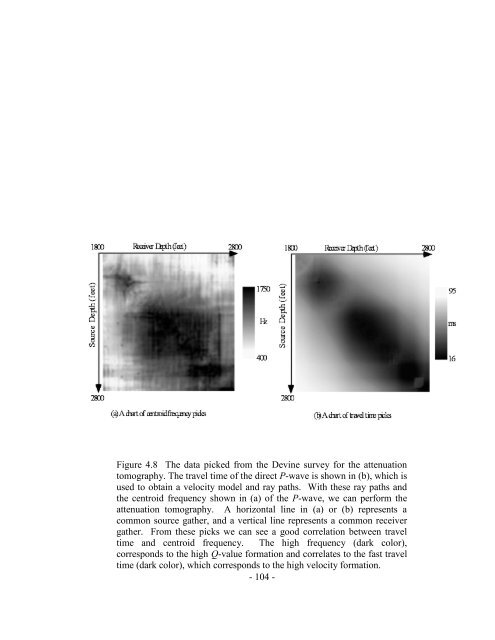
Figure 4.8 The data picked from the Devine survey for the attenuation<br />
tomography. The travel time of the direct P-wave is shown in (b), which is<br />
used to obtain a velocity model and ray paths. With these ray paths and<br />
the centroid frequency shown in (a) of the P-wave, we can perform the<br />
attenuation tomography. A horizontal line in (a) or (b) represents a<br />
common source gather, and a vertical line represents a common receiver<br />
gather. From these picks we can see a good correlation between travel<br />
time and centroid frequency. The high frequency (dark color),<br />
corresponds to the high Q-value formation and correlates to the fast travel<br />
time (dark color), which corresponds to the high velocity formation.<br />
- 104 -


