My PhD Thesis, PDF 3MB - Stanford University
My PhD Thesis, PDF 3MB - Stanford University
My PhD Thesis, PDF 3MB - Stanford University
You also want an ePaper? Increase the reach of your titles
YUMPU automatically turns print PDFs into web optimized ePapers that Google loves.
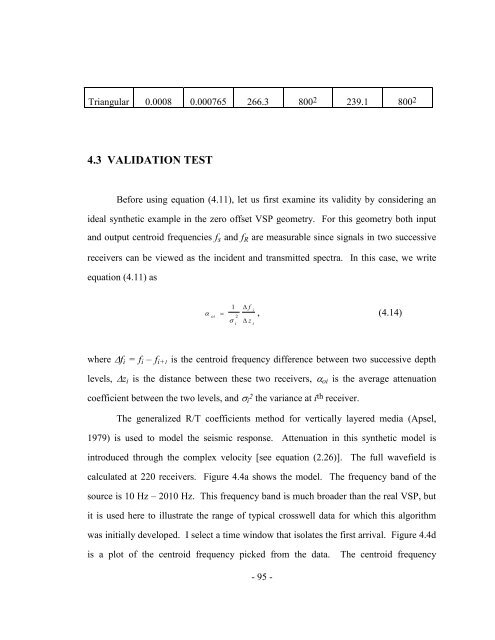
Triangular 0.0008 0.000765 266.3 800 2 239.1 800 2<br />
4.3 VALIDATION TEST<br />
Before using equation (4.11), let us first examine its validity by considering an<br />
ideal synthetic example in the zero offset VSP geometry. For this geometry both input<br />
and output centroid frequencies fs and fR are measurable since signals in two successive<br />
receivers can be viewed as the incident and transmitted spectra. In this case, we write<br />
equation (4.11) as<br />
oi <br />
1<br />
2<br />
i<br />
f i<br />
z i<br />
, (4.14)<br />
where fi = fi – fi+1 is the centroid frequency difference between two successive depth<br />
levels, zi is the distance between these two receivers, oi is the average attenuation<br />
coefficient between the two levels, and i 2 the variance at i th receiver.<br />
The generalized R/T coefficients method for vertically layered media (Apsel,<br />
1979) is used to model the seismic response. Attenuation in this synthetic model is<br />
introduced through the complex velocity [see equation (2.26)]. The full wavefield is<br />
calculated at 220 receivers. Figure 4.4a shows the model. The frequency band of the<br />
source is 10 Hz – 2010 Hz. This frequency band is much broader than the real VSP, but<br />
it is used here to illustrate the range of typical crosswell data for which this algorithm<br />
was initially developed. I select a time window that isolates the first arrival. Figure 4.4d<br />
is a plot of the centroid frequency picked from the data. The centroid frequency<br />
- 95 -


