- Page 1 and 2:
SEISMOGRAM SYNTHESIS IN COMPLEX BOR
- Page 3 and 4:
I certify that I have read this dis
- Page 5 and 6:
developed in this thesis do not hav
- Page 7 and 8:
Finally, I would like to thank my w
- Page 9 and 10:
2.4.2 Cased borehole 2.4.3 Borehole
- Page 11 and 12:
6.4.3 Attenuation estimation from t
- Page 13 and 14:
3.4b Seismograms calculated using t
- Page 15 and 16:
List of Tables 2.1 Model parameters
- Page 17 and 18:
Seismogram synthesis can help us un
- Page 19 and 20:
calculate the wave fields (e.g., St
- Page 21 and 22:
modeling techniques to crosswell se
- Page 23 and 24:
oth synthetic data and field data.
- Page 25 and 26:
simultaneously determine both phase
- Page 27 and 28:
to measure formation properties fro
- Page 29 and 30:
x ( r , z ) are used. Since there
- Page 31 and 32:
normalized Hankel functions of n th
- Page 33 and 34:
(1 ) ?u r ( r ) (1 ) ? ( r )
- Page 35 and 36:
Figure 2.2 Pictorial explanation of
- Page 37 and 38:
Figure 2.3 Pictorial explanation of
- Page 39 and 40:
(1 ) (1 ) ( 1) (1 ) (1 ) ? ( r )
- Page 41 and 42:
imaginary angular frequency I also
- Page 43 and 44:
Figure 2.4 (a) Seismogram calculate
- Page 45 and 46:
Figure 2.5 (a) Seismograms calculat
- Page 47 and 48:
Table 2.3a Model parameters of a si
- Page 49 and 50:
profiling. Chen et al. (1994) gave
- Page 51 and 52:
Figure 2.7 (a) Configuration of the
- Page 53 and 54:
Figure 2.8a An invaded zone model u
- Page 55 and 56:
Two special examples for single bor
- Page 57 and 58: measurement technique: seismic atte
- Page 59 and 60: Let us start with the elastodynamic
- Page 61 and 62: Substituting equation (3.2) into eq
- Page 63 and 64: where { E pq with ( j) ( r ; l , n
- Page 65 and 66: different dimensions. Moreover, R
- Page 67 and 68: 3.4 GENERALIZED REFLECTION AND TRAN
- Page 69 and 70: 3.6 DETERMINATION OF EIGEN FUNCTION
- Page 71 and 72: Eigenvalues ( n ( j ) ) 2 and ( n
- Page 73 and 74: peak frequency 1KHz. Figures 3.4b g
- Page 75 and 76: Figure 3.4b A common source gather
- Page 77 and 78: 3.5b). Figure 3.5a shows the synthe
- Page 79 and 80: (a) Synthetic full waveform sonic l
- Page 81 and 82: (a) Seismograms. The peak frequency
- Page 83 and 84: 3.9 CONCLUSIONS A semi-analytical a
- Page 85 and 86: Seismic wave attenuation includes i
- Page 87 and 88: Under this model, the high frequenc
- Page 89 and 90: the amplitude. In this study, I con
- Page 91 and 92: and the variance to be 2 S 0 (
- Page 93 and 94: o dl 18 ( f S f R ) / B 2 - 92 -
- Page 95 and 96: Spectrum Shape Figure 4.3a A boxcar
- Page 97 and 98: decreases from 370 Hz to 280 Hz ove
- Page 99 and 100: Here, the index i represents the it
- Page 101 and 102: comparison. We can see that the tom
- Page 103 and 104: Figure 4.7 Synthetic test on 2-D at
- Page 105 and 106: Figure 4.8 The data picked from the
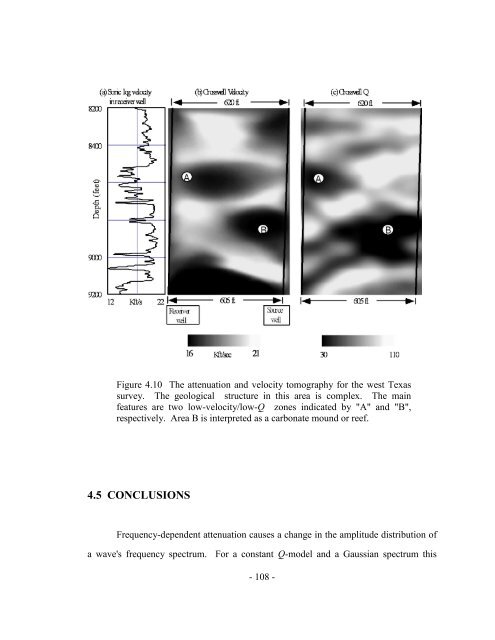
- Page 107: profile curves within the tomograms
- Page 111 and 112: Chapter 5 Acoustic Attenuation Logg
- Page 113 and 114: decreases with the increasing offse
- Page 115 and 116: Assume that the intrinsic attenuati
- Page 117 and 118: 2 i 0 ( f f ) i 2 R ( f ) df i
- Page 119 and 120: Figure 5.3b Micro-seismograms calcu
- Page 121 and 122: This simulation shows the central f
- Page 123 and 124: Figure 5.5b Micro-seismograms recor
- Page 125 and 126: Figure 5.8 Centroid frequency picks
- Page 127 and 128: p 1 log [ z i 1 z i log [ ] R ( f
- Page 129 and 130: spreading. To understand how the in
- Page 131 and 132: 5.9b, in fact, shows the velocity s
- Page 133 and 134: The generalized reflection and tran
- Page 135 and 136: eflection and transmission (R/T) co
- Page 137 and 138: where, signs "+" and "-" refer to o
- Page 139 and 140: Therefore, equation (6.5) is a disp
- Page 141 and 142: [ ?v n ( ), ?v p , ?v s ] [ v n
- Page 143 and 144: tested for three typical radially l
- Page 145 and 146: Figure 6.2 A plot of the function d
- Page 147 and 148: 6.4.3 Attenuation Estimation from t
- Page 149 and 150: References Aki, K, and Richards, P.
- Page 151 and 152: Parker, K., Lerner, R. & Waag, R.,
- Page 153 and 154: A-2 ELASTODYNAMIC EQUATION IN TERMS
- Page 155 and 156: ? (1 ) (1 ) ( 1) (1 ) ( r , k , )
- Page 157 and 158: where, ( j ) k 2 ( j) e 32 ( j )
- Page 159 and 160:
( j ) ( j ) ( j ) ( j) ( j ) ( j) E
- Page 161 and 162:
- 160 -
- Page 163 and 164:
( j) E 31 ( j) E 32 ( j) E 33 ( j)
- Page 165 and 166:
or rewrite it as ( j ) D 11 D 21 (
- Page 167 and 168:
Appendix C Relationships between th
- Page 169:
a dl 12 ( f f ) / B o S R ray 2 C