

My PhD Thesis, PDF 3MB - Stanford University
My PhD Thesis, PDF 3MB - Stanford University
My PhD Thesis, PDF 3MB - Stanford University

Create successful ePaper yourself
Turn your PDF publications into a flip-book with our unique Google optimized e-Paper software.
F ( ) <br />
1<br />
2<br />
8 o ( i )<br />
[ ( i ) 2<br />
- 117 -<br />
2<br />
] o<br />
2 ,<br />
with o 2 14 KHz and 0 . 5 . I use a short time window to extract the P<br />
wave (first arrival) and use equation (5.5) to calculate the spectral centroid (the curve for<br />
Qp=40 in Figure 5.4). For the purpose of reducing the effect of the window length and<br />
the contamination of later wave trains, we only use the seismograms with source to<br />
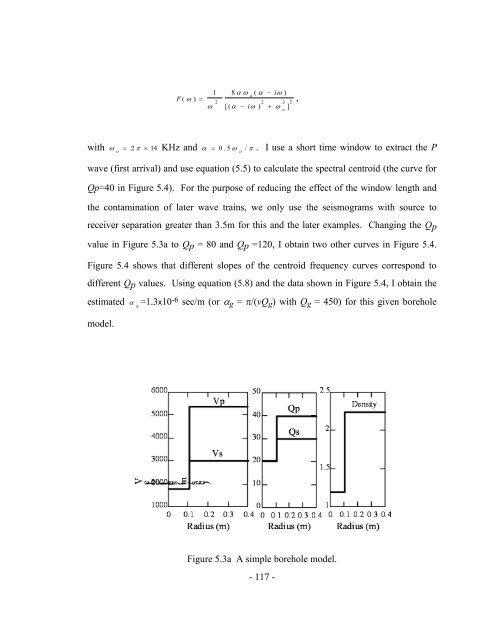
receiver separation greater than 3.5m for this and the later examples. Changing the Qp<br />
value in Figure 5.3a to Qp = 80 and Qp =120, I obtain two other curves in Figure 5.4.<br />
Figure 5.4 shows that different slopes of the centroid frequency curves correspond to<br />
different Qp values. Using equation (5.8) and the data shown in Figure 5.4, I obtain the<br />
estimated g =1.3x10 -6 sec/m (or g = /(vQg) with Qg = 450) for this given borehole<br />
model.<br />
Figure 5.3a A simple borehole model.


