Untitled
Untitled
Untitled

Create successful ePaper yourself
Turn your PDF publications into a flip-book with our unique Google optimized e-Paper software.
Comision Federal de la mejora regulatoria<br />
Coordinación general de la mejora regulatoria<br />
22 octubre de 2009<br />
Por este conducto nos estamos permitiendo, en tiempo y forma, hacer llegar a esa<br />
autoridad, las propuestas, debidamente documentadas, a la modificación de la Norma<br />
Oficial Mexicana NOM-051-SCFI-1994, Especificaciones generales de etiquetado<br />
para alimentos y bebidas no alcohólicas preenvasado cuyo Proyecto de Modificación<br />
se encuentra en fase de consulta pública para comentarios de los interesados en el<br />
tiempo concedido para ello.<br />
Es de aclarar que, como también lo acreditamos con la copia de nuestros escritos que<br />
para tal efecto exhibimos, las propuestas y bibliografía de que se habla, la hemos hecho<br />
llegar en diversas ocasiones a esa autoridad, buscando una solución para el problema<br />
discriminatorio que resiente el producto ISOMALT, decisión que a pesar del tiempo<br />
transcurrido nunca se ha dado, limitándose a expresarnos que nuestra solicitud se<br />
evaluará en su momento exhibiendo copia de la documentación oficial que lo comprenda.<br />
Ahora, con motivo de la revisión a la Norma de que se habla y de su Proyecto publicado<br />
en el Diario Oficial el miércoles 26 de agosto de 2009 para comentarios al respecto,<br />
esperamos que se haga efectiva la evaluación con la que se nos ha respondido hasta la<br />
fecha.<br />
Estimamos que ahora es la oportunidad para que quede reconocida nuestra posición en la<br />
NOM 051-SCFI-SSA1-2009 el dispositivo de que se habla y poder comercializar el<br />
producto en igualdad de circunstancias con los que lo hacen en el mercado de esa<br />
manera y que son similares al nuestro.<br />
1/2
Mucho agradeceremos dar el alcance que merece nuestra propuesta que formalmente<br />
solicitamos con este escrito que se basa en la evidencia documentada que de antemano<br />
hemos exhibido y la que anexo enviaremos nuevamente.<br />
Anke Sentko<br />
Vice President Regulatory Affairs<br />
& Nutritional Communication<br />
Wim Caers<br />
Manager Regulatory Affairs<br />
2/2
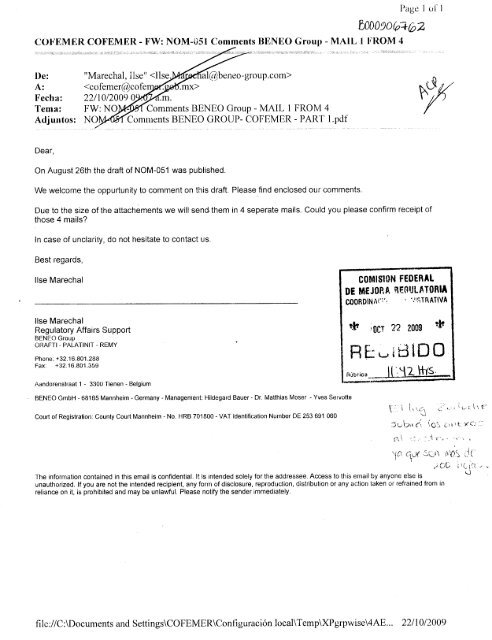
Subject: MEXICO – Comments on PROY‐NOM‐051‐SCFI/SSA1‐2009<br />
SSS/WCS/IML<br />
Regulatory Affairs<br />
October 22 nd , 2009, page 1 / 4<br />
On the 26th of August 2009, the proposal for PROY‐NOM‐051‐SCFI/SSA1‐2009 was published in Mexico’s<br />
Official Journal. Comments can be submitted during the 60 days of public consultation.<br />
Item of PROY‐<br />
NOM‐051<br />
3.3 Definition:<br />
“Sugars”<br />
Proposal Justification<br />
“All mono‐ and<br />
disaccharides present in a<br />
food or non‐alcoholic<br />
beverage, excluding<br />
polyols and isomaltulose”<br />
‐ Exclusion of polyols:<br />
Because the physiological properties of polyols are<br />
different from sugars: polyols are low glycemic, do not<br />
promote dental caries and are reduced in calories (for<br />
isomalt: Ziesenitz, S.C., 1996, Review ‘Basic Structure and<br />
metabolism of isomalt’, Advances in Sweetness: 109‐133<br />
[annex 1.1]).<br />
It will bring the Mexican definition in line with Codex<br />
Alimentarius (cfr. The joint FAO/WHO Scientific Update on<br />
Carbohydrates in Human Nutrition (2007) excludes polyols<br />
from the total sugar content [Annex 1.2]. and the European<br />
Legislation ( 90/496/EEC; [annex 1.3]).<br />
Polyols are mainly used for sugarfree products, no added<br />
sugars and/or energy reduced type of products.<br />
‐ Exclusion of isomaltulose:<br />
Although this carbohydrate is a disaccharide from a<br />
chemistry point of view, its nutritional and physiological<br />
properties significantly differ from those of sugars as it is<br />
e.g., non‐cariogenic, slow release and low glycaemic so that<br />
it would be misleading to the consumer to have them<br />
classified as sugars (see e.g. US‐FDA GRAS Notification No.<br />
GRN 000184 (isomaltulose)[Annex 1.4]; US Health Claims<br />
Regulation on dietary noncariogenic carbohydrate<br />
sweeteners and dental caries [Annex 1.5]; ‘Palatinose TM<br />
(isomaltulose) – a new innovative carbohydrate’ [Annex<br />
1.6]; ‘Dossier for the scientific substantiation of claims<br />
related to Palatinose TM and its nutritional physiological<br />
properties’ [Annex 1.7]; Report from Imfeld (University of<br />
Zürich): ‘Pilot Study on the Dental Care Properties of<br />
Isomaltulose (Palatinose TM )’ [Annex 1.8];<br />
It will also support correct information to the consumer.<br />
Isomaltulose will be included under the “carbohydrate”<br />
listing, like e.g. starch or maltodextrins, which is where it<br />
really belongs, rather than under the “sugar” section.
Item of PROY‐<br />
NOM‐051<br />
3.19<br />
Definition:<br />
“Dietary fibre”<br />
5.1.1<br />
“Energy<br />
calculation”<br />
5.1.4 “Energy<br />
content<br />
polyalcohols<br />
and<br />
polydextrose”<br />
Proposal Justification<br />
We support the Dietary<br />
Fibre definition of Codex<br />
Alimentarius including DP 3<br />
– 9 as stated in Footnote 2.<br />
Carbohydrates: 4 kcal/g –<br />
17 kJ<br />
Proteins: 4 kcal/g – 17 kJ<br />
Fats: 9 kcal/g – 37 kJ<br />
Alcohol: 7 kcal/g – 29 kJ<br />
Organic acids: 3 kcal/g – 13<br />
kJ<br />
Isomalt: 2.0 kcal/g – 8 kJ<br />
Lactitol: 2.0 kcal/g – 8 kJ<br />
Maltitol: 2.1 kcal/g – 8 kJ<br />
Mannitol: 1.6 kcal/g – 6 kJ<br />
Sorbitol: 2.6 kcal/g – 10 kJ<br />
Xylitol: 2.4 kcal/g – 10 kJ<br />
HSH (maltitol syrup): 3.0<br />
kcal/g – 12 kJ<br />
SSS/WCS/IML<br />
Regulatory Affairs<br />
October 22 nd , 2009, page 2 / 4<br />
Regarding this definition we want to stress that we support<br />
it, provided that as foreseen in footnote 2, carbohydrates<br />
with a DP (degree of polymerisation) of 3 to 9 monomeric<br />
units are included into the definition.<br />
Non‐digestible oligosaccharides, e.g. oligofructose do<br />
behave as dietary fibres, and these properties do not<br />
change at DP =10 or higher. It will also harmonise the<br />
Mexican DF definition with almost all other definitions, as<br />
proposed worldwide, including EU, EFSA, Institute of<br />
Medicin (US), FSANZ, ILSI, AACC…<br />
For those ingredients, for which the scientific basis for an<br />
individual energy value is established, this individual value<br />
should be used.<br />
Scientific evidence is available for the following energy<br />
conversions factors:<br />
‐ Inulin/oligofructose: in the US, a value of 1.5 kcal/g is<br />
used. Further support for this value is given in Annex 2.1.<br />
and Annex 2.2.<br />
For those ingredients, for which the scientific basis for an<br />
individual energy value is established, this individual value<br />
should be used.<br />
Having the NAFTA in mind, where US and Canada accepted<br />
deviated caloric values for polyols, if necessary scientific<br />
substantiation is available, it should also be appropriate as<br />
well for Mexico to handle the same caloric values:<br />
‐ US: each polyol has its own FDA notified energy<br />
conversion factor, based upon a scientific evaluation by<br />
FASEB (Federation of American Societies for Experimental<br />
Biology; 1994; “The Evaluation of the Energy of Certain<br />
Sugar Alcohols used as Food Ingredients”) [Annex 3.1].<br />
“Letter of no objection” received for caloric value of<br />
2.0 kcal/g for isomalt [Annex 3.2].<br />
‐ Canada: has confirmed the use of 2 kcal/g (http://www.hc‐<br />
sc.gc.ca/fn‐an/securit/addit/sweeten‐edulcor/polyols_polydextose_factsheet‐<br />
polyols_polydextose_fiche‐eng.php)
Item of PROY‐<br />
NOM‐051<br />
A.3.1 & A.3.2<br />
Proposal Justification<br />
A definition and examples<br />
for nutrition claims, are<br />
given in PROY‐NOM‐051‐<br />
SCFI/SSA1‐2009<br />
(e.g. “Source of calcium”,<br />
“High fibre content”, “low<br />
in fats”)<br />
SSS/WCS/IML<br />
Regulatory Affairs<br />
October 22 nd , 2009, page 3 / 4<br />
Laying down fixed conditions for the nutrition claims,<br />
makes it easier for producers and for regulators to control<br />
the products. It avoids misleading communication and it<br />
supports harmonization. We suggest these claims to be in<br />
line with the Codex Alimentarius (see Annex 4.1 )
List of annexes:<br />
SSS/WCS/IML<br />
Regulatory Affairs<br />
October 22 nd , 2009, page 4 / 4<br />
Annex 1.1: Ziesenitz, S.C.; 1996; “Basic Structure and Metabolism of Isomalt”; Advances in Sweeteners.<br />
Annex 1.2: “Joint FAO/WHO Scientific Update on Carbohydrates in Human Nutrition”; Eur. J. Clin. Nutr.<br />
61(S1); 2007.<br />
Annex 1.3: Council Directive 90/496/EEC on Nutrition Labelling of Foodstuffs.<br />
Annex 1.4: US‐FDA GRAS Notification No. GRN 00184 (Isomaltulose).<br />
Annex 1.5: US Health Claims Regulation on Dietary Noncariogenic Carbohydrate Sweeteners and Dental<br />
Caries, Fed. Reg. Vol. 73, No. 102, May 27, 2008, 30299‐30301.<br />
Annex 1.6: “Palatinose TM (isomaltulose) – a new innovative carbohydrate”<br />
Annex 1.7: “Dossier for the Scientific Substantiation of Claims related to Palatinose TM and its Nutritional<br />
Physiological Properties”<br />
Annex 1.8: Report from Imfeld (University of Zürich): “Pilot Study on the Dental Care Properties of<br />
Isomaltulose (Palatinose TM )”.<br />
Annex 2.1: “The Determination of a Caloric Value for Inulin and Oligofructose”, Cantox Inc., 1999.<br />
Annex 2.2: Roberfroid, M.B., 1999; “Caloric Value of Inulin and Oligofructose”.<br />
Annex 3.1: Scientific Evaluation by FASEB, 1994; “Evaluation of the Energy of Certain Sugar Alcohols used<br />
as Food Ingredients”<br />
Annex 3.2: “Letter of no objection” from USA for the caloric value of 2.0 kcal/g for isomalt.<br />
Annex 4.1: Codex Alimentarius CAC/GL 23‐1997 “Guidelines for Use of Nutrition and Health Claims”, Table<br />
of Conditions for Nutrient Content.
Annex 1.1: Ziesenitz, S.C.; 1996; “Basic Structure and<br />
Metabolism of Isomalt”; Advances in Sweeteners.
Annex 1.2: “Joint FAO/WHO Scientific Update on<br />
Carbohydrates in Human Nutrition”;<br />
Eur. J. Clin. Nutr. 61(S1); 2007.
Volume 61 Supplement 1 December 2007 www.nature.com/ejcn<br />
Joint FAO/WHO Scientifi c<br />
Update on Carbohydrates in<br />
Human Nutrition<br />
Guest Editors:<br />
Chizuru Nishida, Frank Martinez Nocito<br />
and Jim Mann
I Brouwer<br />
Vrije Universiteit Amsterdam<br />
Netherlands<br />
B Bistrian<br />
Harvard Medical School<br />
USA<br />
N Butte<br />
University of Houston, Texas<br />
USA<br />
J Chen<br />
Chinese Center for Disease<br />
Control & Prevention<br />
China<br />
T Cole<br />
University of London<br />
UK<br />
M Gibney<br />
University College Dublin<br />
Ireland<br />
Editor-in-Chief<br />
PS Shetty<br />
University of Southampton, Southampton, UK<br />
A Dangour<br />
University of London<br />
UK<br />
J Hautvast<br />
University of Wageningen<br />
Netherlands<br />
R Hurrell<br />
Swiss Federal Institute of Technology<br />
Switzerland<br />
A Kurpad<br />
Institute for Population Health Research<br />
India<br />
Associate Editors<br />
D Lobo<br />
University of Nottingham<br />
UK<br />
Editorial Board<br />
M Lean<br />
University of Glasgow<br />
Scotland<br />
J Mann<br />
University of Otago<br />
New Zealand<br />
T McMichael<br />
National Centre for<br />
Epidemiology & Population Health<br />
Australia<br />
M Muller<br />
University of Kiel<br />
Germany<br />
S Olsen<br />
Danish Epidemiology Science Centre<br />
Denmark<br />
F Pasanisi<br />
University of Naples Federico II<br />
Italy<br />
P Ritz<br />
INSERM<br />
France<br />
M Soares<br />
Curtin University<br />
Australia<br />
A Stephen<br />
University of Cambridge<br />
UK<br />
HPS Sachdev<br />
Sitaram Bhartia Institute of<br />
Science and Research<br />
India<br />
A Sawaya<br />
Federal University of Sao Paulo<br />
Brazil<br />
K Tontisirin<br />
Mahidhol University<br />
Thailand<br />
J Tuomilehto<br />
University of Helsinki<br />
Finland<br />
M Valencia<br />
University of Yucatan<br />
Mexico<br />
H Vorster<br />
North West University,<br />
Potchefstroom<br />
South Africa<br />
K Westerterp<br />
University of Limburg<br />
Netherlands<br />
W Willett<br />
Harvard School of Public Health<br />
USA
Volume 61, Supplement 1, December 2007<br />
Joint FAO/WHO Scientific Update on Carbohydrates in<br />
Human Nutrition<br />
Guest Editors:<br />
Chizuru Nishida, Frank Martinez Nocito and<br />
Jim Mann
www.nature.com/ejcn<br />
EJCN is published by Nature Publishing Group, a division of Macmillan<br />
Publishers Ltd.<br />
Scope EJCN is published monthly. It covers theoretical aspects of nutrition;<br />
relations of function to nutritional status; nutritional causes and effects of<br />
disease; the epidemiology of disease; community nutrition and education; the<br />
determinants of eating behaviour. Papers on animal nutrition will not be<br />
accepted unless they include parallel studies on human subjects.<br />
This journal is covered by Current Contents, Current Contents Clinical Medicine,<br />
Current Contents Life Sciences, EMBASE, Excerpta Medica, Index Medicus,<br />
BIOSIS, CABS, CAB Abstracts, CAB Health and Nutrition Research Newsletter.<br />
The Editor of the EJCN requires all contributors to read the following statement<br />
in conjunction with the ‘Directions to Contributors’.<br />
Ethics of investigation on human subjects. Authors must state in the text of their<br />
paper the steps which they have taken to conform with accepted procedures<br />
for the maintenance of clinical standards. Consent must be obtained from<br />
each patient or subjects after full explanation of the purpose, nature and risks<br />
of all procedures used. The fact that such consent has been given should be<br />
recorded in the paper. If an Ethical Committee is in operation in the institution<br />
where the work was done, it should be stated in the paper that the protocol<br />
has been approved by that Committee. If no such Committee exists, this fact<br />
should also be stated in the paper. The Editor has the right and duty not to<br />
accept papers if, in his opinion, the ethical aspects are open to doubt.<br />
Editorial To expedite the review process, authors should submit their<br />
manuscript online at http://mts-ejcn.nature.com. Detailed ‘Directions to<br />
Contributors’ are available at this website, or in print in the first issue of the year.<br />
Publisher All business correspondence and enquiries about sponsorship<br />
opportunities should be addressed to EJCN, Nature Publishing Group, The<br />
Macmillan Building, 4 Crinan Street, London, N1 9XW, UK. Tel: +44 20 7833<br />
4000. Fax: +44 20 7843 4640.<br />
Executive Editor: Joyce-Rachel John<br />
Production Controller: Steve Chillmaid<br />
EJCN is online at www.nature.com/ejcn. Visit the journal’s home pages for<br />
details of the aims and scope, readership, instructions to authors and how to<br />
contact the Editor and publishing staff. Use the website to order a subscription,<br />
reprints, a sample copy or individual articles.<br />
Free to all readers: The complete text of all articles in the back archive 4 years<br />
after publication; table of contents and abstracts for all articles published<br />
within the last 4 years and the complete text of the January 2007 issue.<br />
Register to receive the table of contents by e-mail as each issue is published.<br />
2008 Subscriptions<br />
Institutional Subscriptions<br />
New institutional policy<br />
From 2005 on, NPG has moved to a site licence policy for institutional online access,<br />
using prices based on Full-Time Equivalents (FTE) or Research and Development<br />
(R&D) staff. Institutions may also purchase a separate print subscription.<br />
Subscribing to a site licence<br />
Contact your local sales representative for a tailored price quote for your<br />
institution. You will be required to complete a NPG site licence agreement.<br />
More information, contact details and FTE/R&D definitions are available at the<br />
http://www.nature.com/libraries.<br />
Institutional print subscriptions<br />
Orders can be placed with your regular subscription agent or through NPG –<br />
either online at www.nature.com/ejcn or by contacting our customer services<br />
department. Prices (excluding Japan) are as follows. For prices applicable to<br />
Japan, please contact institutions@natureasia.com<br />
The Americas $1022.00 Europe &812.00 UK/Rest of World d524.00<br />
Personal Subscriptions<br />
Personal customers who pay by personal cheque or credit card can either<br />
purchase a combined print plus online subscription or an online-only<br />
subscription. Prices (excluding Japan) are as follows. For prices applicable to<br />
Japan, please contact institutions@natureasia.com<br />
Combined (print plus online)<br />
The Americas $462.00 Europe &367.00 UK/Rest of World d237.00<br />
Online only<br />
The Americas $415.00 Europe &330.00 UK/Rest of World d213.00<br />
Contact information<br />
SITE LICENCES<br />
The Americas:<br />
Tel: +1 800 221 2123. Fax: +1 212 689 9711.<br />
E-mail: institutions@natureny.com<br />
Asia Pacific:<br />
Tel: +81 3 3267 8769. Fax: +81 3 3267 8746.<br />
E-mail: institutions@natureasia.com<br />
Australia and New Zealand:<br />
Tel: +61 3 9825 1160. Fax: +61 3 9825 1010.<br />
E-mail: nature@macmillan.com.au<br />
India:<br />
Tel: +91 124 288 1054. Fax: +91 124 288 1053.<br />
E-mail: npgindia@nature.com<br />
Rest of the World:<br />
Tel: +44 (0) 20 7843 4759. Fax: +44 (0) 20 7843 4998.<br />
E-mail: institutions@nature.com<br />
PRINT SUBSCRIPTIONS<br />
All customers:<br />
Customer Service Department, Nature Publishing Group, Houndmills,<br />
Basingstoke, Hants, RG21 6XS, UK. Tel: +44 (0) 1256 329242. Fax: +44 (0)<br />
1256 812358. E-mail: subscriptions@nature.com<br />
Prices are applicable in the following region: US dollars ($) for North, Central,<br />
South America and Canada; Euros (&) for all European countries (excluding the<br />
UK); Yen for Japan; Sterling (d) for UK and rest of world. Please ensure you use the<br />
appropriate currency. All prices, specifications and details are subject to change<br />
without prior notification. Single issues of EJCN are available. For information,<br />
please contact: Subscriptions Dept, Nature Publishing Group, Brunel Road,<br />
Houndmills, Basingstoke, Hampshire RG21 6XS, UK. Tel: +44 (0) 1256 329242.<br />
Fax: +44 (0) 1256 812358. E-mail: subscriptions@nature.com<br />
Advertising Enquiries concerning print and web advertisements should<br />
be addressed to: Alf Anderson, Advertising Manager. Tel: +1 617 475 9231;<br />
Fax: +1 617 494 4960. E-mail: a.anderson@boston.nature.com<br />
Supplements Enquiries concerning supplements should be addressed to:<br />
Sue Deeley, Supplements Editor. Tel: +1 212 726 9230; Fax: +1 646 563 7003.<br />
E-mail: s.deeley@natureny.com<br />
Reprints and permissions For detailed information on reprint and<br />
permission requests, including instructions for obtaining these online, please<br />
visit http://www.nature.com/reprints. Alternatively, for reprints, please<br />
e-mail: reprints@nature.com. For North America: Tel: +1 212 726 9631.<br />
Fax: +1 212 679 0843. Outside North America: Tel: +44 (0) 20 7843 4967.<br />
Fax: +44 (0) 20 7843 4791. For permissions, please e-mail: ajpermissions@<br />
nature.com. Tel: +44 (0) 20 7843 4613.<br />
Copyright r 2007 Nature Publishing Group<br />
Copyright r 2007, in the articles in this supplement, World Health Organization<br />
ISSN 0954-3007<br />
EISSN 1476-5640<br />
All rights of reproduction are reserved in respect of all papers, articles, illustrations,<br />
etc., published in this journal in all countries of the world. All material<br />
published in this journal is protected by copyright, which covers exclusive<br />
rights to reproduce and distribute the material. No material published in this<br />
journal may be reproduced or stored on microfilm or in electronic, optical or<br />
magnetic form without the written authorisation of the publisher.<br />
Authorisation to photocopy material for internal or personal use, or internal or<br />
personal use of specific clients, is granted by Nature Publishing Group, to<br />
libraries and others registered with the Copyright Clearance Center (CCC)<br />
Transaction Reporting Service, provided the relevant copyright fee is paid<br />
directly to CCC, 222 Rosewood Drive, Danvers, MA 01923, USA. Identification<br />
Code for EJCN: 0954-3007/07.<br />
Apart from any fair dealing for the purposes of research or private study, or<br />
criticism or review, as permitted under the Copyright, Designs and Patent Act<br />
1988, this publication may be reproduced, stored or transmitted, in any form<br />
or by any means, only with the prior permission in writing of the publishers, or<br />
in the case of reprographic reproduction, in accordance with the terms of<br />
licences issued by the Copyright Licensing Agency.<br />
European Journal of Clinical Nutrition (ISSN 0954-3007) is published 12 times<br />
a year by Nature Publishing Group, a division of Macmillan Publishers Ltd. US<br />
Mailing Agent: Mercury Airfreight International Inc., 365 Blair Road, Avenel,<br />
NJ 07001, USA. Periodicals postage paid at Rahway, NJ, USA.<br />
POSTMASTER: Send address changes to EJCN Nature Publishing Group,<br />
Mercury Airfreight International Inc., 365 Blair Road, Avenel, NJ 07001, USA.<br />
Typeset by Macmillan India Ltd, Bangalore, India<br />
Printed on acid-free paper, effective with Volume 48, Issue 1, 1994
S1<br />
S5<br />
S19<br />
S40<br />
S75<br />
S100<br />
S112<br />
S122<br />
S132<br />
INTRODUCTION<br />
Volume 61, Supplement 1, December 2007<br />
FAO/WHO Scientific Update on carbohydrates in human nutrition: introduction<br />
C Nishida and F Martinez Nocito<br />
REVIEWS<br />
Carbohydrate terminology and classification<br />
JH Cummings and AM Stephen<br />
Nutritional characterization and measurement of dietary carbohydrates<br />
KN Englyst, S Liu and HN Englyst<br />
Physiological aspects of energy metabolism and gastrointestinal effects of carbohydrates<br />
M Elia and JH Cummings<br />
Carbohydrate intake and obesity<br />
RM van Dam and JC Seidell<br />
Dietary carbohydrate: relationship to cardiovascular disease and disorders of carbohydrate metabolism<br />
J Mann<br />
Carbohydrates and cancer: an overview of the epidemiological evidence<br />
TJ Key and EA Spencer<br />
Glycemic index and glycemic load: measurement issues and their effect on diet--disease relationships<br />
BJ Venn and TJ Green<br />
CONCLUSIONS<br />
FAO/WHO Scientific Update on carbohydrates in human nutrition: conclusions<br />
J Mann, JH Cummings, HN Englyst, T Key, S Liu, G Riccardi, C Summerbell, R Uauy, RM van Dam,<br />
B Venn, HH Vorster and M Wiseman<br />
Copyright r 2007 Nature Publishing Group<br />
Copyright r 2007, in the articles in this supplement, World Health Organization<br />
Disclaimer: The named authors alone are responsible for the views expressed in this publication. All<br />
reasonable precautions have been taken by WHO to verify the information contained in this<br />
publication. However, the published material is beingdistributed without warranty of any kind, either<br />
express or implied. The responsibility for the interpretation and use of the material lies with the reader.<br />
In no event shall the World Health Organization be liable for damages arising from its use.<br />
This issue is nowavailable at:<br />
www.nature.com/ejcn
Beginning January 2008, Nature Publishing Group (NPG) will publish<br />
Obesity. Th e preeminent journal in its fi eld, Obesity is intended to increase<br />
knowledge, foster research and promote better treatment for people with<br />
obesity and their loved ones.<br />
With a newly redesigned front section, the journal will feature editorials,<br />
commentaries, reviews, information about articles of interest in the issue<br />
as well as timely and relevant coverage of research that defi nes the fi eld.<br />
Covering the breadth of obesity research, the journal covers topics such as:<br />
• clinical nutrition medicine<br />
• pharmacology<br />
• nutrition medicine<br />
• genetics<br />
• adipogenesis<br />
• behavioral epidemiology<br />
• biophysics and lipid metabolism<br />
• exercise and human physiology<br />
• nutritional epidemiology<br />
Joining Nature Publishing Group not only means changes to the journal’s<br />
look in print, but online as well. Obesity’s homepage will off er robust<br />
online features unique to Nature Publishing Group, like:<br />
• Table of Contents E-alerts is a free service which delivers the table of<br />
contents page directly to your inbox on the day the issue publishes. Th e<br />
quickest and easiest way to stay abreast of the latest research and reviews,<br />
free monthly article promotions, special issues and focuses from Obesity.<br />
• Free sample issue available all year long online at www.nature.com/obesity<br />
• Integrated searches across all 70+ Nature Publishing Group journals and<br />
products<br />
• Reference linking via CrossRef and Medline<br />
www.nature.com/obesity<br />
ANNOUNCING A NEW LOOK<br />
& NEW PUBLISHER FOR 2008<br />
• phenotyping<br />
• fat cell physiology<br />
• aging, neuroscience<br />
• transgenic models<br />
• metabolic syndrome<br />
• nutrition behavior<br />
• pediatric obesity<br />
• adipocyte cell biology<br />
ISSN:<br />
1930-7381<br />
2005 IMPACT FACTOR:<br />
3.491*<br />
RANKING:<br />
30/93<br />
Endocrinology & Metabolism<br />
8/55 Nutrition & Dietetics<br />
EDITOR:<br />
Dr. Richard Bergman<br />
Offi cial Journal of<br />
The Obesity Society<br />
*Journal Citation Reports, Thomson, 2007
FAO/WHO Scientific Update on carbohydrates in<br />
human nutrition: introduction<br />
C Nishida 1 and F Martinez Nocito 2<br />
1 Department of Nutrition for Health and Development, World Health Organization (WHO), Geneva, Switzerland and 2 Nutrition and<br />
Consumer Protection Division, Food and Agriculture Organization of the United Nations (FAO), Rome, Italy<br />
European Journal of Clinical Nutrition (2007) 61 (Suppl 1), S1–S4; doi:10.1038/sj.ejcn.1602935<br />
Keywords: carbohydrates; human nutrition; expert consultation; FAO; WHO; recommendations<br />
Carbohydrates in human nutrition<br />
Since the 1950s, FAO and WHO have regularly held joint<br />
expert meetings to review the state of scientific knowledge<br />
on the role of various nutrients in the human diet, that is,<br />
proteins, fats and oils, and most vitamins, minerals and trace<br />
elements, to provide guidance on their requirements and<br />
recommended intakes (Weisell, 2002).<br />
The Joint FAO/WHO Expert Meeting on Carbohydrates in<br />
Human Nutrition held in Geneva from 16 to 26 September<br />
1979 was the first to focus on the topic of carbohydrates<br />
(FAO, 1980) and aimed to review the role of carbohydrates as<br />
determinants of human health and diseases. It was wide<br />
ranging in scope and addressed the important role of<br />
carbohydrates (1) as sources of energy contributing to the<br />
improvement of human nutritional status; (2) as determinants<br />
of the sensory qualities of foods, that is, flavour and<br />
texture and the acceptability of foods; (3) and their influence<br />
on the physiology and pathology of the large intestine,<br />
particularly through a deeper understanding of the role of<br />
dietary fibre; (4) as potential determinants of dental caries,<br />
obesity, cardiovascular disease and diabetes; and (5) as they<br />
relate to the nutrition of infants and young children,<br />
including the role of lactose and its inclusion in weaning<br />
foods.<br />
The Expert Meeting recognized, however, that it was<br />
inappropriate to focus on the nutritional effects of a single<br />
dietary component due to the wide range of carbohydrates<br />
consumed in the diet, and the fact that the overall<br />
Correspondence: Dr C Nishida, Department of Nutrition for Health and<br />
Development, World Health Organization (WHO), Avenue Appia 20, CH-1211<br />
Geneva 27, Switzerland.<br />
E-mail: nishidac@who.int<br />
European Journal of Clinical Nutrition (2007) 61 (Suppl 1), S1–S4<br />
& 2007 Nature Publishing Group All rights reserved 0954-3007/07 $30.00<br />
www.nature.com/ejcn<br />
nutritional consequences of any dietary pattern represents<br />
the integration of a wide range of interactive effects. Further<br />
studies were, therefore, considered to be necessary for<br />
understanding the interactions between carbohydrates and<br />
many other components of the diet to contribute to the<br />
improvement of the health and nutritional well-being of the<br />
world’s population (FAO, 1980).<br />
Eighteen years later, the Joint FAO/WHO Expert Consultation<br />
on Carbohydrates in Human Nutrition was convened in<br />
Rome from 14 to 18 April 1997 (FAO, 1998). Much progress<br />
was made in understanding the role that carbohydrates<br />
play in human nutrition and health. These included the<br />
following: (1) additional understanding of the role of dietary<br />
fibre, and in particular, its role in moderating the process of<br />
digestion in the small intestine and its potential as a major<br />
substrate for fermentation in the colon; (2) increased<br />
understanding of the diverse physiological roles that carbohydrates<br />
have, dependent upon the site, rate and extent of<br />
digestion and fermentation in the gut; (3) the potential<br />
of carbohydrates to enhance physical performance through<br />
glycogen loading; and (4) further understanding of the<br />
relationship between the diet and various noncommunicable<br />
diseases, including obesity, type II diabetes, coronary<br />
heart disease and some forms of cancer. Thus, it was<br />
again confirmed that carbohydrates are not only an energy<br />
source, but also have important impacts on the maintenance<br />
of health. The following recommendations were derived: (1)<br />
the terminology used to describe dietary carbohydrates<br />
should be based primarily on molecular size (degree of<br />
polymerization), with additional terms used to define<br />
nutritional groupings based on physiological properties;<br />
(2) the total carbohydrate in the diet should be measured<br />
as the sum of the individual carbohydrates rather than<br />
‘by difference’, as was also recommended by the 1979
S2<br />
Expert Meeting; (3) the analysis and labelling of dietary<br />
carbohydrate should be based on chemical divisions;<br />
(4) at least 55% of total energy should be provided<br />
from a variety of carbohydrate sources, regardless of<br />
the nature of the dietary pattern; and (5) the glycaemic<br />
index—which measures the impact of foods on the<br />
integrated response of blood glucose—be used to compare<br />
foods of similar composition within food groups<br />
(FAO, 1998).<br />
Two other joint FAO/WHO meetings convened in early<br />
2000 also contributed in part to recommendations relevant<br />
to carbohydrates. These were the Joint WHO/FAO Expert<br />
Consultation on Diet, Nutrition and the Prevention of<br />
Chronic Diseases convened in Geneva, from 28 January to<br />
1 February 2002 (WHO, 2003; Nishida and Shetty, 2004)<br />
and the Technical Workshop on Food Energy—Methods of<br />
Analysis and Conversion Factors held in Rome, from 3 to 6<br />
December 2002 (FAO, 2003).<br />
The overall objective of the 2002 Joint WHO/FAO Expert<br />
Consultation was to update current international recommendations<br />
on diet, nutrition and the prevention of chronic<br />
diseases. The Consultation evaluated the latest scientific<br />
evidence and lessons learned from implementing national<br />
intervention strategies to reduce the burden of noncommunicable<br />
diseases. On the basis of more recent evidence, the<br />
earlier recommendations on population nutrient intake<br />
goals to prevent diet- and nutrition-related chronic diseases<br />
formulated in 1989 by the WHO Study Group (WHO, 1990)<br />
were updated. Industrialization, urbanization, economic<br />
development and market globalization have resulted in<br />
rapid changes in dietary patterns described as ‘nutrition<br />
transition’ which reflects both quantitative and qualitative<br />
changes in the diet. The adverse dietary changes include<br />
shifts in the structure of the diet towards a higher energy<br />
density with a greater role for fat and sugars in foods, greater<br />
saturated fat intake (mostly from animal sources), reduced<br />
intakes of complex carbohydrates and dietary fibre and<br />
reduced fruit and vegetable intakes (WHO, 2003). This,<br />
together with a decline in energy expenditure associated<br />
with a sedentary lifestyle, has significantly impacted the<br />
health and nutritional status of the population. This<br />
phenomenon has been most marked in developing countries<br />
and those undergoing rapid socioeconomic transition, and<br />
has contributed to the increasing burden of diet- and<br />
nutrition-related noncommunicable diseases, such as obesity,<br />
type II diabetes, cardiovascular disease, including<br />
hypertension and stroke, and some forms of cancer. Population<br />
nutrient intake goals updated by this Consultation have<br />
provided the basis for dietary recommendations for the<br />
prevention of these diseases when formulating national<br />
dietary guidelines and national food and nutrition policy.<br />
The outcomes and recommendations of the Consultation<br />
also provided the scientific basis for the WHO Global<br />
Strategy on Diet, Physical Activity and Health endorsed by<br />
the 57th World Health Assembly (WHA 57.17) in 2004<br />
(WHO, 2004).<br />
European Journal of Clinical Nutrition<br />
FAO/WHO Scientific Update on carbohydrates<br />
C Nishida and F Martinez Nocito<br />
The range of population nutrient intake goals for carbohydrates<br />
recommended by the Consultation was 55–75% of<br />
total energy (WHO, 2003), the same as that recommended<br />
by the 1989 WHO Study Group (WHO, 1990). The wide<br />
range was based on the consideration of protein and fat<br />
requirements as well as the observation that intakes of<br />
carbohydrates over this range were not always compatible<br />
with optimal human health. Furthermore, the Consultation<br />
emphasized that the aim of the recommendation was to<br />
maximize the intake of minimally processed carbohydrates<br />
and minimize the intake of free sugars (o10% of energy<br />
intake). The Consultation further indicated that regular<br />
consumption of whole-grain cereals, fruits and vegetables,<br />
which are preferred sources of nonstarch polysaccharides,<br />
were likely to reduce the risk of diet- and nutrition-related<br />
noncommunicable diseases. The Consultation agreed that<br />
the best definition of dietary fibre remains to be established,<br />
given the potential benefits of resistant starch (WHO, 2003).<br />
The 2002 FAO Technical Workshop on Food Energy—<br />
Methods of Analysis and Conversion Factors (FAO, 2003) was<br />
organized as a follow-up to the 2001 Joint FAO/WHO/UNU<br />
Expert Consultation on Human Energy Requirements convened<br />
in Rome, 17–24 October 2001 (FAO, 2004; Shetty and<br />
Martinez Nocito, 2005) to review the issue of how best to<br />
match energy requirements with food intakes, given the new<br />
energy requirement values based on energy expenditure. The<br />
Technical Workshop also addressed the request made by the<br />
Codex Committee on Nutrition and Foods for Special<br />
Dietary Usages (CCNFSDU) for harmonizing energy conversion<br />
factors, and thus enabled uniformity in labelling and<br />
information provided to consumers (CCNFSDU, 2001,<br />
2002). The workshop reviewed the commonly used analytical<br />
methods for protein, fat and carbohydrate, and made<br />
recommendations regarding the preferred state-of-the-art<br />
methods and the most appropriate technology, as well as<br />
existing acceptable methods used in the absence of preferred<br />
methods.<br />
FAO/WHO Scientific Update on carbohydrates in<br />
human nutrition<br />
As part of the normative work and the complimentary<br />
mandates of the two organizations to periodically update<br />
nutrient requirements and regularly develop related global<br />
guidelines, FAO and WHO have been exploring the possibility<br />
of holding an expert consultation to update the work of<br />
the 1997 Expert Consultation. Considered necessary given<br />
the developments and other relevant recommendations<br />
made during the intervening period, including those from<br />
the 2002 Joint WHO/FAO Expert Consultation (WHO, 2003),<br />
FAO and WHO agreed in 2005 to undertake a scientific<br />
update on some of the key issues related to carbohydrates in<br />
human nutrition. The key issues identified included terminology<br />
and classification, measurement, physiology, carbohydrates<br />
and diseases (that is, obesity, diabetes mellitus,
cardiovascular diseases and cancer), and glycaemic index<br />
and glycaemic load. This update of existing knowledge and<br />
evidence relating to the current recommendations was<br />
viewed as essential in the process leading up to a forthcoming<br />
Expert Consultation on Carbohydrates in Human<br />
Nutrition.<br />
Process of undertaking the scientific update and<br />
criteria for selecting experts<br />
The process and criteria for selecting experts to be invited to<br />
prepare the scientific papers on each identified issue relating<br />
to carbohydrates were discussed and agreed upon by FAO<br />
and WHO. The identification of the issues to be reviewed<br />
and possible experts to prepare these papers began in June<br />
2005. The names of possible experts who might prepare or<br />
peer-review each scientific review paper were identified after<br />
consulting various other nutrition experts on the basis of<br />
their competency and expertise in each of the identified<br />
areas of work, as well as their independence. The consultation<br />
and review of selecting possible experts continued until<br />
September 2005. It was agreed that the review papers would<br />
be a thorough scientific update of those identified issues<br />
related to carbohydrates and of topics for further consideration,<br />
both of which are presented in this supplement. It was<br />
further agreed that the outcomes of this review process<br />
should be seen as the conclusions of the scientific update,<br />
not as updated recommendations.<br />
By June 2006, the scientific review papers had been<br />
completed and peer-reviewed. The papers were then further<br />
examined, together with peer reviewer comments, at an<br />
authors’ meeting held in Geneva from 17 to 18 July 2006, to<br />
identify any gaps or issues needing further consideration<br />
before being finalized. The authors’ meeting was also<br />
attended by selected expert peer reviewers to ensure a high<br />
level of critical review and analysis of each paper. Taking the<br />
critical comments received from the peer-review process and<br />
the discussions at the authors’ meeting, the scientific review<br />
papers were further revised and sent for a second round of<br />
peer review before their finalization.<br />
Transparency of the process<br />
Forty experts were involved in this scientific update, serving<br />
either as an author of a review paper or as an expert peer<br />
reviewer. Before being officially invited to take part in this<br />
work, all experts were requested to declare any possible<br />
conflict of interest to ensure the integrity of each expert’s<br />
contribution. These declarations of interest, which were<br />
carefully assessed by FAO and WHO, would be publicly<br />
disclosed after obtaining the expert’s agreement in writing to<br />
do so. Public disclosure of experts’ declaration of interest<br />
involved (1) announcing the declarations at the authors’<br />
meeting; and (2) appropriately disclosing the declaration in<br />
FAO/WHO Scientific Update on carbohydrates<br />
C Nishida and F Martinez Nocito<br />
the subsequent publication of the papers prepared for the<br />
scientific update, that is, this supplement. The primary<br />
purpose of this transparency was to ensure open and<br />
productive debate on the key issues selected for the scientific<br />
update by providing insight into the differing perspectives of<br />
all participating experts.<br />
The review papers published in this supplement provide<br />
the rationale and scientific basis supporting the conclusions<br />
and proposals presented by the Scientific Update. In<br />
addition, they provide the scientific community with a<br />
valuable resource relating to several important nutrition<br />
topics. Rapid progress is taking place in a number of<br />
scientific fields that affect issues related to human nutrient<br />
requirements. Evidence derived from a range of different<br />
scientific approaches has helped to clarify the role of diet,<br />
some individual dietary components and even particular<br />
nutrients in the aetiology of various diseases. Thus, changes<br />
in diet have strong effects, both positive and negative, on the<br />
health and nutritional status of people throughout the life<br />
course, and the potential to promote human health and<br />
reduce the risk of a number of chronic diseases. FAO and<br />
WHO are committed to continue to provide scientifically<br />
sound, evidence-based advice and guidelines on human<br />
nutrient requirements and other related topics through a<br />
transparent and neutral process.<br />
Acknowledgements<br />
Special acknowledgement and deep appreciation are expressed<br />
by FAO and WHO to Dr Kraisid Tontisirin, the former<br />
Director, Nutrition and Consumer Protection Division in<br />
FAO; and Dr Prakash Shetty, the former Chief, Nutrition<br />
Planning, Assessment and Evaluation Service in the Nutrition<br />
and Consumer Protection Division, FAO, for their<br />
tremendous support and invaluable contributions in undertaking<br />
the Joint FAO/WHO Scientific Update on Carbohydrates<br />
in Human Nutrition. FAO and WHO also wish to<br />
express special appreciation to the authors of the review<br />
papers prepared for the Scientific Update, as well as the<br />
expert peer reviewers, who critically evaluated the review<br />
papers and provided valuable comments and contributions.<br />
We also thank Dr Denise Costa Coitinho, former Director,<br />
Department of Nutrition for Health and Development,<br />
WHO; Dr Ezzeddine Boutrif, Director, Nutrition and Consumer<br />
Protection Division, FAO; and Dr Jorgen Schlundt,<br />
Director, Department of Food Safety, Zoonoses and Foodborne<br />
Diseases and Acting Director, Department of Nutrition<br />
for Health and Development, for their sustained support in<br />
carrying out and completing this scientific work.<br />
Conflict of interest<br />
The authors, Dr Chizuru Nishida and Mr Frank Martinez<br />
Nocito, declare no conflict of interest.<br />
S3<br />
European Journal of Clinical Nutrition
S4<br />
References<br />
FAO/WHO Scientific Update on carbohydrates<br />
C Nishida and F Martinez Nocito<br />
CCNFSDU (2001). 23rd Session, November 2001 (ALINORM 03/26,<br />
paragraphs 133-137). Codex Committee on Nutrition and Foods<br />
for Special Dietary Uses (CCNFSDU).<br />
CCNFSDU (2002). 24th Session, November 2002 (ALINORM 03/26A,<br />
paragraphs 113-115). Codex Committee on Nutrition and Foods<br />
for Special Dietary Uses (CCNFSDU).<br />
FAO (1980). Carbohydrates in human nutrition. Report of a Joint FAO/<br />
WHO expert meeting. FAO Food and Nutrition Paper No. 15 Food<br />
and Agriculture Organization of the United Nations: Rome.<br />
FAO (1998). Carbohydrates in human nutrition. Report of a Joint FAO/<br />
WHO Expert Consultation. FAO Food and Nutrition Paper No. 66<br />
Food and Agriculture Organization of the United Nations: Rome.<br />
FAO (2003). Food energy—methods of analysis and conversion factors.<br />
Report of a technical workshop. FAO Food and Nutrition Paper No.<br />
77 Food and Agriculture Organization of the United Nations: Rome.<br />
FAO (2004). Human energy requirements Report of a Joint FAO/WHO/<br />
UNU Expert Consultation. FAO Food and Nutrition Technical<br />
European Journal of Clinical Nutrition<br />
Report Series No.1 Food and Agriculture Organization of the<br />
United Nations: Rome.<br />
Nishida C, Shetty PS (eds). (2004). Diet, nutrition and the prevention<br />
of chronic diseases. Background papers of the Joint WHO/<br />
FAO Expert Consultation. Public Health Nutr 7 (Suppl 1A),<br />
S99–S250.<br />
Shetty PS, Martinez Nocito F (eds). (2005). Human energy requirements.<br />
Background papers of the Joint FAO/WHO/UNU expert<br />
consultation. Public Health Nutr 8 (Suppl 7A), S929–S1228.<br />
Weisell R (2002). The process of determining nutritional requirements.<br />
Food Nutr Agric 30, 14–21.<br />
WHO (1990). Diet, nutrition and the prevention of chronic diseases.<br />
Report of a WHO Study Group. WHO Technical Report Series No.<br />
797 World Health Organization: Geneva.<br />
WHO (2003). Diet, nutrition and the prevention of chronic diseases.<br />
Report of a Joint WHO/FAO Expert Consultation. WHO Technical<br />
Report Series No. 916 World Health Organization: Geneva.<br />
WHO (2004). Global Strategy on Diet, Physical Activity and Health.<br />
World Health Organization: Geneva.
REVIEW<br />
Carbohydrate terminology and classification<br />
JH Cummings 1 and AM Stephen 2<br />
1 Gut group, Division of Pathology and Neuroscience, Ninewells Hospital and Medical School, Dundee, UK and 2 Population Nutrition<br />
Research, MRC Human Nutrition Research, Elsie Widdowson Laboratory, Cambridge, UK<br />
Dietary carbohydrates are a group of chemically defined substances with a range of physical and physiological properties and<br />
health benefits. As with other macronutrients, the primary classification of dietary carbohydrate is based on chemistry, that is<br />
character of individual monomers, degree of polymerization (DP) and type of linkage (a or b), as agreed at the Food and<br />
Agriculture Organization/World Health Organization Expert Consultation in 1997. This divides carbohydrates into three main<br />
groups, sugars (DP 1–2), oligosaccharides (short-chain carbohydrates) (DP 3–9) and polysaccharides (DPX10). Within this<br />
classification, a number of terms are used such as mono- and disaccharides, polyols, oligosaccharides, starch, modified starch,<br />
non-starch polysaccharides, total carbohydrate, sugars, etc. While effects of carbohydrates are ultimately related to their primary<br />
chemistry, they are modified by their physical properties. These include water solubility, hydration, gel formation, crystalline<br />
state, association with other molecules such as protein, lipid and divalent cations and aggregation into complex structures in cell<br />
walls and other specialized plant tissues. A classification based on chemistry is essential for a system of measurement, predication<br />
of properties and estimation of intakes, but does not allow a simple translation into nutritional effects since each class of<br />
carbohydrate has overlapping physiological properties and effects on health. This dichotomy has led to the use of a number of<br />
terms to describe carbohydrate in foods, for example intrinsic and extrinsic sugars, prebiotic, resistant starch, dietary fibre,<br />
available and unavailable carbohydrate, complex carbohydrate, glycaemic and whole grain. This paper reviews these terms and<br />
suggests that some are more useful than others. A clearer understanding of what is meant by any particular word used to<br />
describe carbohydrate is essential to progress in translating the growing knowledge of the physiological properties of<br />
carbohydrate into public health messages.<br />
European Journal of Clinical Nutrition (2007) 61 (Suppl 1), S5–S18. doi:10.1038/sj.ejcn.1602936<br />
Keywords: carbohydrate; sugars; oligosaccharides; starch; dietary fibre; classification<br />
Introduction<br />
The dietary carbohydrates are a diverse group of substances<br />
with a range of chemical, physical and physiological properties.<br />
While carbohydrates are principally substrates for<br />
energy metabolism, they can affect satiety, blood glucose<br />
and insulin, lipid metabolism and, through fermentation,<br />
exert a major control on colonic function, including bowel<br />
habit, transit, the metabolism and balance of the commensal<br />
flora and large bowel epithelial cell health. They may also be<br />
immunomodulatory and influence calcium absorption.<br />
These properties have implications for our overall health;<br />
contributing particularly to the control of body weight,<br />
diabetes and ageing, cardiovascular disease, bone mineral<br />
Correspondence: Professor JH Cummings, Division of Pathology and<br />
Neuroscience, Ninewells Hospital and Medical School, Dundee DD1 9SY, UK.<br />
E-mail: j.h.cummings@dundee.ac.uk<br />
European Journal of Clinical Nutrition (2007) 61 (Suppl 1), S5–S18<br />
& 2007 Nature Publishing Group All rights reserved 0954-3007/07 $30.00<br />
www.nature.com/ejcn<br />
density, large bowel cancer, constipation and resistance to<br />
gut infection.<br />
Classification<br />
As for other macronutrients, the primary classification of<br />
dietary carbohydrates, as proposed at the Joint Food and<br />
Agriculture Organization (FAO)/World Health Organization<br />
(WHO) Expert Consultation on Carbohydrates in human<br />
nutrition convened in Rome in 1997 (FAO, 1998), is by<br />
molecular size, as determined by degree of polymerization<br />
(DP), the type of linkage (a or non-a) and character of<br />
individual monomers (Table 1). This classification is analogous<br />
to that used for dietary fat, which is based on carbon<br />
chain length, number and position of double bonds and<br />
their configuration as cis or trans. A chemical approach is<br />
necessary for a coherent and enforceable approach to<br />
measurement and labelling forms the basis for terminology
S6<br />
Table 1 The major dietary carbohydrates<br />
Class (DP a ) Subgroup Principal components<br />
Sugars (1–2) Monosaccharides Glucose, fructose, galactose<br />
Disaccharides Sucrose, lactose, maltose,<br />
Oligosaccharides<br />
(3–9) (short-chain<br />
carbohydrates)<br />
Polysaccharides<br />
(X10)<br />
and an understanding of the physiological and health effects<br />
of these macronutrients.<br />
A chemical approach divides carbohydrates into three<br />
main groups, sugars (DP1–2), oligosaccharides (short-chain<br />
carbohydrates) (DP3–9) and polysaccharides (DPX10).<br />
Sugars comprise (i) monosaccharides, (ii) disaccharides and<br />
(iii) polyols (sugar alcohols). Oligosaccharides are either (a)<br />
malto-oligosaccharides (a-glucans), principally occurring<br />
from the hydrolysis of starch and (b) non-a-glucan such as<br />
raffinose and stachyose (a galactosides), fructo- and galactooligosaccharides<br />
and other oligosaccharides. Polysaccharides<br />
may be divided into starch (a-1:4 and 1:6 glucans) and nonstarch<br />
polysaccharides (NSPs), of which the major components<br />
are the polysaccharides of the plant cell wall such as<br />
cellulose, hemicellulose and pectin but also includes plant<br />
gums, mucilages and hydrocolloids. Some carbohydrates,<br />
like inulin, do not fit neatly into this scheme because they<br />
exist in nature in multiple molecular forms. Inulin, GFN,<br />
from plants may have from 2 to 200 fructose units and so<br />
crosses the boundary between oligosaccharides and polysaccharides<br />
(Roberfroid, 2005).<br />
A variety of methodologies are available for the measurement<br />
of the carbohydrate content of food and the components<br />
are listed in Table 1 (Englyst et al., 2007).<br />
Terminology<br />
Polyols (sugar<br />
alcohols)<br />
Maltooligosaccharides<br />
(a-glucans)<br />
Non-a-glucan<br />
oligosaccharides<br />
Carbohydrate terminology and classification<br />
JH Cummings and AM Stephen<br />
trehalose<br />
Sorbitol, mannitol, lactitol,<br />
xylitol, erythritol, isomalt,<br />
maltitol<br />
Maltodextrins<br />
Raffinose, stachyose, fructo and<br />
galacto oligosaccharides,<br />
Starch<br />
polydextrose, inulin<br />
Amylose, amylopectin, modified<br />
(a-glucans) starches<br />
Non-starch Cellulose, hemicellulose, pectin,<br />
polysaccharides arabinoxylans, b-glucan,<br />
(NSPs)<br />
glucomannans, plant gums and<br />
mucilages, hydrocolloids<br />
a Degree of polymerization or number of monomeric (single sugar) units.<br />
Based on Food and Agriculture Organization/World Health Organization<br />
‘Carbohydrates in Human Nutrition’ report (1998), and Cummings et al.<br />
(1997).<br />
Total carbohydrate<br />
Although the individual components of dietary carbohydrate<br />
are readily identifiable, there is some confusion as to<br />
what comprises total carbohydrate as reported in food tables.<br />
European Journal of Clinical Nutrition<br />
Two principal approaches to total carbohydrate are used,<br />
first, that derived ‘by difference’ and second, the direct<br />
measurement of the individual components that are then<br />
combined to give a total. Calculating carbohydrate ‘by<br />
difference’ has been used since the early 20th century and<br />
is still widely used around the world (Atwater and Woods,<br />
1986; United States Department of Agriculture, 2007). The<br />
moisture, protein, fat, ash and alcohol content of a food are<br />
determined, subtracted from the total weight of the food and<br />
the remainder, or ‘difference’, is considered to be carbohydrate.<br />
There are, however, a number of problems with this<br />
approach in that the ‘by difference’ figure includes noncarbohydrate<br />
components such as lignin, organic acids,<br />
tannins, waxes and some Maillard products. In addition to<br />
this error, it combines all the analytical errors from the other<br />
analyses. Also, a single global figure for carbohydrates in<br />
food is uninformative because it fails to identify the many<br />
types of carbohydrates and thus to allow some understanding<br />
of the potential health benefits of those foods.<br />
Direct analysis of carbohydrate components and summation<br />
to obtain a total carbohydrate value has been the basis<br />
of carbohydrate analysis in the UK since 1929, when the first<br />
values were published by McCance and Lawrence (1929).<br />
Those countries that use McCance and Widdowson’s, The<br />
Composition of Foods (Food Standards Agency/Institute<br />
of Food Research, 2002) also express carbohydrate using<br />
this approach. The total figure obtained is for what McCance<br />
and Lawrence called ‘available carbohydrate’ and therefore<br />
differs from carbohydrate by difference in that it does not<br />
contain the plant cell wall polysaccharides (fibre). In<br />
addition, it is not complicated by analytical difficulties with<br />
other food components. Dietary intake of total carbohydrate<br />
and its components using direct analysis enables examination<br />
of geographic variations and changes in intake over<br />
time of individual carbohydrate types and their relationship<br />
with health outcomes. Total carbohydrate by direct measurement<br />
is preferable and simplified methods to do this should<br />
be developed.<br />
Figures obtained for carbohydrate by difference and<br />
carbohydrate analysed directly are not always the same,<br />
particularly for complex mixtures, and foods containing fibre<br />
or certain types of starch, like pasta (Stephen, 2006). This<br />
results in apparently different carbohydrate intakes for the<br />
same list of foods consumed, as shown in Table 2. Fifty-two<br />
dietary records from a study conducted in Canada, where<br />
carbohydrate by difference is used (Health Canada, 2005)<br />
were subsequently analysed in the UK using values based on<br />
McCance and Widdowson’s The Composition of Foods (Holland<br />
et al., 1991b, 1992). In this study, energy intake was 12%<br />
higher and carbohydrate intake 14% higher when measured<br />
‘by difference’ (Stephen, 2006). Comparison of carbohydrate<br />
intake among different countries should therefore be viewed<br />
with caution if the method of carbohydrate determination is<br />
not the same. Worldwide variations in carbohydrate intake<br />
assumed to be due to differences in types of foods consumed,<br />
are also, in part, due to methodology.
Table 2 Energy and macronutrient intakes for 52 weighed records<br />
analysed using Canadian and UK food tables<br />
Energy<br />
(kcal)<br />
Protein<br />
(g) (%)<br />
Fat<br />
(g) (%)<br />
CHO<br />
(g) (%)<br />
Analysis using Canadian nutrient file<br />
Mean of 52 records 2265 95.9 (16.9) 81.4 (31.5) 294.2 (52.9)<br />
Analysis using ‘The composition of foods’<br />
Mean of 52 records 1992* 89.8 (17.9) 74.5 (32.7) 252.4* (48.5)*<br />
*Po0.001.<br />
From Stephen, 2006.<br />
Sugars<br />
The term ‘sugars’ is conventionally used to describe the<br />
mono- and disaccharides in food.<br />
The three principal monosaccharides are glucose, fructose<br />
and galactose, which are the building blocks of naturally<br />
occurring di-, oligo- and polysaccharides. Free glucose and<br />
fructose occur in honey and cooked or dried fruit (invert<br />
sugar), in small amounts, and in larger amounts in fruit and<br />
berries where they are the main energy source (Holland et al.,<br />
1992). Corn syrup, a glucose syrup produced by the<br />
hydrolysis of cornstarch, and high fructose corn syrup,<br />
containing glucose and fructose, are increasingly used by the<br />
food industry in many countries. Fructose is the sweetest of<br />
all the food carbohydrates. Sugars are used as a sweetener to<br />
improve the palatability of many foods and beverages, and<br />
are also used for food preservation and in jams and jellies.<br />
Sugars confer functional characteristics to foods, like viscosity,<br />
texture, body and browning capacity. They increase<br />
dough yield in baked goods, influence starch and protein<br />
breakdown, and control moisture thus preventing drying out<br />
(Institute of Medicine, 2001).<br />
The polyols, such as sorbitol are alcohols of glucose and<br />
other sugars. They are found naturally in some fruits and are<br />
made commercially by using aldose reductase to convert the<br />
aldehyde group of the glucose molecule to the alcohol.<br />
Sorbitol is used as a replacement for sucrose in the diet of<br />
people with diabetes.<br />
The principal disaccharides are sucrose (a-Glc(1-2)b-Fru)<br />
and lactose (b-Gal(1-4)Glc). Sucrose is found very widely in<br />
fruits, berries and vegetables, and can be extracted from<br />
sugar cane or beet. Lactose is the main sugar in milk. Of the<br />
less abundant disaccharides, maltose, derived from starch,<br />
occurs in sprouted wheat and barley. Trehalose (a-Glc(1-4)<br />
a-Glc) is found in yeast, fungi (mushrooms) and in small<br />
amounts in bread and honey. It is used by the food industry<br />
as a replacement for sucrose where less sweet taste is desired<br />
but with similar technological properties.<br />
Because of the perceived negative impact of sugars on<br />
health, a number of terms have been used to categorize them<br />
more specifically, mainly to highlight their origin and<br />
identify them for labelling purposes, for example total<br />
Carbohydrate terminology and classification<br />
JH Cummings and AM Stephen<br />
sugars, added sugar, free sugars (WHO, 2003), refined sugars<br />
(Nordic Council, 2004), discretionary sugar (New Zealand<br />
Nutrition Foundation, 2004) and intrinsic sugars, milk<br />
sugars and non-milk extrinsic sugars (Department of Health,<br />
1989).<br />
Total sugars<br />
For labelling purposes, the category of total sugars has been<br />
proposed. This includes all sugars from whatever source in a<br />
food, and is defined as ‘all monosaccharides and disaccharides<br />
other than polyols’ (European Communities, 1990).<br />
This term is now accepted by the European Union, Australia<br />
and New Zealand and may well be adopted by other<br />
countries. It is probably the most useful way to describe,<br />
measure and label sugars.<br />
Free sugars<br />
Traditionally ‘free sugars’ referred to any sugars in a food that<br />
were free and not bound (Holland et al., 1992), and included<br />
all mono- and disaccharides present in a food, including<br />
lactose (Southgate, 1978). This term was also used analytically<br />
to describe when the carbohydrate in a food was<br />
hydrolysed and components detected by chromatography or<br />
colorimetric methods (Southgate, 1978). In recent years, the<br />
use of the term ‘free sugars’ has changed, to refer to all<br />
‘monosaccharides and disaccharides added to foods by the<br />
manufacturer, cook and consumer, plus sugars naturally<br />
present in honey, syrups and fruit juices’ and was the<br />
preferred term for the WHO/FAO Expert Consultation on<br />
‘Diet, Nutrition and the Prevention of Chronic Diseases’<br />
(WHO, 2003). This new meaning of the term reflects the<br />
same sources as those captured in the term ‘non-milk<br />
extrinsic sugars’ outlined below. However, it is entirely<br />
different from the traditional use of the term by the analyst,<br />
which is a potential source of confusion.<br />
Added sugars<br />
In the United States, ‘added sugars’ is a commonly used term<br />
and comprises sugars and syrups that are added to foods<br />
during processing or preparation (Institute of Medicine,<br />
2001). In the new United States Department of Agriculture<br />
food composition tables, added sugars are defined as those<br />
sugars added to foods and beverages during processing or<br />
home preparation (Pehrsson et al., 2005). This would include<br />
sugars listed in the ingredient list on a food product,<br />
including honey, molasses, fruit juice concentrate, brown<br />
sugar, corn sweetener, sucrose, lactose, glucose, high-fructose<br />
corn syrup and malt syrup.<br />
Extrinsic and intrinsic sugars<br />
These terms had their origin in a United Kingdom (UK)<br />
Department of Health Committee report in 1989 (Department<br />
S7<br />
European Journal of Clinical Nutrition
S8<br />
Carbohydrate terminology and classification<br />
JH Cummings and AM Stephen<br />
of Health, 1989), which examined the role of sugars in the<br />
diet. The terms were developed ‘to distinguish sugar as<br />
naturally integrated into the cellular structure of a food<br />
(intrinsic) from those that are free in the food or added to it<br />
(extrinsic)’. These were defined in the report as:<br />
Intrinsic sugars. Sugars forming an integral part of certain<br />
unprocessed foodstuffs, that is enclosed in the cell, the most<br />
important being whole fruits and vegetables (containing<br />
mainly fructose, glucose and sucrose). Intrinsic sugars are<br />
therefore naturally occurring and are always accompanied by<br />
other nutrients.<br />
Extrinsic sugars. Sugars not located within the cellular<br />
structure of a food. Extrinsic sugars are mainly found in fruit<br />
juice and are those added to processed foods. Lactose in milk<br />
is extrinsic in that it is not found within the cellular<br />
structure of food and has important nutritional benefits, so<br />
the term non-milk extrinsic sugars was introduced to<br />
indicate the group of sugars, other than intrinsic and milk<br />
sugars, that should be restricted in the diet.<br />
Non-milk extrinsic sugars. All extrinsic sugars, which are<br />
not from milk, that is excluding lactose. This includes fruit<br />
juices and honey and those sugars added to foods as a<br />
sweetener in cooking or at the table, as in hot drinks and<br />
breakfast cereal, or during processing. This terminology has<br />
remained popular among nutritionists in the UK, and is used<br />
in dietary surveys and other reports where intakes are<br />
described (Gibson, 2000; Kelly et al., 2005). However, it is<br />
not well understood by the public and is not used in public<br />
communications about sugars.<br />
Dividing sugars into intrinsic and extrinsic creates problems<br />
for the analyst and, therefore, for food labelling.<br />
While ingredient lists can be used to identify the source of<br />
sugars in foods, analytically it is not readily possible to<br />
distinguish their origin in a processed food.<br />
Other terms in use include ‘sugars’, ‘sugar’, ‘discretionary<br />
sugar’, ‘refined sugars’, ‘refined sugar’, ‘natural sugar’ and<br />
‘total available sugars’ (Stephen and Thane, 2007). Some of<br />
these appear to equate to sucrose only, and within the EU<br />
‘sucrose’ may be designated as ‘sugars’ on food labels<br />
(European Communities, 2000). Many of the terms are used<br />
in publications about intakes, often with little reference to<br />
what components they include. This has the result of<br />
making intake comparisons very difficult and points to the<br />
need for a uniform terminology. There is little justification<br />
for most of these terms apart from total sugars and their<br />
subdivision into mono- and disaccharides. The relation of<br />
sugars to health is determined more by the food matrix<br />
in which they are contained and more thought should be<br />
given to characterizing this because it also affects the other<br />
nutrients in the food, and these many alternative terms do<br />
not really describe a property of sugars per se.<br />
Oligosaccharides, short-chain carbohydrates<br />
‘Oligosaccharides are compounds in which monosaccharide<br />
units are joined by glycosidic linkages’. Their DP has been<br />
European Journal of Clinical Nutrition<br />
variously defined as including anything from 2 to 19<br />
monosaccharide units (http://www.britannica.com/eb/<br />
article-9057022/oligosaccharide; British Nutrition Foundation,<br />
1990; Food and Drug Administration, 1993). However, the<br />
disaccharides (DP2) are thought of as sugars by nutritionists<br />
(Roberfroid et al., 1993; Asp, 1995; Cummings and Englyst,<br />
1995; Southgate, 1995), although a disaccharide composed<br />
of two fructose residues, for example inulobiose, is considered<br />
a fructan (Roberfroid, 2005).<br />
The dividing line between oligo- and polysaccharides is<br />
also arbitrary since there is a continuum of molecular size<br />
from simple sugars to complex polymers of DP 100 000 or<br />
more in food. Most authorities recommend a DP of 10 as<br />
the dividing point between oligo- and polysaccharides (IUB–<br />
IUPAC and Joint Commission on Biochemical Nomenclature,<br />
1982), although in the most recent International Union<br />
of Pure and Applied Chemistry–International Union of<br />
Biochemistry Nomenclature Recommendation the issue is<br />
not really addressed and a polysaccharide is just considered<br />
to be ‘a macromolecule consisting of a large number of<br />
monosaccharide (glycose) residues joined to each other by<br />
glycosidic linkages’ (IUPAC–IUB Joint Commission on<br />
Biochemical Nomenclature, 1996).<br />
In practice, precipitation from aqueous solutions with<br />
80%v/v ethanol is the step used in many carbohydrate<br />
analysis procedures to separate these two groups (Southgate,<br />
1991; Prosky et al., 1992; Englyst et al., 1994). However, some<br />
branched-chain carbohydrates of DP between 10 and 100<br />
remain in solution in 80% v/v ethanol so there is no clear<br />
and absolute division. Furthermore, carbohydrates such as<br />
inulin and polydextrose contain mixtures of polymers of<br />
different chain lengths that cross the oligosaccharide/polysaccharide<br />
boundary. In categorizing oligosaccharides found<br />
normally in the diet, alcohol precipitation would seem to be<br />
the most practical way of delineating them from polysaccharides.<br />
For novel oligosaccharides, such as that are now<br />
being developed by the food industry as ingredients, the<br />
average DP for that particular substance, as determined by<br />
the manufacturer, should provide the basis on which to put<br />
it into the appropriate carbohydrate class. In the light of the<br />
lack of clarity surrounding the definition of oligosaccharides,<br />
the Paris carbohydrate group suggested calling this group<br />
‘short-chain carbohydrates’ (Cummings et al., 1997).<br />
Food oligosaccharides fall into two groups: (i) maltodextrins,<br />
which are mostly derived from starch and include<br />
maltotriose and a-limit dextrins that have both a1–4 and<br />
a1–6 bonds and an average DP8. Maltodextrins are widely<br />
used in the food industry as sweeteners, fat substitutes and to<br />
modify the texture of food products. They are digested and<br />
absorbed like other a-glucans and (ii) oligosaccharides that<br />
are not a-glucans. These oligosaccharides include raffinose<br />
(a-Gal(1-6)a-Glc(1-2)b-Fru), stachyose ((Gal)2 1:6 Glu 1:2<br />
Fru) and verbascose ((Gal)3 1:6 Glu 1:2 Fru). They are in<br />
effect, sucrose joined to varying numbers of galactose<br />
molecules and are found in a variety of plant seeds, for<br />
example peas, beans and lentils. Also important in this group
are inulin and fructo oligosaccharides (a-Glc(1-2)b-Fru(2-1)<br />
b-Fru (N) or b-Fru(2-1)b-Fru (N)). They are fructans and are the<br />
storage carbohydrates in artichokes and chicory with small<br />
amounts of low molecular weight found in wheat, rye,<br />
asparagus and members of the onion, leek and garlic family.<br />
They can be produced industrially. The chemical bonds<br />
linking these oligosaccharides are not a-1,4 or 1,6 glucans<br />
and, therefore, they are not susceptible to pancreatic or<br />
brush border enzyme breakdown (Oku et al., 1984; Hidaka<br />
et al., 1986; Cummings et al., 2001). They have become<br />
known as ‘non-digestible oligosaccharides’ (Roberfroid et al.,<br />
1993). Some of them, mainly the fructans and galactans,<br />
have unique properties in the gut and are known as<br />
prebiotics (see later).<br />
Milk oligosaccharides<br />
Milk, especially human milk, contains oligosaccharides that<br />
are predominantly galactose containing, although great<br />
diversity of structure is found (Kunz et al., 2000). Almost<br />
all carry lactose at their reducing end and are elongated by<br />
addition of N-acetylglucosamine-linked b1–3 or b1–6 to a<br />
galactose residue, followed by further galactose with b1–3 or<br />
b1–4 bonds. Other monomers include L-fucose and sialic<br />
acid. The principal oligosaccharide in milk is lacto-Ntetraose.<br />
Total oligosaccharides in human milk are in the<br />
range 5.0–8.0 g/l, but only trace amounts are present in cow’s<br />
milk (Ward et al., 2006).<br />
The oligosaccharides of breast milk have long been<br />
credited with being the principal growth factor for bifidobacteria<br />
in the infant gut and thus primarily responsible for<br />
these bacteria dominating the microbiota found in breast-fed<br />
babies. In this context, milk oligosaccharides are acting as<br />
prebiotics. Bifidobacteria can grow on milk oligosaccharides<br />
as their sole carbon source while lactobacilli may not be able<br />
to do so (Ward et al., 2006). The similarities between milk<br />
oligosaccharide structure and epithelial cell surface carbohydrates<br />
in the gut suggest that milk oligosaccharides may act<br />
as soluble receptors for gut pathogens and thus form an<br />
essential part of colonization resistance. They may also be<br />
immunomodulatory.<br />
Starch and modified starch<br />
Starch, the principal carbohydrate in most diets, is the<br />
storage carbohydrate of plants such as cereals, root vegetables<br />
and legumes and consists of only glucose molecules. It<br />
occurs in a partially crystalline form in granules and<br />
comprises two polymers: amylose (DPB10 3 ) and amylopectin<br />
(DPB10 4 –10 5 ). Most common cereal starches contain<br />
15–30% amylose, which is a non-branching helical chain of<br />
glucose residues linked by a-1,4 glucosidic bonds. Amylopectin<br />
is a high-molecular-weight, highly branched polymer<br />
containing both a-1,4 and a-1,6 linkages. Some starches from<br />
maize, rice, sorghum and barley contain largely amylopectin<br />
and are known as ‘waxy’. The crystalline form of the amylose<br />
Carbohydrate terminology and classification<br />
JH Cummings and AM Stephen<br />
and amylopectin in the starch granules confers on them<br />
distinct X-ray diffraction patterns, A, B and C. The A type is<br />
characteristic of cereals (rice, wheat and maize), the B type of<br />
potato, banana and high amylose starches while the C type is<br />
intermediate between A and B and found in legumes. In their<br />
native (raw) form, the B starches are resistant to digestion by<br />
pancreatic amylase. The crystalline structure is lost when<br />
starch is heated in water (gelatinization), thus permitting<br />
digestion to take place. Recrystallization (retrogradation)<br />
takes place to a variable extent after cooking and is in the B<br />
form (Galliard, 1987; Hoover and Sosulski, 1991).<br />
Modified starch<br />
The proportions of amylose and amylopectin in a starchy<br />
food are variable and can be altered by plant breeding.<br />
Different cultivars of common species such as rice, have a<br />
wide range of amylose to amylopectin ratios (Kennedy and<br />
Burlingame, 2003). Techniques are rapidly emerging,<br />
enabling starches to be produced for specific purposes by<br />
genetically modifying the crop used for their production<br />
(Regina et al., 2006). High amylose cornstarch and high<br />
amylopectin (waxy) cornstarch have been available for some<br />
time, and display quite different functional as well as<br />
nutritional properties. High amylose starches require higher<br />
temperatures for gelatinization and are more prone to<br />
retrograde and to form amylose–lipid complexes. Such<br />
properties can be utilized in the formation of foods with<br />
high-resistant starch (RS) content.<br />
Starches can also be modified chemically to impart functional<br />
properties needed to produce certain qualities in<br />
foodstuffs such as a decrease in viscosity and to improve gel<br />
stability, mouth feel, appearance and texture, and resistance to<br />
heat treatment. Various processes are used to modify starch,<br />
the two most important being substitution and crosslinking.<br />
Substitution involves etherification or esterification of a<br />
relatively small number of hydroxyl groups on the glucose<br />
units of amylose and amylopectin. This reduces retrogradation,<br />
which is part of the process of staling of bread, for<br />
example. Substitution also lowers gelatinization temperature,<br />
provides freeze–thaw stability and increases viscosity. Crosslinking<br />
involves the introduction of a limited number of<br />
linkages between the chains of amylose and amylopectin. The<br />
process reinforces hydrogen bonding, which occurs within the<br />
granule. Crosslinking increases gelatinization temperature,<br />
improves acid and heat stability, inhibits gel formation and<br />
controls viscosity during processing. Altering the chemical<br />
nature of starch can lead to it becoming resistant to digestion.<br />
NSPs<br />
NSPs are the non-a-glucan polysaccharides of the diet<br />
(Table 1). They are essentially ‘macromolecules consisting<br />
of a large number of monosaccharides (glycose) residues<br />
joined to each other by glycosidic linkages’ (IUB-IUPAC and<br />
Joint Commission on Biochemical Nomenclature, 1982) and<br />
S9<br />
European Journal of Clinical Nutrition
S10<br />
are principally found in the plant cell wall. The term NSP was<br />
first proposed at a meeting sponsored by the European<br />
Economic Community Committee on Medical Research in<br />
Cambridge in December 1978. The meeting was convened to<br />
discuss the results of the analysis of nine foods for ‘dietary<br />
fibre’ by a number of different methods in use in laboratories<br />
around the world. The proposal was made because ‘An<br />
accurate chemical identification of polysaccharides in the<br />
diet is the first priorityy’ (James and Theander, 1981). At<br />
the meeting, the first NSP values, measured as the sum of<br />
constituent sugars, were presented for a selection of the<br />
test samples (James and Theander, 1981). NSPs are the most<br />
diverse of all the carbohydrate groups and comprise a<br />
mixture of many molecular forms, of which cellulose, a<br />
straight chain b1–4-linked glucan (DP 10 3 –10 6 ) is the most<br />
widely distributed. Because of its linear, unbranched nature,<br />
cellulose molecules are able to pack closely together in a<br />
three-dimensional latticework forming microfibrils. These<br />
form the basis of cellulose fibres, which are woven into the<br />
plant cell wall and give it structure. Cellulose comprises<br />
between 10 and 30% of the NSP in foods (Holland et al.,<br />
1988, 1991a, 1992).<br />
In contrast, the hemicelluloses are a large group of<br />
polysaccharide hetero polymers, which contain a mixture<br />
of hexose (6C) and pentose (5C) sugars, often in highly<br />
branched chains. Mostly, they comprise a backbone of xylose<br />
sugars with branches of arabinose, mannose, galactose and<br />
glucose and have a DP of 150–200. Typical of the hemicelluloses<br />
are the arabinoxylans found in cereals. About half<br />
of hemicelluloses contain uronic acids, which are carboxylated<br />
derivatives of glucose and galactose. They are important<br />
in determining the properties of hemicelluloses,<br />
behaving as carboxylic acids and are able to form salts with<br />
metal ions such as calcium and zinc.<br />
Common to all cell walls is, pectin, which is primarily a<br />
1–4b-D galacturonic acid polymer, although 10–25% other<br />
sugars such as rhamnose, galactose and arabinose, may also<br />
be present as side chains. Between 3 and 11% of the uronic<br />
acids have methyl substitutions, which improve the gelforming<br />
properties of pectin, as used in jam making. Some<br />
residues are acetylated. Calcium and magnesium complexes<br />
with uronic acids are characteristic of pectins.<br />
Chemically related to the cell wall NSP, but not strictly cell<br />
wall components, are the plant gums and mucilages. Plant<br />
gums are sticky exudates that form at the sites of injuries to<br />
plants. Many are highly branched complex uronic acid<br />
containing polymers, such as Gum Arabic, named after the<br />
Arabian port from which it was originally exported to Europe.<br />
It comes from the Acacia tree and is one of the better known<br />
plant gums, being sold commercially as an adhesive and used<br />
in the food industry as a thickener and to retard sugar<br />
crystallization. Other plant gums include karaya (sterculia),<br />
guar, locust bean gum, xanthan and tragacanth, all of which<br />
are licensed food additives (Saltmarsh, 2000).<br />
Plant mucilages are botanically distinct in that they are<br />
usually mixed with the endosperm of storage carbohydrates<br />
European Journal of Clinical Nutrition<br />
Carbohydrate terminology and classification<br />
JH Cummings and AM Stephen<br />
of seeds. Their role is to retain water and prevent desiccation.<br />
They are neutral polysaccharides like the hemicelluloses, of<br />
which guar gum, from the cluster bean (Cyamopsis tetragonolobus),<br />
and carob gums are similar 1–4b-D galactomannans<br />
with 1–6a-galactose single-unit side chains. Again, they<br />
are widely used in the food and pharmaceutical industries as<br />
thickeners and stabilizers in mayonnaise, soups and toothpastes.<br />
The algal polysaccharides, which include carageenan, agar<br />
and alginate, are all NSP extracted from seaweeds or algae.<br />
They replace cellulose in the cell wall and have gel-forming<br />
properties. Carageenan and agar, are highly sulphated and<br />
the ability of carageenan to react with milk protein has led to<br />
its use in dairy products and chocolate.<br />
Up-to-date values for the NSP content of foods are<br />
published (Food Standards Agency/Institute of Food<br />
Research, 2002).<br />
Terminology based on physiology<br />
In classifying dietary carbohydrate by its chemistry, the<br />
principal challenge is to reconcile the various chemical<br />
divisions with those that reflect physiology and health. A<br />
classification based purely on chemistry does not allow a<br />
simple translation into nutritional benefits since each of<br />
the major chemical classes of carbohydrate has a variety of<br />
overlapping physiological effects (Table 3). Terminology<br />
based on physiological properties helps to focus on the<br />
potential health benefits of carbohydrate, and identify foods<br />
that are likely to be part of a healthy diet. But, as can be seen<br />
from Table 4, each physiological or health benefit of<br />
carbohydrate is attributable to several subgroups from the<br />
main classification (Table 1). Moreover, this approach is<br />
always open to the possibility of extensive revision, as new<br />
physiological properties of dietary carbohydrates become<br />
known. For example, the concept of prebiosis has added a<br />
new dimension to understanding of how carbohydrates<br />
behave in both the small and large intestines.<br />
The physiology of carbohydrate can vary among individuals<br />
and populations. The classic example is lactose, which<br />
is poorly hydrolysed by the small bowel mucosa of all adults<br />
except Caucasians, most of whom retain the ability to digest<br />
lactose into adult life. Additionally, within any simple<br />
chemical group of carbohydrate, for example polyols, wide<br />
variation in absorption may occur, ranging from almost<br />
complete absorption of erythritol, to complete lack of<br />
absorption of lactitol (Livesey, 2003). Similarly, starch may<br />
have a variety of fates in the gut depending on granule<br />
structure, whether raw or cooked and subsequent processing,<br />
for example freezing (Stephen et al., 1983; Englyst et al.,<br />
1992; Silvester et al., 1995). Furthermore, terminology based<br />
on physiological properties alone provides the analyst with<br />
an impossible target.<br />
This dichotomy has led to the introduction of a number of<br />
terms to describe various fractions and subfractions of
Table 3 Principal physiological properties of dietary carbohydrates<br />
Provide<br />
energy<br />
Increase<br />
satiety<br />
Glycaemic a<br />
Cholesterol<br />
lowering<br />
carbohydrate and these are listed in Table 5. However, the<br />
problems are by no means insurmountable in reconciling<br />
these different objectives for classification. With a sound<br />
chemical identification for all the carbohydrates, it is then<br />
possible to group them according to their health and<br />
physiological effects.<br />
Prebiotics<br />
‘A prebiotic is a non-digestible food ingredient that beneficially<br />
affects the host by selectively stimulating the growth<br />
and/or activity of one of a limited number of bacteria in the<br />
colon, and thus improves host health’ (Gibson and Roberfroid,<br />
1995; Gibson et al., 2004).<br />
As a group, prebiotics are thus defined by a single<br />
physiological parameter, although this is by no means itself<br />
clearly established (Macfarlane et al., 2006). Analytically<br />
they cross the boundaries between disaccharides and<br />
polysaccharides (DPX10) (van Loo et al., 1995). It is likely<br />
in the future that a wider spectrum from the point of DP and<br />
molecular form of carbohydrates will be shown to be<br />
prebiotic. Prebiotic carbohydrates have unexpected properties<br />
in the gut in that they alter the balance of the gut<br />
microflora towards what is considered to be a more healthy<br />
one (Macfarlane et al., 2006). They have been shown to<br />
increase calcium absorption and bone mineral density in<br />
Increase calcium<br />
absorption<br />
Source of<br />
SCFA b<br />
Alter balance<br />
of microflora<br />
(prebiotic)<br />
Increase stool<br />
output<br />
Monosaccharides | |<br />
Disaccharides | | |<br />
Polyols | | c<br />
|<br />
Maltodextrins | |<br />
Oligosaccharides<br />
(non-a-glucan)<br />
| | | | |<br />
Starch | | | d<br />
| d<br />
NSP | | | e<br />
| |<br />
a<br />
Provides carbohydrate for metabolism (FAO, 1998).<br />
b<br />
Short chain fatty acids.<br />
c<br />
Except erythritol.<br />
d<br />
Resistant starch.<br />
e<br />
Some forms of non-starch polysaccharide (NSP) only.<br />
Table 4 Physiological/health groupings of dietary carbohydrate<br />
Glucose, fructose, galactose, sucrose, lactose,<br />
maltose, trehalose, maltodextrins, starch<br />
Non-glycaemic Polyols, oligosaccharides (non-a-glucan), resistant<br />
Glycaemic a<br />
Increase stool<br />
output<br />
No effect on stool<br />
weight<br />
NSP, non-starch polysaccharide.<br />
a Defined as in Table 2.<br />
and modified starches, NSP<br />
Polyols (except erythritol), some starches, NSP,<br />
lactose (in some populations), fructose (if taken in<br />
large amounts)<br />
Glucose, galactose, sucrose, maltose, trehalose,<br />
maltodextrins, oligosaccharides, most starches<br />
Carbohydrate terminology and classification<br />
JH Cummings and AM Stephen<br />
Table 5 Preferred terminology of dietary carbohydrates<br />
Chemical Physiological/botanical<br />
Useful Monosaccharides<br />
Disaccharides<br />
Polyols<br />
Total sugars<br />
Short-chain<br />
carbohydrates<br />
Oligosaccharides<br />
Polysaccharides<br />
Starch<br />
Non-starch<br />
polysaccharides<br />
Total carbohydrate<br />
Less<br />
useful<br />
Sugars<br />
Sugar<br />
Free sugars<br />
Refined sugars<br />
Added sugars<br />
Extrinsic and intrinsic<br />
sugars<br />
a Intrinsic plant cell wall polysaccharides.<br />
Prebiotic<br />
Resistant starch<br />
Dietary fibre a<br />
Glycaemic<br />
Immunomodulatory<br />
Non-digestible oligosaccharides<br />
Soluble and insoluble fibre<br />
Available and unavailable<br />
carbohydrate<br />
Complex carbohydrate<br />
adolescents. (Elia and Cummings, 2007; prebiotics are dealt<br />
with in more detail in the accompanying paper on<br />
Physiology).<br />
Resistant starch<br />
RS is the sum of starch and products of starch digestion (such<br />
as maltose, maltotriose and a-limit dextrins) that are not<br />
absorbed in the small bowel (Englyst et al., 1992; Champ<br />
et al., 2003). All unmodified starch, if solubilized, can be<br />
hydrolysed by pancreatic a-amylase. However, the rate and<br />
extent to which starch is broken down is altered by a number<br />
of physical and chemical properties. This has led to a<br />
classification of RS that is now widely used (Englyst and<br />
Cummings, 1987).<br />
RS can be fractionated into four types:<br />
RS I: physically inaccessible starch mostly present in<br />
whole grains<br />
S11<br />
European Journal of Clinical Nutrition
S12<br />
Carbohydrate terminology and classification<br />
JH Cummings and AM Stephen<br />
Table 6 Some currently proposed definitions/descriptions of dietary fibre<br />
Dietary fibre consists of nondigestible carbohydrates and lignin that are intrinsic and intact in plants<br />
Functional fibre consists of isolated, nondigestible carbohydrates that have beneficial physiological effects in humans<br />
Total fibre is the sum of Dietary fibre and Added fibre (Institute of Medicine, 2001).<br />
‘Dietary fibre means carbohydrate polymers with a degree of polymerization (DP) not lower than 3 which are neither digested nor absorbed in the small<br />
intestine. A degree of polymerization not lower than 3 is intended to exclude mono- and disaccharides. It is not intended to reflect the average DP of a<br />
mixture. Dietary fibre consists of one or more of:<br />
K Edible carbohydrate polymers naturally occurring in the food as consumed;<br />
K carbohydrate polymers, which have been obtained from food raw material by physical, enzymatic or chemical means,<br />
K synthetic carbohydrate polymers.’ http://www.ccfnsdu.de/fileadmin/user_upload/PDF/ReportCCFNSDU2005.pdf<br />
‘Dietary fibre should be defined to include all non-digestible carbohydrates (NDC). Lignin and other non-digestible but quantitatively minor components<br />
that are associated with the dietary fibre polysaccharides and may influence their physiological properties should be included as well’ European Food<br />
Standards Agency Draft Paper on Carbohydrates and Dietary Fibre (Becker and Asp, 2006).<br />
‘Dietary fibres are the endogenous components of plant material in the diet which are resistant to digestion by enzymes produced by humans. They are<br />
predominantly non-starch polysaccharides and lignin and may include, in addition, associated substances’ (Health and Welfare Canada, 1985).<br />
‘Dietary fibre is the edible parts of plants or analogous carbohydrates that are resistant to digestion and absorption in the human small intestine with<br />
complete or partial fermentation in the large intestine. Dietary fibre includes polysaccharides, oligosaccharides, lignin, and associated plant substances.<br />
Dietary fibres promote beneficial physiological effects including laxation, and/or blood cholesterol attenuation, and/or blood glucose attenuation’<br />
(American Association of Cereal Chemists, 2001).<br />
RS II: RS granules (Type B)<br />
RS III: retrograded starch (after food processing)<br />
RS IV: modified starches.<br />
The observation that the rate and extent of starch<br />
digestion can vary has been one of the most important<br />
developments in our understanding of carbohydrates in the<br />
past 30 years. There are implications of this for the glycaemic<br />
response to foods, for fermentation in the large bowel and<br />
for conditions such as diabetes and obesity. Methods have<br />
been devised to measure these starch fractions in the<br />
laboratory (Champ et al., 2003).<br />
Dietary fibre<br />
The term fibre, or dietary fibre, has many different meanings<br />
in the nutrition world. It is not a precise reference to a<br />
chemical component, or components, of the diet, but is<br />
essentially a physiological concept as embodied in the<br />
original definition by Trowell, ‘the proportion of food which<br />
is derived from the cellular walls of plants which is digested<br />
very poorly in human beings’ (Trowell, 1972).<br />
The dietary fibre hypothesis was one of the most compelling<br />
in nutrition and public health in the latter half of the<br />
twentieth century. It provided the stimulus to a great deal of<br />
research, for example epidemiological, physiological, analytical<br />
and technical. It has been the catalyst for progress in<br />
our understanding of the cause of a number of common<br />
diseases, especially those of the large bowel and has given<br />
governments and the food industry valuable targets for<br />
healthy eating. However, in the 30 years since Trowell,<br />
Walker, Burkitt and others first proposed the fibre hypothesis,<br />
nutritional science has progressed, especially our<br />
understanding of dietary carbohydrates and with this the<br />
apparently unique role of fibre, essentially the plant cell wall,<br />
in many physiological processes and in disease prevention<br />
(Cummings et al., 2004).<br />
European Journal of Clinical Nutrition<br />
Were it not for the perceived public perception that fibre is<br />
good for you, and therefore the need to provide a value for<br />
fibre on food labels, the term would be best consigned to the<br />
history books. However, various national and international<br />
bodies continue to struggle with the definition and the latest<br />
versions of their deliberations on fibre are given in Table 6.<br />
Common to these definitions is the concept of nondigestibility<br />
in the small intestine.<br />
Non-digestibility needs to be defined. If it is carbohydrate<br />
that passes across the ileo-caecal valve, then to define it<br />
requires complex physiological studies in humans. Moreover,<br />
it will vary widely from person to person (Stephen et al.,<br />
1983; Englyst et al., 1992; Silvester et al., 1995; Molis et al.,<br />
1996; Ellegard et al., 1997; Langkilde et al., 2002) and be<br />
affected by the cooking of food, storage, chewing, ripeness<br />
and the presence of other foods (Englyst and Cummings,<br />
1986; Champ et al., 2003). It will include many dietary<br />
components, for example lactose in some populations, some<br />
polyols, some starches (RS) and NSP. There is no enforceable<br />
method that can be used to measure this physiological<br />
fraction of the diet.<br />
As can be seen in the accompanying paper on the<br />
physiology of carbohydrates (Elia and Cummings, 2007),<br />
digestibility has an entirely different context when it is used<br />
in the description of energy metabolism. Here it is defined as<br />
‘the proportion of combustible energy that is absorbed over<br />
the entire length of the gastrointestinal tract’. It would be<br />
useful to have these different concepts of digestion aligned.<br />
If there is a desire to use the word ‘fibre’, then it should<br />
always be ‘qualified by a statement itemizing those carbohydrates<br />
and other substances intended for inclusion’, by<br />
which is meant carbohydrates identified in the chemical<br />
classification table (Table 1).<br />
At a meeting of the authors of the scientific update papers,<br />
and other experts, convened by WHO/FAO and held in<br />
Geneva on 17–18 July 2006, the definition of dietary fibre<br />
was discussed, including the one suggested by the US
National Academy of Sciences in 2001 and that currently<br />
proposed by Codex (http://www.ccnfsdu.de/fileadmin/user_<br />
upload/PDF/ReportCCNFSDU2005.pdf) (Table 6).<br />
The experts agreed that the definition of dietary fibre<br />
should be more clearly linked to health and, after discussion,<br />
the following definition was proposed.<br />
‘Dietary fibre consists of intrinsic plant cell wall polysaccharides’.<br />
The established epidemiological support for the health<br />
benefits of dietary fibre is based on diets that contain fruits,<br />
vegetables and whole-grain foods, for which the intrinsic<br />
plant cell wall polysaccharides are a good marker. Although<br />
isolated or extracted fibre preparations have been shown to<br />
have physiological effects experimentally, these cannot be<br />
translated into health benefits directly because the epidemiological<br />
evidence points to fruits, vegetables and wholegrain<br />
foods as beneficial, and in a normal diet, these<br />
polysaccharides are part of the plant cell wall complex and<br />
do not exist individually.<br />
Soluble and insoluble dietary fibre<br />
These terms arose out of the early chemistry of NSPs, which<br />
showed that the fractional extraction of NSP could be<br />
controlled by changing the pH of solutions. They proved<br />
very useful in the initial understanding of the properties of<br />
dietary fibre, allowing a simple division into those which<br />
principally had effects on glucose and lipid absorption from<br />
the small intestine (soluble) and those which were slowly<br />
and incompletely fermented and had more pronounced<br />
effects on bowel habit (insoluble). However, the separation of<br />
soluble and insoluble fractions is very pH dependent, making<br />
the link with specific physiological properties less certain.<br />
Much insoluble fibre is completely fermented and not all<br />
soluble fibre has effects on glucose and lipid absorption. Many<br />
of the early studies were done with isolated gums or extracts<br />
of cell walls, whereas these various forms of fibre exist<br />
together mostly in intact cell walls of plants.<br />
Nevertheless, certain fibre-rich foods effect glycaemic<br />
control and lipid levels and have been widely used in the<br />
management of diabetes particularly the legumes and pulses<br />
rather than high bran products (Kiehm et al., 1976; Simpson<br />
et al., 1979, 1981; Rivellese et al., 1980; Mann, 1984;<br />
Chandalia et al., 2000; Giacco et al., 2000; Mann et al.,<br />
2004). Work on the variability in glycaemic response of<br />
different types of foods has led to the concept of the<br />
glycaemic index (Crapo et al., 1977; Jenkins et al., 1981) and<br />
a new area of nutritional science has been developed,<br />
concerned with glycaemic responses to carbohydratecontaining<br />
foods (Foster-Powell et al., 2002).<br />
Available and unavailable carbohydrate<br />
A major step forward conceptually in our understanding of<br />
carbohydrates was made by McCance and Lawrence (1929)<br />
Carbohydrate terminology and classification<br />
JH Cummings and AM Stephen<br />
with the division of dietary carbohydrate into available and<br />
unavailable. In an attempt to prepare food tables for diabetic<br />
diets, they realized that not all carbohydrates could be<br />
‘utilized and metabolized’, that is provide the body with<br />
‘carbohydrates for metabolism’. Available carbohydrate was<br />
defined as ‘starch and soluble sugars’ and unavailable as<br />
‘mainly hemicellulose and fibre (cellulose)’. This concept<br />
proved useful, not the least because it drew attention to the<br />
fact that some carbohydrate is not digested and absorbed in<br />
the small intestine but rather reaches the large bowel where<br />
it is fermented or even excreted in faeces.<br />
An FAO technical workshop in Rome in 2002 on ‘Food<br />
energy—methods of analysis and conversion factors’ (FAO,<br />
2003) defined available carbohydrate as ‘that fraction of<br />
carbohydrate that can be digested by human enzymes, is<br />
absorbed and enters into intermediary metabolism’. (It does<br />
not include dietary fibre, which can be a source of energy<br />
only after fermentation).<br />
It is somewhat misleading to talk of carbohydrate as<br />
‘unavailable’ because carbohydrate that reaches the colon is<br />
able to provide the body with energy through fermentation<br />
and absorption of short-chain fatty acids. There are many<br />
properties of carbohydrate of which site of digestion is only<br />
one. An alternative to the terms ‘available’ and ‘unavailable’<br />
today would be to describe carbohydrates either as glycaemic<br />
(that is providing carbohydrate for metabolism) or nonglycaemic,<br />
which is closer to the original concept of<br />
McCance and Lawrence. However, the FAO Technical workshop<br />
on Food Energy in its recommendations said, ‘Available<br />
carbohydrate is a useful concept in energy evaluation and<br />
should be retained. This recommendation is at odds with the<br />
view of the expert consultation in 1997 on carbohydrates,<br />
which endorsed the use of the term ‘glycaemic carbohydrate’<br />
to mean ‘providing carbohydrate for metabolism’. The group<br />
expressed concerns that ‘glycaemic carbohydrate’ might be<br />
confused or even equated with the concept of ‘glycaemic<br />
index’, which is an index that describes the relative blood<br />
glucose response to different ‘available carbohydrates’. The<br />
term ‘available’ seems to convey adequately the concept of<br />
‘providing carbohydrate for metabolism’, while avoiding this<br />
confusion’. Furthermore, in the discussion of the energy<br />
value of carbohydrate, the terms ‘available’ and ‘unavailable’<br />
are extensively used (Elia and Cummings, 2007). On balance,<br />
however, we would recommend ‘glycaemic’ as a more precise<br />
and measurable fraction.<br />
Glycaemic carbohydrate<br />
A more recently developed distinction with regard to human<br />
health, although arising out of the original McCance and<br />
Lawrence concept, is whether or not the carbohydrate source<br />
does or does not directly provide carbohydrate as an<br />
energy source following the process of digestion and<br />
absorption in the small intestine. Carbohydrate, which<br />
provides glucose for metabolism is referred to as ‘glycaemic<br />
S13<br />
European Journal of Clinical Nutrition
S14<br />
carbohydrate’, whereas carbohydrates that pass to the<br />
large intestine prior to being metabolized, is referred to<br />
as ‘non-glycaemic carbohydrate’. Most mono- and disaccharides,<br />
some oligosaccharides (maltodextrins) and<br />
rapidly digested starches may be classified as glycaemic<br />
carbohydrate. Slowly digested starches are also considered<br />
to be glycaemic carbohydrate though glucose is less<br />
rapidly generated. The remaining oligosaccharides, NSPs<br />
and RS are considered to be non-glycaemic carbohydrates.<br />
Most carbohydrate-containing unprocessed foods contain<br />
both glycaemic and non-glycaemic carbohydrate. The extent<br />
to which carbohydrate in foods raises blood glucose<br />
concentration compared with an equivalent amount of<br />
reference carbohydrate has also been used as a means of<br />
classifying dietary carbohydrate and is known as the<br />
glycaemic index (Venn and Green, 2007). Many factors<br />
affect the glycaemic response to carbohydrate, including the<br />
intrinsic properties of the food and also extrinsic factors such<br />
as the composition of the meal, the overall diet and<br />
biological variations of the host.<br />
Complex carbohydrates<br />
This term was first used in the McGovern report, ‘Dietary<br />
Goals for the United States’ in 1977 (Select Committee on<br />
Nutrition and Human Needs, 1977). It was coined largely to<br />
distinguish sugars from other carbohydrates and in the<br />
report denotes ‘fruit, vegetables and whole-grains’. The term<br />
has never been formally defined and has since come to be<br />
used to describe either starch alone, or the combination of all<br />
polysaccharides (British Nutrition Foundation, 1990). It was<br />
used to encourage consumption of what are considered to be<br />
healthy foods such as whole-grain cereals, etc., but becomes<br />
meaningless when used to describe fruits and vegetables,<br />
which are low in starch. As a substitute term for starch it<br />
would seem to have little merit and, in principle, it is better<br />
to discuss carbohydrate components by using their common<br />
chemical names.<br />
Physical effects of carbohydrates<br />
Aside from their chemistry, the physiological properties of<br />
carbohydrates are also affected by the physical state of the<br />
food. In this context, there may be a unique role for NSP in<br />
the control of carbohydrate metabolism. The early studies of<br />
viscosity on glucose responses pointed to the physical<br />
properties of NSP as being important (Jenkins et al., 1978).<br />
In a different context, the classic study of Haber et al. (1977)<br />
with apples shows clearly that where carbohydrate, in this<br />
case mainly glucose and fructose, is entrapped intracellularly<br />
in plant foods, its release in the gut is slowed and blood<br />
glucose moderated and insulin responses lowered. A unique<br />
property of NSP, therefore, is that it forms the plant cell wall<br />
and thus a physical structure to foods. Numerous studies<br />
European Journal of Clinical Nutrition<br />
Carbohydrate terminology and classification<br />
JH Cummings and AM Stephen<br />
have now shown that the physical structure of starchy foods<br />
influences the glycaemic response.<br />
The physical structure of a food has, therefore, a role to<br />
play in the regulation of carbohydrate metabolism. The use<br />
of viscous-soluble NSP isolates in this context will probably<br />
be seen as a stepping stone to understanding fibre but not<br />
the ultimate goal. From a nutritional and analytical view<br />
points, the intrinsic polysaccharides of the plant cell wall,<br />
known as dietary fibre or NSP, should be viewed as a single<br />
entity that uniquely provides physical structure to foods.<br />
There is however a major problem in characterizing and<br />
measuring the key physical attributes of a food that<br />
contributes to modifying its effects.<br />
Whole grain<br />
The essence of the dietary recommendations in many<br />
countries is to eat a diet high in whole grains, fruits and<br />
vegetables and this is embodied in the WHO/FAO report on<br />
‘Diet, Nutrition and the Prevention of Chronic Diseases’<br />
(WHO, 2003) in the description of population nutrient<br />
intake goals. However, the term ‘whole grain’ has several<br />
meanings from ‘whole of the grain’ through to physically<br />
intact structures. A precise definition is clearly needed for<br />
labelling purposes.<br />
Whole grain comprises whole wheat, whole-wheat flour,<br />
wheat flakes, bulgar wheat, whole and rolled oats, oatmeal,<br />
oat flakes, brown rice, whole rye and rye flour, whole barley<br />
and popcorn. Cornmeal is not included as it is generally<br />
dehulled, de-branned and de-germed. Sweet corn has been<br />
included in some analyses (Harnack et al., 2003), but is not<br />
included in analyses from the UK, where it is considered a<br />
vegetable (Henderson et al., 2002; Thane et al., 2005, 2007).<br />
Foods containing added bran, but not including endosperm<br />
or germ, are included in some analyses (Jacobs et al., 2001)<br />
but not in others, but are not whole grains and should be<br />
excluded. Similarly, foods which are largely whole grain, but<br />
not entirely, such as puffed wheat, where the puffing and<br />
toasting causes some of the outer layers to drop off are not<br />
truly whole grain. Such foods are difficult to consider, since<br />
they may be consumed by a considerable proportion of the<br />
population and are indicated as whole wheat on the label of<br />
some products but not others.<br />
There are also problems with the definition of a whole<br />
grain food. For labelling purposes, the Food and Drug<br />
Administration (1999) in the United States has defined a<br />
whole grain food as ‘a product containing 451% whole<br />
grain by weight per reference amount customarily consumed<br />
per day’ (Seal, 2006), and this standard has been used in<br />
some surveys to assess intake (Lang et al., 2003; Jensen et al.,<br />
2004). However, many foods contain less whole grain than<br />
this, but can still make a substantial contribution to total<br />
whole-grain intake (Thane et al., 2005, 2007).<br />
In studies by Jacobs et al. (1998) in the United States,<br />
breakfast cereals were ‘considered to be whole grain if the
product contained X25% whole grain or bran y’. In a<br />
more complete analysis of the United Kingdom, foods with<br />
whole-grain contents of 10% or more were used, rather than<br />
the cutoffs of 25 or 51%. In the UK National Diet and<br />
Nutrition Surveys, it was found that for young people aged<br />
4–18 years, intake of whole grains was underestimated by<br />
28% if only those products with 451% whole grains were<br />
included and underestimated by 15% if only those with<br />
whole-grain content greater than 25% were included. More<br />
recently for adults, the 51% cutoff would have underestimated<br />
intake by 18% for the 1986–87 Dietary Survey of<br />
British Adults (Gregory et al., 1990), and 27% in the NDNS<br />
survey of adults in 2000–01 (Henderson et al., 2002),<br />
indicating not only the underestimation but that the<br />
manner of consuming whole grains may also be changing,<br />
with more foods with lower amounts now being consumed.<br />
It is a considerable amount of work to determine whole-grain<br />
content down to the 10% level, but this would include foods<br />
like porridge, which when cooked is 90% water but is<br />
consumed in substantial quantities in parts of the world<br />
(Thane et al., 2007), and which may have important health<br />
benefits.<br />
In his editorial comment on the 1998 Jacobs’ paper,<br />
Willett (1998) remarks ‘The physical form of whole grains<br />
can vary from intact kernels (for which we should probably<br />
reserve the term whole grain) to finely milled flour (whole<br />
grain flour)’. This distinction between intact whole grains or<br />
physically disrupted, although present in the food in its<br />
entirety, is important. Grain structure affects the glycaemic<br />
response to food (Foster-Powell et al., 2002) and high intakes<br />
of whole-grain foods protect against the development of type<br />
II diabetes (Venn and Mann, 2004) and cardiovascular<br />
disease (Seal, 2006), yet we know little about the physical<br />
form of grains in these studies.<br />
It is also worth noting that the type of grain contributing<br />
to whole grains may vary from country to country. For the<br />
UK, about 90% of the whole-grain intake is wheat (Thane<br />
et al., 2005), while in the United States, a larger proportion is<br />
likely to be from oats, given the popularity of whole-grain<br />
oat cereals. With the different physical and physiological<br />
properties of these two grains, such differences need to be<br />
taken into account when interpreting health impacts of<br />
whole-grain consumption.<br />
Conclusions<br />
(1) Dietary carbohydrates should be classified according to<br />
their chemical form, as recommended at the 1997 FAO/<br />
WHO Expert Consultation.<br />
(2) The physiological and health effects of carbohydrates are<br />
dependent not only on their primary chemical form but<br />
also on their physical properties, which include water<br />
solubility, gel formation, crystallization state, association<br />
with other molecules and aggregation into the complex<br />
structures of the plant cell wall.<br />
Carbohydrate terminology and classification<br />
JH Cummings and AM Stephen<br />
(3) Total carbohydrate in food should be determined by<br />
direct measurement rather than ‘by difference’.<br />
(4) Many terms exist to describe sugars in the diet. The most<br />
useful are total sugars and their division into mono- and<br />
disaccharides. The use of other terms creates difficulties<br />
for the analyst, confusion for the consumer and suggests<br />
properties of foods that are not related to sugars<br />
themselves, but to the food matrix.<br />
(5) Because neither chemical nor physical description of<br />
carbohydrates directly reflects their physiological properties<br />
and health benefits, a number of terms to<br />
describe carbohydrates, based on their physiology, have<br />
been created. Of these prebiotic, glycaemic, RS and<br />
dietary fibre are useful.<br />
(6) Dietary fibre should be defined to reflect the health<br />
benefits of a diet rich in fruits, vegetables and whole<br />
grains and not the variable physiological properties or<br />
health effects of the various carbohydrate types. The<br />
definition proposed by the group was ‘intrinsic plant cell<br />
wall polysaccharides’.<br />
(7) The effects of foods containing different types of fibre on<br />
glycaemic control and lipid levels should be investigated<br />
further to determine the exact properties needed for<br />
their effects. The distinction between soluble and<br />
insoluble forms of fibre is inappropriate since the<br />
separation is pH dependent and does not reflect the<br />
physiological properties of whole foods in the gut.<br />
(8) The term whole grains should be defined more clearly<br />
and the role of intact versus milled grains established.<br />
The whole-grain concept, along with fresh fruits and<br />
vegetables is central to a healthy diet message.<br />
Acknowledgements<br />
The authors thank Professor Ingvar Bosaeus, Dr Barbara<br />
Burlingame, Professor Jim Mann, Professor Timothy Key,<br />
Professor Carolyn Summerbell, Dr Bernard Venn and Dr<br />
Martin Wiseman for the valuable comments they provided<br />
on the earlier manuscript.<br />
Conflict of interest<br />
During the preparation and peer review of this paper in 2006,<br />
the authors and peer reviewers declared the following<br />
interests.<br />
Authors<br />
Professor John H Cummings: Chairman, Biotherapeutics<br />
Committee, Danone; Member, Working Group on Foods<br />
with Health Benefits, Danone; funding for research work at<br />
the University of Dundee, ORAFTI (2004).<br />
Dr Alison M Stephen: Contract with World Sugar Research<br />
Organization on trends in intakes of sugars and sources in<br />
the diet (contract is with MRC-Human Nutrition Resource);<br />
contracts with Cereal Partners UK on whole-grain intakes in<br />
the UK and relationship to adiposity (contract was with<br />
S15<br />
European Journal of Clinical Nutrition
S16<br />
MRC-Human Nutrition Resource); Adviser to Audrey Eyton<br />
on scientific content on book ‘F2 Diet’; Scientific Advisory<br />
Panel of Canadian Sugar Institute (not for profit but funded<br />
by sugar industry) (1995–2002).<br />
Peer-reviewers<br />
Professor Ingvar Bosaeus: none declared.<br />
Dr Barbara Burlingame: none declared.<br />
Professor Jim Mann: none declared.<br />
Professor Timothy Key: none declared.<br />
Professor Carolyn Summerbell: none declared.<br />
Dr Bernard Venn: none declared.<br />
Dr Martin Wiseman: none declared.<br />
References<br />
Carbohydrate terminology and classification<br />
JH Cummings and AM Stephen<br />
American Association of Cereal Chemists (2001). The definition of<br />
dietary fibre. Cereal Foods World 46, 112–126.<br />
Asp N-G (1995). Classification and methodology of food carbohydrates<br />
as related to nutritional effects. Am J Clin Nutr 61 (Suppl 4),<br />
S980–S987.<br />
Atwater WO, Woods CD (1986). The Chemical Composition of<br />
American Food Materials. Experiment Station Bulletin no. 28. US<br />
Official Experiment Stations: Washington, DC.<br />
Becker W, Asp N-G (2006). Carbohydrates and dietary fibre.<br />
British Nutrition Foundation (1990). Complex Carbohydrates in Foods:<br />
Report of the British Nutrition Foundation’s Task Force. Chapman and<br />
Hall: London.<br />
Champ M, Langkilde AM, Brouns F, Kettlitz B, Le Bail-Collet Y<br />
(2003). Advances in dietary fibre characterization. 2. Consumption,<br />
chemistry, physiology and measurement of resistant starch;<br />
implications for health and food labelling. Nutr Res Rev 16,<br />
143–161.<br />
Chandalia M, Garg A, Lutjohann D, von Bergmann K, Grundy SM,<br />
Brinkley LJ (2000). Beneficial effects of high dietary fiber intake in<br />
patients with type 2 diabetes mellitus. N Engl J Med 342, 1392–<br />
1398.<br />
Crapo PA, Reaven G, Olefsky J (1977). Postprandial plasma-glucose<br />
and insulin responses to different complex carbohydrates. Diabetes<br />
26, 1178–1183.<br />
Cummings JH, Englyst HN (1995). Gastrointestinal effects of food<br />
carbohydrate. Am J Clin Nutr 61, 938S–945S.<br />
Cummings JH, Edmond LM, Magee EA (2004). Dietary carbohydrates<br />
and health: do we still need the fibre concept? Clin Nutr Suppl 1,<br />
5–17.<br />
Cummings JH, Macfarlane GT, Englyst HN (2001). Prebiotic digestion<br />
and fermentation. Am J Clin Nutr 73, 415S–420S.<br />
Cummings JH, Roberfroid MB, Andersson H, Barth C, Ferro-Luzzi A,<br />
Ghoos Y et al. (1997). A new look at dietary carbohydrate:<br />
chemistry, physiology and health. Eur J Clin Nutr 51, 417–423.<br />
Department of Health (1989). Dietary Sugars and Human Disease. Her<br />
Majesty’s Stationery Office: London.<br />
Elia M, Cummings JH (2007). Physiological aspects of energy<br />
metabolism and gastrointestinal effects of carbohydrates. Eur J<br />
Clin Nutr 61 (Suppl 1), S40–S74.<br />
Ellegard L, Andersson H, Bosaeus I (1997). Inulin and oligofructose<br />
do not influence the absorption of cholesterol, or the excretion of<br />
cholesterol, Ca, Mg, Zn, Fe, or bile acids but increases energy<br />
excretion in ilesotomy subjects. Eur J Clin Nutr 51, 1–5.<br />
Englyst HN, Cummings JH (1986). Digestion of the polysaccharides<br />
of banana (Musa paradisiaca sapientum) in man. Am J Clin Nutr 44,<br />
42–50.<br />
Englyst HN, Cummings JH (1987). Resistant starch, a ‘new’ food<br />
component: a classification of starch for nutritional purposes. In:<br />
European Journal of Clinical Nutrition<br />
Morton ID (ed). Cereals in a European Context. Ellis Horwood:<br />
Chichester. pp 221–233.<br />
Englyst HN, Kingman SM, Cummings JH (1992). Classification and<br />
measurement of nutritionally important starch fractions. Eur J Clin<br />
Nutr 46, S33–S50.<br />
Englyst HN, Quigley ME, Hudson GJ (1994). Determination of<br />
dietary fibre as non-starch polysaccharides with gas–liquid<br />
chromatographic, high-performance liquid chromatographic or<br />
spectrophotometric measurement of constituent sugars. Analyst<br />
119, 1497–1509.<br />
Englyst K, Liu S, Englyst H (2007). Nutritional characterisation and<br />
measurement of dietary carbohydrates. Eur J Clin Nutr 61 (Suppl 1),<br />
S19–S39.<br />
European Communities (1990). Council directive 90/496/EEC on<br />
nutrition labelling for foodstuffs.<br />
European Communities (2000). Council directive 2000/13/EC on the<br />
approximation of the laws of the member states relating to the<br />
labelling, presentation and advertising of foodstuffs.<br />
FAO (1998). Carbohydrates in human nutrition. Food and Agriculture<br />
Organization of the United Nations: Rome. Report of a Joint FAO/<br />
WHO Expert Consultation. FAO Food and Nutrition Paper no. 66.<br />
FAO (2003). Food Energy—Methods of Analysis and Conversion Factors.<br />
Food and Agriculture Organization of the United Nations: Rome.<br />
Report of a Technical Workshop. FAO Food and Nutrition Paper<br />
no. 77.<br />
Food and Drug Administration (1993). Food labelling: mandatory<br />
status of nutrition labelling and nutrient content revision, format<br />
for nutrition label. Fed Regist 58, 2079–2228.<br />
Food and Drug Administration (1999). Health claim notification for<br />
whole grain foods. http://www.cfsan.fda.gov/Bdms/flgrains.html.<br />
Food Standards Agency/Institute of Food Research (2002). The<br />
Composition of Foods Sixth Summary Edition. Royal Society of<br />
Chemistry: Cambridge.<br />
Foster-Powell K, Holt SHA, Brand-Miller JC (2002). International<br />
table of glycemic index and glycemic load values: 2002. Am J Clin<br />
Nutr 76, 5–56.<br />
Galliard TE (1987). Starch: Properties and Potential. John Wiley & Sons:<br />
Chichester.<br />
Giacco R, Parillo M, Rivellese AA, Lasorella G, Giacco A, D’Episcopo L<br />
et al. (2000). Long-term dietary treatment with increased amounts<br />
at fiber-rich low-glycemic index natural foods improves blood<br />
glucose control and reduces the number of hypoglycemic events<br />
in type 1 diabetic patients. Diabetes Care 23, 1461–1466.<br />
Gibson GR, Roberfroid M (1995). Dietary modulation of the human<br />
colonic microbiota: introducing the concept of prebiotics. J Nutr<br />
125, 1401–1412.<br />
Gibson GR, Probert HM, Van Loo J, Rastall RA, Roberfroid M (2004).<br />
Dietary modulation of the human colonic microbiotia: updating<br />
the concept of prebiotics. Nutr Res Rev 17, 259–275.<br />
Gibson SA (2000). Breakfast cereal consumption in young children:<br />
associations with non-milk extrinsic sugars and caries experience:<br />
further analysis of data from the UK national diet and nutrition<br />
survey of children aged 1.5–4.5 years. Public Health Nutr 3,227–232.<br />
Gregory J, Foster K, Tyler H, Wiseman M (1990). Dietary and<br />
Nutritional Survey of British Adults. Her Majesty’s Stationery Office:<br />
London.<br />
Haber GB, Heaton KW, Murphy D, Burroughs LF (1977). Depletion<br />
and disruption of dietary fibre: effects on satiety, plasma-glucose<br />
and serum insulin. Lancet ii, 679–682.<br />
Harnack L, Walters SA, Jacobs Jr DR (2003). Dietary intake and food<br />
sources of whole grains among US children and adolescents: data<br />
from the 1994–1996 continuing survey of food intakes by<br />
individuals. J Am Diet Assoc 103, 1015–1019.<br />
Health Canada (2005). Canadian nutrient file. http://www.hc-sc.<br />
gc.ca/fn-an/nutrition/fiche-nutri-data/index_e.html.<br />
Health and Welfare Canada (1985). Report of the Expert Advisory<br />
Committee a Dietary Fibre.
Henderson L, Gregory J, Swan G (2002). The National Diet & Nutrition<br />
Survey: Adults Aged 19 to 64 Years. Vol. 1: Types and Quantities of<br />
Food Consumed. Her Majesty’s Stationery Office: London.<br />
Hidaka H, Eida T, Takizawa T, Tokunaga T, Tashiro Y (1986). Effects of<br />
fructooligosaccharides on intestinal flora and human health.<br />
Bifidobacteria Microflora 5, 37–50.<br />
Holland B, Unwin ID, Buss DH (1992). Fruit and Nuts. First Supplement<br />
to 5th Edition of McCance and Widdowson’s the Composition of Foods.<br />
Her Majesty’s Stationery Office: London.<br />
Holland B, Unwin ID, Buss DH (eds) (1988). Cereals and Cereal<br />
Products. Royal Society of Chemistry: Cambridge.<br />
Holland B, Unwin ID, Buss DH (eds) (1991a). Vegetables, Herbs and<br />
Spices. Royal Society of Chemistry: Cambridge.<br />
Holland B, Welch AA, Unwin ID, Buss DH, Paul AA, Southgate DAT<br />
(1991b). McCance & Widdowson’s the Composition of Foods. Her<br />
Majesty’s Stationery Office: London.<br />
Hoover R, Sosulski FW (1991). Composition, structure, functionality,<br />
and chemical modification of legume starches: a review. Can J<br />
Physiol Pharmacol 69, 79–92.<br />
http://www.britannica.com/eb/article-9057022/oligosaccharide.<br />
http://www.ccnfsdu.de/fileadmin/user_upload/PDF/ReportCCNFSDU<br />
2005.pdf.<br />
Institute of Medicine (2001). Dietary Reference Intakes for Energy,<br />
Carbohydrate, Fiber, Fat, Fatty Acids, Cholesterol, Protein and Amino<br />
Acids. National Academy Press: Washington, DC.<br />
IUB–IUPAC Joint Commission on Biochemical Nomenclature (1982).<br />
Abbreviated terminology of oligosaccharide chains. J Biol Chem<br />
257, 3347–3351.<br />
IUPAC–IUB Joint Commission on Biochemical Nomenclature (1996).<br />
Nomenclature of carbohydrates. www.chem.qmul.ac.uk/iupac/<br />
2carb/.<br />
Jacobs Jr DR, Meyer HE, Solvoll K (2001). Reduced mortality among<br />
whole grain bread eaters in men and women in the Norwegian<br />
county study. Eur J Clin Nutr 55, 137–143.<br />
Jacobs Jr DR, Meyer KA, Kushi LH, Folsom AR (1998). Whole-grain<br />
intake may reduce the risk of ischemic heart disease death in<br />
postmenopausal women: the Iowa women’s health study. Am J<br />
Clin Nutr 68, 248–257.<br />
James WPT, Theander O (eds) (1981). The Analysis of Dietary Fibre in<br />
Food. Marcel Dekker: New York. p 259.<br />
Jenkins DJ, Wolever TM, Leeds AR, Gassull MA, Haisman P, Dilawari J<br />
et al. (1978). Dietary fibres, fibre analogs, and glucose-toleranceimportance<br />
of viscosity. Br Med J 1, 1392–1394.<br />
Jenkins DJ, Wolever TM, Taylor RH, Barker H, Fielden H, Baldwin JM<br />
et al. (1981). Glycemic index of foods: a physiological basis for<br />
carbohydrate exchange. Am J Clin Nutr 34, 362–366.<br />
Jensen MK, Koh-Banerjee P, Hu FB, Franz M, Sampson L, Gr+nbæk M<br />
et al. (2004). Intakes of whole grains, bran, and germ and the risk of<br />
coronary heart disease in men. Am J Clin Nutr 80, 1492–1499.<br />
Kelly SA, Summerbell C, Rugg-Gunn AJ, Adamson A, Fletcher E,<br />
Moynihan PJ (2005). Comparison of methods to estimate nonmilk<br />
extrinsic sugars and their application to sugars in the diet of<br />
young adolescents. Br J Nutr 94, 114–124.<br />
Kennedy G, Burlingame B (2003). Analysis of food composition data<br />
on rice from a plant genetic resources perspective. Food Chem 80,<br />
589–596.<br />
Kiehm TG, Anderson JW, Ward K (1976). Beneficial effects of a high<br />
carbohydrate, high fiber diet on hyperglycemic diabetic men. Am J<br />
Clin Nutr 29, 895–899.<br />
Kunz C, Rudloff S, Baier W, Klein N, Strobel S (2000). Oligosaccharides<br />
in human milk: structural, functional, and metabolic aspects.<br />
Annu Rev Nutr 20, 699–722.<br />
Lang R, Thane CW, Bolton-Smith C, Jebb SA (2003). Consumption of<br />
whole-grain foods by British adults: findings from further analysis<br />
of two national dietary surveys. Public Health Nutr 6, 479–484.<br />
Langkilde AM, Champ M, Anderson H (2002). Effects of highresistant-starch<br />
banana flour (RS2) on in vitro fermentation and<br />
the small-bowel excretion of energy, nutrients, and sterols: an<br />
ileostomy study. Am J Clin Nutr 75, 104–111.<br />
Carbohydrate terminology and classification<br />
JH Cummings and AM Stephen<br />
Livesey G (2003). Health potential of polyols as sugar replacers, with<br />
emphasis on low glycaemic properties. Nutr Res Rev 16, 163–191.<br />
Macfarlane S, Macfarlane GT, Cummings JH (2006). Prebiotics in the<br />
gastrointestinal tract. Aliment Pharmacol Ther 24, 701–714.<br />
Mann J (1984). Lines to legumes: changing concepts of diabetic diets.<br />
Diabet Med 1, 191–198.<br />
Mann J, De Leeuw I, Hermansen K, Karamanos B, Karlström B,<br />
Katsilambros N et al. (2004). Evidence-based nutritional approaches<br />
to the treatment and prevention of diabetes mellitus.<br />
Nutr Metab Cardiovasc Dis 14, 373–394.<br />
McCance RA, Lawrence RD (1929). The Carbohydrate Content of Foods.<br />
Her Majesty’s Stationery Office: London.<br />
Molis C, Flourie B, Ouarne F, Gailing MF, Lartigue S, Guibert A et al.<br />
(1996). Digestion, excretion and energy value of fructooligosaccharides<br />
in healthy humans. Am J Clin Nutr 64, 324–328.<br />
National Academy of Sciences (2001). Dietary References Intakes.<br />
Proposed Definition of Dietary Fiber. National Academy of Sciences:<br />
Washington DC.<br />
New Zealand Nutrition Foundation (2004). Sugar and our diet.<br />
http://www.chelsea.co.nz/shared/documents/report.pdf.<br />
Oku T, Tokunaga T, Hosoya N (1984). Non-digestibility of a new<br />
sweetener ‘Neosugar’ in the rat. J Nutr 114, 1574–1581.<br />
Pehrsson PR, Cutrufelli RL, Gebhardt SE, Lemar LE, Holcomb GT,<br />
Haytowitz DB et al. (2005). USDA database for the added sugars<br />
content of selected foods. www.ars.usda.gov/nutrientdata.<br />
Prosky L, Asp N-G, Schweizer TF, De Vries JW, Furda I (1992).<br />
Determination of insoluble and soluble dietary fiber in foods and<br />
food products: collaborative study. J AOAC Int 75, 360–367.<br />
Regina A, Bird A, Topping D, Bowden S, Freeman J, Barsby T et al.<br />
(2006). High-amylose wheat generated by RNA interference<br />
improves indices of large-bowel health in rats. Proc Natl Acad Sci<br />
USA 103, 3546–3551.<br />
Rivellese A, Riccardi G, Giacco A, Pacioni D, Genovese S, Mattioli PL<br />
et al. (1980). Effect of dietary fibre on glucose control and serumlipoproteins<br />
in diabetic-patients. Lancet 2, 447–450.<br />
Roberfroid M (2005). Inulin-type Fructans. Functional Food Ingredients.<br />
CRC Press: Boca Raton.<br />
Roberfroid M, Gibson GR, Delzenne N (1993). The biochemistry of<br />
oligofructose, a non-digestible fiber: an approach to calculate its<br />
caloric value. Nutr Rev 51, 137–146.<br />
Saltmarsh ME (2000). Essential Guide to Food Additives. Leatherhead<br />
Publishing: Leatherhead.<br />
Seal CJ (2006). Whole grains and CVD risk. Proc Nutr Soc 65, 24–34.<br />
Select Committee on Nutrition and Human Needs (1977). Dietary<br />
Goals for the United States. US Government Printing Office:<br />
Washington, DC.<br />
Silvester KR, Englyst HN, Cummings JH (1995). Ileal recovery of<br />
starch from whole diets containing resistant starch measured<br />
in vitro and fermentation of ileal effluent. Am J Clin Nutr 62,<br />
403–411.<br />
Simpson HC, Simpson RW, Lousley S, Carter RD, Geekie M,<br />
Hockaday TD et al. (1981). A high-carbohydrate leguminous fiber<br />
diet improves all aspects of diabetic control. Lancet 1, 1–5.<br />
Simpson RW, Mann JI, Eaton J, Carter RD, Hockaday TD (1979).<br />
High-carbohydrate diets and insulin dependent diabetics. Br Med J<br />
2, 523–525.<br />
Southgate DAT (1978). Free sugars in foods. J Hum Nutr 32, 335–347.<br />
Southgate DAT (1991). Determination of Food Carbohydrates. Elsevier<br />
Science Publishers Ltd: Barking.<br />
Southgate DAT (1995). Digestion and metabolism of sugars. Am J Clin<br />
Nutr 62 (Suppl 1), S203–S211.<br />
Stephen AM (2006). Impact of Carbohydrate Methodology on<br />
Dietary Intake. Copenhagen, April 2006.<br />
Stephen AM, Thane CT, Bramweh CF (2007). Sugars in the diet:<br />
definitions, intakes and sources—an update. (in preparation).<br />
Stephen AM, Haddad AC, Phillips SF (1983). Passage of carbohydrate<br />
into the colon. Direct measurements in humans. Gastroenterology<br />
85, 589–595.<br />
S17<br />
European Journal of Clinical Nutrition
S18<br />
Carbohydrate terminology and classification<br />
JH Cummings and AM Stephen<br />
Thane CT, Jones AR, Stephen AM, Seal CJ, Jebb SA (2005). Wholegrain<br />
intake of British young people aged 4–18 years. Br J Nutr 94,<br />
825–831.<br />
Thane CW, Jones AR, Stephen AM, Seal CJ, Jebb SA (2007).<br />
Comparative whole-grain intake of British adults in 1986–7 and<br />
2000–1. Br J Nutr 97, 987–992.<br />
The Nordic Council (2004). Nordic Nutrition Recommendations<br />
2004, Integrating Nutrition and Physical Activity. The Nordic<br />
Council of Ministers, The Nordic Food Policy Co-Operation.<br />
Copenhagen.<br />
Trowell H (1972). Dietary fibre and coronary heart disease. Eur J Clin<br />
Biol Res 17, 345–349.<br />
United States Department of Agriculture (2007): http://www.ars.usda.<br />
gov/nutrientdata.<br />
van Loo J, Coussement P, de Leenheer L, Hoebregs H, Smits G<br />
(1995). On the presence of inulin and oligofructose as<br />
European Journal of Clinical Nutrition<br />
natural ingredients in the western diet. Crit Rev Food Sci Nutr 35,<br />
525–552.<br />
Venn BJ, Green TJ (2007). Glycemic index and glycemic load:<br />
measurement issues and their effect on diet–disease relationships.<br />
Eur J Clin Nutr 61 (Suppl 1), S122–S131.<br />
Venn BJ, Mann JI (2004). Cereals grains, legumes and diabetes. Eur J<br />
Clin Nutr 58, 1443–1461.<br />
Ward RE, Niñonuevo M, Mills DA, Lebrilla CB, German JB (2006). In<br />
vitro fermentation of breast milk oligosaccharides by Bifidobacterium<br />
infantis and Lactobacillus gasseri. Appl Environ Microbiol 72,<br />
4497–4499.<br />
WHO (2003). Diet, Nutrition and the Prevention of Chronic Diseases.<br />
Report of a Joint WHO/FAO Expert Consultation. WHO Technical<br />
Report Series no. 916. World Health Organization: Geneva.<br />
Willett WC (1998). The dietary pyramid: does the foundation need<br />
repair? Am J Clin Nutr 68, 218–219.
REVIEW<br />
Nutritional characterization and measurement of<br />
dietary carbohydrates<br />
KN Englyst 1 , S Liu 2 and HN Englyst 1<br />
1 2<br />
Englyst Carbohydrates, University of Southampton Science Park, Southampton, UK and Departments of Epidemiology and Medicine,<br />
University of California, Los Angeles, CA, USA<br />
Dietary carbohydrate characterization should reflect relevant nutritional and functional attributes, and be measured as<br />
chemically identified components. A nutritional classification based on these principles is presented, with a main grouping into<br />
‘available carbohydrates’, which are digested and absorbed in the small intestine providing carbohydrates for metabolism, and<br />
‘resistant carbohydrates’, which resist digestion in the small intestine or are poorly absorbed/metabolized. For the available<br />
carbohydrates, the chemical division into the starch and total sugars categories does not adequately reflect the physiological or<br />
nutritional attributes of foods. Characterizing carbohydrate release from starchy foods provides insight into some of the inherent<br />
mechanisms responsible for the varied metabolic effects. Also, a pragmatic approach to product signposting consistent with<br />
guidelines to limit free (or added) sugars is proposed. The most prominent of the resistant carbohydrates are the non-starch<br />
polysaccharides (NSP) from plant cell walls, which are characteristic of the largely unrefined plant foods that provide the<br />
evidence base for the definition and measurement of dietary fibre as ‘intrinsic plant cell-wall polysaccharides’ as proposed in<br />
conjunction with this paper and endorsed by the scientific update. Indigestibility in the small intestine was not considered to be<br />
an adequate basis for the definition of dietary fibre, as there is insufficient evidence to establish public health policy by this<br />
approach and concerns have been raised about potential detrimental effects of high intakes of rapidly fermentable resistant<br />
carbohydrates. Functional ingredients such as resistant starch and resistant oligosaccharides should therefore be researched and<br />
managed separately from dietary fibre, using specific health or function claims where appropriate. This structured approach to<br />
the characterization of nutritionally relevant features of dietary carbohydrates provides the basis for establishing population<br />
reference intakes, nutrition claims and food labelling that will assist the consumer with properly informed dietary choices.<br />
European Journal of Clinical Nutrition (2007) 61 (Suppl 1), S19–S39; doi:10.1038/sj.ejcn.1602937<br />
Keywords: available carbohydrates; resistant carbohydrates; dietary fibre; non-starch polysaccharides; resistant starch; free<br />
sugars; glycaemic index<br />
Introduction<br />
The classification and measurement of dietary carbohydrates<br />
requires a systematic approach that describes both the<br />
chemical and functional properties of carbohydrates in<br />
foods. The objective of this paper is therefore to provide an<br />
in-depth examination of the issues essential to the achievement<br />
of a suitable approach to the nutritional characterization<br />
of dietary carbohydrates. As summarized in Figure 1,<br />
there are a number of reasons why information on the type<br />
and amounts of carbohydrates present in foods is required<br />
including, nutrition labeling, food composition tables,<br />
Correspondence: Dr K Englyst, Englyst Carbohydrates, University of<br />
Southampton Science Park, Southampton, UK.<br />
E-mail: klaus@englyst.co.uk<br />
European Journal of Clinical Nutrition (2007) 61 (Suppl 1), S19–S39<br />
& 2007 Nature Publishing Group All rights reserved 0954-3007/07 $30.00<br />
www.nature.com/ejcn<br />
product development and nutrition research. These applications<br />
all have an impact on public health, which must be<br />
considered the ultimate purpose of providing appropriate<br />
carbohydrate characterizations.<br />
Nutritional considerations for the classification and<br />
measurement of carbohydrates<br />
Foods can contain a range of chemically distinct carbohydrate<br />
substances, which have varied gastrointestinal and<br />
metabolic properties. In addition, biological origin and food<br />
processing have an important role in determining the overall<br />
attributes of the food matrix and the physico-chemical<br />
properties of carbohydrates in foods, which can have a major<br />
impact on their physiological handling (Figure 2). This
S20<br />
Food<br />
Composition<br />
Nutrition Labelling<br />
Food Tables<br />
Nutrition<br />
Research<br />
Metabolic<br />
Epidemiological<br />
Product<br />
Development<br />
Processing<br />
Ingredients<br />
Public Health<br />
Dietary guidelines, Population reference intake values, Nutrition & health claims<br />
Figure 1 Requirements for carbohydrate measurements. A range of<br />
carbohydrate measurements are used in diverse but interrelated<br />
fields within nutrition and food technology. Carbohydrate characterizations<br />
should evolve to describe specific functional attributes<br />
of carbohydrate containing foods as these are identified by nutrition<br />
research. This then informs the development of appropriate<br />
measurements that can be applied in food composition and product<br />
development, which in turn stimulates further research. These<br />
activities contribute to the scientific evidence base on which dietary<br />
guidelines are formulated. Appropriate carbohydrate characterizations<br />
can assist the consumer with informed diet selections and<br />
thereby can make a significant contribution to public health.<br />
Chemical Identity<br />
(Sugar identity, linkage type, size)<br />
Food Matrix<br />
(Biological origin, food processing)<br />
Carbohydrate Food Properties<br />
(Physico-chemical characteristics)<br />
Meal Factorss Subject Factors<br />
Gastrointestinal Handling<br />
(Rate and extent of digestion and absorption)<br />
(Absorbed in small intestine) (Entry to large intestine)<br />
Physiology and Utilisation of<br />
Available Carbohydrates<br />
(Glycaemic index, substrate metabolism)<br />
Physiology and Utilisation of<br />
Resistant Carbohydrates<br />
(Fermentability, prebiotic effect, SCFAs)<br />
Figure 2 Determinants of gastrointestinal fate of dietary carbohydrates.<br />
Largely depending on their physiochemical properties,<br />
different carbohydrate foods can exert a range of physiological<br />
effects, including varied rates of digestion and absorption in the<br />
small intestine and varied fermentability and profile of fermentation<br />
products in the large intestine. Even though there will be a degree<br />
of variation in gastrointestinal handling due to meal and subject<br />
factors, the emphasis from a nutritional perspective must to be on<br />
describing the inherent physico-chemical characteristics of the<br />
foods, reflecting both the chemical identity of carbohydrates and<br />
the influence of the food matrix on functional attributes.<br />
variability in functionality needs to be considered in the<br />
nutritional characterization of dietary carbohydrates, taking<br />
into account issues of both food matrix and chemical<br />
identity (Englyst and Englyst, 2005). Based on current<br />
knowledge of the mechanisms by which dietary carbohydrates<br />
exert their influence on physiology and health, it<br />
is possible to describe these characteristics and incorporate<br />
them into an overall classification scheme (Table 1) that can<br />
evolve as new evidence becomes available. Other papers in<br />
this report have dealt with physiology and health aspects<br />
of dietary carbohydrates in detail. The key nutritional issues<br />
connected with the characterization of carbohydrates are<br />
summarized here.<br />
European Journal of Clinical Nutrition<br />
Nutritional characterization and measurement of dietary carbohydrates<br />
K Englyst et al<br />
Gastrointestinal fate and metabolizable energy<br />
In terms of providing the body with metabolizable substrates,<br />
the digestion of carbohydrates should be considered<br />
as an event of both the upper (absorption of metabolizable<br />
carbohydrate) and lower (fermentation providing shortchain<br />
fatty acids (SCFA)) gastrointestinal tract. Therefore,<br />
for calculation of the contribution to energy, there is a need<br />
to know the gastrointestinal and metabolic fate of carbohydrates<br />
(which is discussed in more depth in the accompanying<br />
physiology paper by Elia and Cummings (2007).<br />
Although a number of essentially synonymous terms have<br />
been used to describe this division, the terms available<br />
carbohydrate and resistant carbohydrate should probably be<br />
considered the most informative and these can be defined as<br />
follows.<br />
Available carbohydrates are those that are absorbed in the<br />
small intestine and provide carbohydrate for metabolism.<br />
This definition is equivalent to the glycaemic carbohydrate<br />
term used in the 1998 Food and Agriculture Organization/<br />
World Health Organization report on carbohydrates, but<br />
which has not been widely used. The ‘available carbohydrate’<br />
term is long established and has been widely<br />
adopted (McCance and Lawrence, 1929; FAO, 2003).<br />
Resistant carbohydrates are those that resist digestion in<br />
the small intestine, or are poorly absorbed and/or metabolized.<br />
This definition is based on a similar one proposed to<br />
distinguish gastrointestinal fate (Rumessen, 1992), but<br />
includes the aspect of poorly metabolized to more effectively<br />
encompass the polyols. In essence, the resistant carbohydrate<br />
definition is equivalent to the indigestible, unavailable<br />
and non-glycaemic terms, but provides a relatively more<br />
accurate description of this grouping of carbohydrates.<br />
Metabolism of different types of sugars<br />
The available carbohydrates are absorbed and metabolized<br />
as the monosaccharides glucose, fructose and galactose,<br />
although lactase deficiency can result in malabsorption of<br />
lactose (Gudmand-Hoyer, 1994). While glucose is utilized by<br />
all tissues, the majority of fructose and galactose metabolism<br />
occurs in the liver, with an estimated 50–70% hepatic<br />
extraction of fructose from the portal vein. Although it is<br />
difficult to draw firm conclusions regarding the nutritional<br />
implications of the metabolic effects of ingesting different<br />
types of sugar, enough concern has been raised, particularly<br />
regarding fructose, to warrant monitoring the intake of<br />
individual sugars (Daly, 2003; Fried and Rao, 2003; Gross<br />
et al., 2004).<br />
Rate of digestion and absorption<br />
The influx of exogenous carbohydrate for metabolism is<br />
determined by the rate that carbohydrates become available<br />
for absorption at the epithelium of the small intestine. This<br />
is influenced by numerous gastrointestinal factors, including<br />
the rate that carbohydrates leave the stomach and the
Table 1 Nutritional characterization of dietary carbohydrates. Modified from Englyst and Englyst 2005<br />
Main categories Chemical<br />
components<br />
Available<br />
carbohydrates<br />
Sugars<br />
Starch<br />
Resistant<br />
carbohydrates NSP<br />
Nutritional grouping Physiology and health<br />
Lactose Malabsorbed by those with lactase deficiency<br />
Fructose (including from sucrose) Largely metabolized by liver. Possible detrimental effect on lipid metabolism<br />
Available glucose from sugars,<br />
maltodextrins and starch. Rate of<br />
release measured as RAG and SAG<br />
diffusion of released sugars from the alimentary food bolus.<br />
The rate that carbohydrates are released from food, through<br />
the disruption of the food matrix and the action of<br />
endogenous amylases on starch, is therefore an important<br />
determinant of carbohydrate entry to the portal vein.<br />
Carbohydrate type, biological origin and food processing<br />
all contribute to the food properties that can influence the<br />
rate of carbohydrate release (Figure 2). The nutritional<br />
significance of the rate of carbohydrate digestion and<br />
absorption is the impact it has on postprandial blood<br />
glucose homeostasis and the associated metabolic and<br />
endocrine responses. Although the glycaemic index (GI)<br />
has been the subject of some controversy, the majority of the<br />
metabolic and epidemiological evidence lends support to an<br />
increase in the consumption of slow-release carbohydrates in<br />
place of their rapidly absorbed high GI counterparts (Jenkins<br />
et al., 2002; Willett et al., 2002; Brand-Miller et al., 2003).<br />
Functional properties of resistant carbohydrates<br />
Nutritionally, the most prominent resistant carbohydrates<br />
are the intrinsic plant cell-wall polysaccharides, which, as<br />
described in later sections, provide the only definition of<br />
dietary fibre consistent with the plant-rich diet. There are<br />
numerous other sources of resistant carbohydrates that occur<br />
naturally in small amounts or that have been developed<br />
as functional ingredients. These include extracted polysaccharides<br />
such as gums, oligosaccharides such as fructans,<br />
polydextrose, resistant maltodextrins and high resistant<br />
starch (RS) ingredients. Depending on their physico-chemical<br />
properties, these heterogeneous resistant carbohydrates have<br />
a range of properties that include viscosity in the upper<br />
RAG and SAG reflect the rate of glucose release from food, which is a main<br />
determinant of the GI. Evidence to suggest that metabolic response<br />
associated with slow-release carbohydrates are most conducive to optimal health<br />
RS Varied rate and extent of fermentation. Insufficient knowledge of effect on health<br />
Dietary fibre (intrinsic plant cell<br />
wall polysaccharides)<br />
Nutritional characterization and measurement of dietary carbohydrates<br />
K Englyst et al<br />
Marker for minimally refined plant foods that are rich in micronutrients and shown<br />
to be beneficial to health<br />
Added NSP Varied rate and extent of fermentation. Some have specific functional properties<br />
RSCC Present naturally and added Varied rate and extent of fermentation. Some have specific functional properties<br />
Sugar alcohols Present naturally and added Partly absorbed and metabolized, and partly fermented<br />
Abbreviations: GI, glycaemic index; NSP, non-starch polysaccharides; RAG, rapidly available glucose; RS, resistant starch; RSCC, resistant short-chain carbohydrates;<br />
SAG, slowly available glucose.<br />
gastrointestinal tract (Ellis et al., 1996), fermentation and<br />
fermentation products (Wong et al., 2006), prebiotic effects<br />
(Roberfroid, 2005; Macfarlane et al., 2006) and mineral<br />
absorption (Abrams et al., 2005). However, as functional<br />
ingredients can be incorporated into foods in high amounts,<br />
there has also been concern about potentially detrimental<br />
effects of large amounts of easily fermentable carbohydrate<br />
reaching the large intestine (Goodlad, 2007). There is<br />
therefore a requirement to research and evaluate how these<br />
substances should be managed from a health promotion<br />
perspective.<br />
Food properties<br />
The nutritional role of dietary carbohydrates cannot be<br />
adequately addressed without consideration of the overall<br />
characteristics of the foods themselves. Therefore, although<br />
fruit, vegetables and whole grains are considered carbohydrate-rich<br />
foods, their health benefits can often be attributed<br />
to their low-energy density and high content of micronutrients<br />
and phytochemicals (Southgate and Englyst, 1985;<br />
Liu et al., 2000a, b, 2001; Liu, 2002; Englyst and Englyst,<br />
2005). These overall nutritional attributes of foods need to be<br />
recognized within dietary guidelines and perhaps, just as<br />
importantly, they ought to be supported by consistent public<br />
health messages relating to dietary carbohydrate consumption.<br />
One approach is to use a prefix identifying the food source<br />
of the carbohydrate, with the most recognized example<br />
being the division between intrinsic and extrinsic (free)<br />
sugars, which describes whether or not they are contained<br />
within cellular structures. At face value, it seems rather<br />
contradictory that consumption of the intrinsic sugars from<br />
S21<br />
European Journal of Clinical Nutrition
S22<br />
fruit and vegetables should be promoted, while the chemically<br />
identical extrinsic sugars are restricted. Of course, it is<br />
not the intrinsic sugars themselves that are being promoted,<br />
but rather the overall health benefits associated with the<br />
fruit and vegetable food group.<br />
Measurement of dietary carbohydrates<br />
Carbohydrate determinations should describe chemical<br />
composition accurately, and provide information of nutritional<br />
relevance, thereby complementing dietary guidelines.<br />
The traditional calculation of carbohydrate ‘by difference’<br />
does not conform to either of these criteria as (i) it combines<br />
the analytical uncertainties of the other macronutrient<br />
measures as well as any unidentified material present and<br />
(ii) a single value for carbohydrate cannot reflect the range of<br />
carbohydrate components or their diverse nutritional properties.<br />
For this reason, carbohydrates should instead be<br />
categorized based on relevant nutritional properties, and<br />
measured as the sum of chemically identified components<br />
(Table 1). The analytical challenge is to apply chemical,<br />
physical and enzymatic approaches to exploit these characteristic<br />
differences to achieve determinations of each<br />
carbohydrate fraction. The measurement principles for the<br />
main carbohydrates are described in Table 2. It is always<br />
preferable to apply rational methods (which specifically<br />
measure the component of interest), rather than empirical<br />
methods (which are defined by the methodology) or<br />
proximate analysis, which are either prone to errors or<br />
limited in their interpretation.<br />
The basic requirements of analytical methodologies for<br />
the determination of dietary carbohydrates as the sum of<br />
their constituent sugars can be described as follows.<br />
Sample preparation. Preparation techniques should ensure<br />
sample homogeneity and facilitate the extraction of the<br />
nutrients of interest. For compositional analysis, this is<br />
typically achieved by freeze-drying and milling the food. The<br />
exception is for measurements of carbohydrates that reflects<br />
their digestibility (for example, RS). Such samples need to be<br />
prepared and analysed ‘as eaten’.<br />
Isolation of specific fractions. The first stage of the analysis is<br />
to ensure that the fraction of interest is completely extracted<br />
from the food matrix in its native form (for example, sugars),<br />
or dispersed to such an extent that it can be hydrolysed and<br />
measured as its component parts (for example, total starch).<br />
Interfering compounds can be accounted for by a sample<br />
blank measurement, although it is preferable to remove<br />
these by enzymatic or physical approaches, especially when<br />
the sample blank is high or the compound of interest is<br />
present in only small amounts.<br />
Hydrolysis to constituent sugars. Once appropriately isolated,<br />
oligosaccharides and polysaccharides may be subjected to<br />
European Journal of Clinical Nutrition<br />
Nutritional characterization and measurement of dietary carbohydrates<br />
K Englyst et al<br />
enzymatic (adds specificity) or acidic (when appropriate<br />
enzyme unavailable) hydrolysis to release their constituent<br />
sugars.<br />
Detection. Separation by gas chromatography or highperformance<br />
liquid chromatography (HPLC) can be used to<br />
measure specific monosaccharaides, disaccharides and small<br />
oligosaccharides. Colorimetric assays can be used to measure<br />
sugars with reducing groups. Enzyme-linked colour reactions<br />
can be used for the determination of individual sugar species<br />
(for example, glucose oxidase-linked assays).<br />
The following sections describe the specific methodological<br />
issues in the measurement of individual fractions of<br />
available carbohydrates and resistant carbohydrates.<br />
Determination of available carbohydrates<br />
Sugars. The common available sugars are glucose, fructose,<br />
galactose, maltose, sucrose and lactose. Aqueous extraction<br />
of these sugars is readily achieved from disrupted food<br />
matrices by a short period of heating and mixing. The<br />
solubility of sugars and the insolubility of proteins and<br />
polysaccharides in 80% ethanol can be used to further isolate<br />
them. When several sugars are present in a sample,<br />
quantification of the individual mono- and di-saccharides<br />
is best achieved by chromatography.<br />
Maltodextrins. The short-chain a-glucan maltodextrins<br />
occur naturally in plants in only small amounts, but can<br />
be manufactured from starch by hydrolysis with acid, heat or<br />
enzymes. Analytically, maltodextrins are usually included<br />
within the total starch value, but a separate value can be<br />
obtained by measuring the glucose released by amyloglucosidase<br />
(EC 3.2.1.3) in the supernatant fraction of an 80%<br />
aqueous ethanol extraction, with a correction for glucose<br />
and maltose content.<br />
Starch and starch digestibility. Starch, the storage polysaccharide<br />
of many plants, consists of a 1–4 linked glucose<br />
monomers and occurs as linear polymers (amylose) or as<br />
macromolecules of shorter chains with a-1–6 branch<br />
linkages (amylopectin). Historically, starch has been determined<br />
by approaches including polarimetry and the formation<br />
of starch–iodine complexes, but their use is generally<br />
considered inappropriate for complex food systems. Therefore,<br />
for quantitative determination, starch should be<br />
hydrolysed and measured as the component glucose<br />
monosaccharide units released, applying a 0.9 hydration<br />
factor to convert them to the polysaccharide on a weight<br />
basis. This is achieved most conveniently with a combination<br />
of amylolytic enzymes (typically amylase (EC 3.2.1.2)<br />
and amyloglucosidase (EC 3.2.1.3)) that hydrolyse the starch<br />
polymer, including the a-1–6 branch linkages, and the final<br />
cleavage of maltose and isomaltose to glucose. Procedures for<br />
the accurate measurement of total starch need to include a
Table 2 Principles of carbohydrate measurement<br />
Carbohydrate Types and dietary occurrence Extraction and isolation Hydrolysis and quantification<br />
Sugars The main dietary sources are<br />
Fruit and vegetables: sucrose, glucose,<br />
fructose<br />
Milk and dairy: lactose, galactose<br />
Added sugars: mainly sucrose, glucose,<br />
fructose<br />
Starch Starch: consists of a-1–4-, a-1–6-linked<br />
glucose, as amylose (short linear chains)<br />
and amylopectin (larger, more branched<br />
molecules). Principle sources are cereal<br />
grain, legumes and tubers.<br />
Maltodextrins: Mainly from hydrolysed<br />
starch.<br />
RS: defined as ‘the starch and starch<br />
degradation products that on average resist<br />
digestion in the small intestine’.<br />
Starchy foods have a range of physicochemical<br />
characteristics, influencing their<br />
rate and extent of digestion.<br />
NSP NSP are a grouping of several types of<br />
polysaccharide that do not have the a 1–4<br />
glucosidic linkage characteristic of starch.<br />
Intrinsic plant cell-wall NSP: this component<br />
is defined as Dietary Fibre as it consistent<br />
reflect the health benefits of plant-rich<br />
diets.<br />
Other NSP: usually added extracts.<br />
RSCC Fructans: Natural inulin (e.g., onions) and<br />
fructooligosaccarides from hydrolysed<br />
inulin or synthesized.<br />
a-Galactosides: Sucrose with galactose<br />
units, raffinose ( þ 1), stachyose ( þ 2),<br />
verbascose ( þ 3).<br />
Other RSCC: Mainly manufactured by<br />
synthesis or by polysaccharide hydrolysis.<br />
Examples are galacto- and xylooligosaccharides,<br />
resistant maltodextrins,<br />
polydextrose.<br />
Polyols (sugar alcohols) Occur naturally in small amounts.<br />
Manufactured and added to foods.<br />
heating step at 1001 C for the gelatinization of starch<br />
granules and treatment with either dimethyl sulphoxide or<br />
sodium/potassium hydroxide for the dispersion of RS<br />
(Englyst et al., 1982, 1992).<br />
It is the physico-chemical characteristics that make the<br />
enzymatic digestion of starch nutritionally interesting, and<br />
more challenging to deal with appropriately from an<br />
analytical perspective. The rate and extent that starch is<br />
hydrolysed is determined by the accessibility of the amylolytic<br />
enzymes, which explains why food processing, sample<br />
Nutritional characterization and measurement of dietary carbohydrates<br />
K Englyst et al<br />
Recovered by aqueous extraction and<br />
can be further isolated from other<br />
macronutrients in an 80% ethanol<br />
fraction.<br />
Total starch including maltodextrins:<br />
Majority dispersed in aqueous<br />
conditions. Some high amylose and<br />
retrograded starch requires chemical<br />
dispersion.<br />
Maltodextrins: Conveniently isolated as<br />
the a-glucans (DP43) soluble in 80%<br />
ethanol.<br />
RS: isolated from samples prepared ‘as<br />
eaten’ with digestible starch removed<br />
by conditions that correlate with in vivo<br />
data.<br />
For all starch fractions glucose from<br />
sugars must be accounted for.<br />
NSP is isolated by the dispersion and<br />
enzymatic hydrolysis of starch, which is<br />
then removed along with sugars by<br />
precipitating the NSP in 80% ethanol.<br />
Fructans: Aqueous extraction. Need to<br />
account for glucose and fructose,<br />
including that from sucrose.<br />
a-Galactosides: Aqueous extraction.<br />
If determined as monosaccharide<br />
components need to account for<br />
glucose, fructose and galactose.<br />
Other RSCC: Aqueous extraction and<br />
isolation from polysaccharides in an<br />
80% ethanol fraction. Sugars, sugar<br />
alcohols, maltodextrins, fructans and<br />
raffinose family must be accounted for.<br />
Polyols are easily extracted in aqueous<br />
conditions.<br />
Monosaccharides and disaccharides can<br />
be determined specifically by<br />
chromatography.<br />
Enzyme linked colorimetric assays can<br />
measure individual monosaccharides.<br />
Starch and its components are<br />
determined as glucose released by<br />
enzymatic hydrolysis applying a<br />
hydration factor of 0.9.<br />
Total starch including maltodextrins:<br />
Measured as the sum of glucose<br />
released following complete dispersion<br />
of starch<br />
Maltodextrins: Measured as glucose<br />
released from the a-glucans (DP43)<br />
soluble in an 80% ethanol.<br />
RS: measured as glucose released from<br />
RS fraction following physical and alkali<br />
dispersion.<br />
Following acid hydrolysis NSP<br />
constituent sugars are determined<br />
individually by chromatography or as a<br />
total by a colorimetric assay.<br />
Dietary fibre: For the majority of<br />
products total NSP provides a measure<br />
of dietary fibre<br />
Other NSP: Should be accounted for<br />
separately from dietary fibre. Identified<br />
by NSP sugar profiles.<br />
Fructans: Hydrolysed by fructanase and<br />
measured as fructose (and glucose)<br />
components.<br />
a-galactosides: Determined specifically<br />
by chromatography or alternatively<br />
hydrolysed enzymatically and measured<br />
as their components.<br />
Other RSCC: Determined as the<br />
monosaccharide components released<br />
by enzymatic or acid hydrolysis. Intact<br />
species can be determined by<br />
chromatography, but is less specific.<br />
Polyols can be determined directly by<br />
chromatography.<br />
Abbreviations: DP, degree of polymerization; NSP, non-starch polysaccharides; RS, resistant starch; RSCC, resistant short-chain carbohydrates.<br />
preparation and analytical methodology can all influence<br />
various aspects of starch determination.<br />
The influence of the physico-chemical characteristics of<br />
foods on starch digestibility can be described by measuring<br />
the rate and extent of glucose released by amylolytic<br />
enzymes under in vitro conditions controlled for pH,<br />
temperature, viscosity and mixing (Englyst et al., 1992).<br />
The terms rapidly available glucose and slowly available<br />
glucose are used to describe rate of release characteristics and<br />
their physiological relevance has been confirmed by the<br />
S23<br />
European Journal of Clinical Nutrition
S24<br />
Table 3 Carbohydrate digestibility fractions for a selection of foods<br />
Food g/100 g as eaten<br />
SAG in %<br />
Fru RAG SAG RS available CHO<br />
Long grain rice (brown) 0.0 17.2 12.5 1.7 42.2<br />
Rice pudding (canned) 2.5 10.9 0.2 0.2 1.7<br />
Spaghetti 0.2 17.4 13.0 1.8 42.4<br />
Wholemeal spaghetti 0.3 18.1 9.4 0.9 33.8<br />
Brown bread 0.3 41.9 1.3 2.3 3.0<br />
Wholemeal bread 0.4 35.5 1.5 1.9 3.9<br />
Rye bread 1.7 27.5 5.1 2.8 15.0<br />
Swiss roll 16.4 41.5 1.0 1.5 1.7<br />
Crispbread-rye 1.6 59.5 5.4 2.5 8.1<br />
Oatcakes 0.7 47.8 8.4 2.6 14.7<br />
Water biscuit crackers 0.9 72.7 5.1 0.2 6.5<br />
Digestive biscuits 4.8 44.2 11.4 1.1 18.9<br />
Shortbread 8.2 31.1 21.9 1.8 35.7<br />
Corn flakes 3.8 81.7 2.5 3.6 2.8<br />
Muesli 17.1 38.6 4.7 1.3 7.8<br />
Shredded wheat 1.2 68.7 2.8 2.4 3.9<br />
Potato salad 1.7 8.0 2.1 1.0 17.8<br />
Boiled potatoes 0.6 13.9 0.4 0.5 2.6<br />
Potato crisps 0.2 50.7 1.8 1.0 3.4<br />
Chick peas 0.5 4.2 11.7 3.5 71.0<br />
Green split peas 0.5 6.9 8.7 3.4 54.2<br />
Red kidney beans 0.8 6.4 8.3 3.4 53.3<br />
Haricot beans 0.4 4.6 7.9 3.6 61.1<br />
Baked beans 5.7 11.9 1.8 1.8 9.5<br />
Sweetcorn 1.5 13.2 4.0 0.6 21.4<br />
demonstration of strong correlations between their content<br />
in foods with glycaemic response and GI values (Englyst<br />
et al., 1999, 2003). Table 3 shows the carbohydrate-release<br />
characteristics for a range of products.<br />
Determination of resistant carbohydrates<br />
Polyols (sugar alcohols). The polyols are hydrogenated<br />
carbohydrates, which include sorbitol, mannitol, xylitol<br />
and maltitol. Typically, there is only a small intake of<br />
naturally occurring polyols, principally in the form of<br />
sorbitol from apples and pears. However, the various types<br />
of polyols can be manufactured and are used as sugar<br />
replacers, which can be present in large amounts in some<br />
products, particularly ‘sugar-free’ confectionery. Different<br />
polyol types can be absorbed and metabolized to varying<br />
extents, although a proportion of most polyols enters the<br />
large intestine as fermentation substrates (Livesey, 2003). As<br />
it is not practical to encompass the varied fate of polyols<br />
within a classification scheme, polyols are usually considered<br />
within the resistant carbohydrate grouping.<br />
The sugar alcohols are easily extracted in aqueous or<br />
ethanol fractions and can be measured directly by HPLC.<br />
They are more stable than sugars in alkali conditions, a<br />
feature that can be utilized to isolate and measure sugar<br />
alcohols specifically by gas chromatography without interference<br />
from sugars (Quigley et al., 1999).<br />
European Journal of Clinical Nutrition<br />
Nutritional characterization and measurement of dietary carbohydrates<br />
K Englyst et al<br />
Resistant short-chain carbohydrates. This fraction encompasses<br />
all fructans, and the resistant carbohydrates that are<br />
soluble in 80% ethanol, other than the sugar alcohols. The<br />
resistant short-chain carbohydrate term was developed in<br />
order not to be constricted by the chemical definition of<br />
oligosaccharides as degree of polymerization (DP) 3–9, as<br />
molecules of considerably higher DP may be included,<br />
depending on branching (Englyst and Hudson, 1996;<br />
Quigley et al., 1999). The terms non-digestible oligosaccharides<br />
and resistant oligosaccharides are synonymous with the<br />
RSCC term and in practice all describe the same substances.<br />
This diverse group of substances are typically consumed in<br />
only small amounts from naturally occurring sources,<br />
principally as fructans present in onions, Jerusalem artichoke,<br />
wheat and chicory, and as the small a-galactosides<br />
(raffinose family) from legumes, with more complex galactooligosacchides<br />
found in breast milk. A range of resistant<br />
oligosaccharides have also been developed as functional<br />
ingredients. There is a need to have a consistent approach to<br />
the determination of all RSCCs, so that their dietary content<br />
and relevance can be identified, and to prevent the potential<br />
for gaps in carbohydrate classification and measurement.<br />
There are several approaches to the determination of RSCC<br />
depending on the chemical characteristics of the individual<br />
species.<br />
It is convenient to measure fructans as their fructose and<br />
glucose constituents after specific hydrolysis with fructanase<br />
(EC 3.2.1.7) (McCleary et al., 2000). The a-galactosides can<br />
either be determined individually by chromatography or by<br />
their monosaccharide constituents after enzymatic hydrolysis<br />
with a-galactosidase (EC 3.2.1.22) and a-glucosidase (EC<br />
3.2.1.20) (Vinjamoori et al., 2004).<br />
Other RSCC can be measured by a single method based<br />
on the acid hydrolysis of RSCC isolated in an 80% ethanol<br />
extract and determination of constituent sugars by gas<br />
chromatography (Quigley et al., 1999). This approach is<br />
suitable for the determination of a wide range of substances,<br />
including, but not restricted to isomalto-oligosaccharides,<br />
xylo-oligosaccharides, galacto-oligosaccharides and resistant<br />
maltodextrins.<br />
There are also methods for the determination of RSCC by<br />
the chromatographic separation of intact species. However,<br />
as discussed later, this type of method can lack specificity<br />
and there is the possibility of overlap between different<br />
methods, which would lead to double counting and an<br />
overestimate of the total RSCC content.<br />
Non-starch polysaccharides. This group of carbohydrates is<br />
defined as the polysaccharides that do not contain the a-1–4linked<br />
glucose that is characteristic of starch. There are<br />
various types of non-starch polysaccharides (NSP) that differ<br />
in their sugar composition and glycosidic linkages, which are<br />
important features in determining their physico-chemical<br />
properties. The NSP present in plant cell walls have a<br />
structural function in defining the integrity of plant cells<br />
and tissues. NSP can also occur as gums and mucilages, some
Table 4 NSP in a selection of foods<br />
of which are extracted and used as food additives for their<br />
technological properties. Biological variation between plant<br />
species means that different food groups have characteristic<br />
profiles of NSP, as identified by their spectrum of constituent<br />
sugars (Table 4). The NSP glucose is present in all food types,<br />
occurring mainly in the form of cellulose, but some cereal<br />
products, such as oats and barley, can contain considerable<br />
amounts of the more soluble b-glucan. Galacturonic acid is<br />
the main component of pectin found in fruit and vegetables.<br />
Xylose is found predominantly as arabinoxylans in cereals.<br />
Arabinose, mannose and galactose are present in all food<br />
types, with rhamnose and fucose being present in only small<br />
amounts in some fruits and vegetables.<br />
As NSP is a chemically defined substance, its occurrence in<br />
foods can be measured directly and specifically. This is<br />
achieved by the extraction and isolation of these polysaccharides<br />
from other carbohydrate components, with their<br />
subsequent hydrolysis to constituent sugars for colorimetric<br />
or chromatographic determination. Some individual NSP<br />
such as b-glucans, can be determined as their constituent<br />
sugars released by hydrolysis with the relevant substratespecific<br />
enzymes.<br />
Currently, the most convenient determination of total NSP<br />
is achieved by hydrolysing the extracted NSP by an acid<br />
treatment with measurement of the released monosaccharides<br />
(Englyst et al., 1982, 1994). Extraction involves the<br />
complete dispersal of starch with dimethylsulphoxide and<br />
aqueous gelatinization, making it susceptible to hydrolysis<br />
Nutritional characterization and measurement of dietary carbohydrates<br />
K Englyst et al<br />
Food NSP g/100 g as eaten NSP constituent sugars<br />
Rha Fuc Ara Xyl Man Gal Glu Uronic<br />
acid<br />
Bran, wheat 37.2 0.0 0.0 8.8 16.8 0.1 0.6 9.8 1.1<br />
Bread, wholemeal 5.2 0.0 0.0 1.5 2.0 0.1 0.2 1.3 0.2<br />
Bread, white 1.6 0.0 0.0 0.5 0.7 0.1 0.1 0.3 0.0<br />
Bread, Rye 7.3 0.0 0.0 1.9 3.2 0.1 0.2 1.9 0.1<br />
Cornflakes 0.9 0.0 0.0 0.1 0.3 0.0 0.0 0.4 0.1<br />
Meal, oats 7.0 0.0 0.0 0.8 1.1 0.0 0.1 4.9 0.2<br />
Spaghetti, White 1.2 0.0 0.0 0.4 0.5 0.0 0.1 0.2 0.0<br />
Spaghetti, Wholewheat 3.5 0.0 0.0 1.0 1.3 0.1 0.1 1.0 0.1<br />
Beans, French 3.1 0.0 0.0 0.2 0.2 0.1 0.4 1.2 0.9<br />
Peas, Cooked 5.2 0.1 0.0 1.1 0.2 0.0 0.1 3.0 0.7<br />
Potato 1.2 0.0 0.0 0.1 0.0 0.0 0.4 0.5 0.2<br />
Cabbage, Winter 3.7 0.2 0.0 0.8 0.2 0.1 0.4 1.2 0.9<br />
Cauliflower, Cooked 1.6 0.1 0.0 0.3 0.1 0.0 0.2 0.6 0.4<br />
Broccoli 3.0 0.1 0.0 0.4 0.2 0.1 0.3 1.1 0.9<br />
Carrots, Cooked 2.5 0.1 0.0 0.3 0.0 0.1 0.4 0.9 0.8<br />
Tomato 1.1 0.0 0.0 0.1 0.1 0.1 0.1 0.5 0.3<br />
Cucumber 0.5 0.0 0.0 0.0 0.0 0.0 0.1 0.2 0.1<br />
Apple, Cox 2.0 0.1 0.0 0.3 0.1 0.1 0.1 0.7 0.6<br />
Peach 1.5 0.0 0.0 0.3 0.1 0.0 0.1 0.5 0.5<br />
Banana 3.3 0.1 0.0 0.4 1.0 0.1 0.2 0.4 1.2<br />
Orange 2.1 0.0 0.0 0.3 0.1 0.1 0.3 0.5 0.9<br />
Melon, Honeydew 0.5 0.0 0.0 0.0 0.0 0.0 0.0 0.3 0.2<br />
Kiwi fruit 1.7 0.0 0.0 0.0 0.2 0.1 0.1 0.7 0.6<br />
Hazelnuts 6.5 0.2 0.0 1.4 0.5 0.0 0.5 2.3 1.6<br />
by a combination of amylolytic enzymes. The NSP is isolated<br />
by precipitation in acidified 80% ethanol, which removes<br />
hydrolysed starch and any sugars present in the sample. If<br />
information on NSP solubility is required, then the insoluble<br />
fraction can be extracted by precipitation in pH 7 phosphate<br />
buffer, which together with a total NSP value can be used to<br />
calculate the soluble fraction. While 2 M sulphuric acid is<br />
sufficient for the hydrolysis of most types of NSP, an initial<br />
12 M sulphuric acid step is needed for the hydrolysis of<br />
cellulose, and indeed omitting this step can be used to<br />
calculate the cellulose content of a sample. Pectin is difficult<br />
to hydrolyse, requiring a subsequent incubation with<br />
pectinase. The sugars released may be measured by gas<br />
liquid chromatography or HPLC to obtain values for<br />
individual monosaccharides. A single value for total sugars<br />
may be obtained by colorimetric determination of reducing<br />
groups (Englyst et al., 1994). Further issues relating to NSP<br />
are considered in the sections on the definition and<br />
measurement of dietary fibre.<br />
Resistant starch. Starch digestion by endogenous enzymes is<br />
a continuous process during passage through the small<br />
intestine, which, for a number of different reasons may not<br />
go to completion. Starch can escape digestion in the small<br />
intestine because it is physically inaccessible, within the food<br />
matrix (RS1), or within starch granules (RS2), or because it is<br />
present as retrograded starch (RS3) produced during food<br />
manufacture and preparation. For many foods, a small<br />
S25<br />
European Journal of Clinical Nutrition
S26<br />
proportion of the starch present will be RS (typically 0–5% of<br />
starch in most cereal products) although for some foods such<br />
as legumes this is higher (typically 10–20% of starch for some<br />
beans), and food processing influences the amount present.<br />
In addition, starch can be chemically modified to a form that<br />
is resistant to enzymatic digestion (sometimes termed RS4),<br />
which includes starch that has been etherized, esterified or<br />
cross-bonded. Various high RS preparations have become<br />
available, through either plant breeding to increase amylose<br />
contents, or by physical and chemical manufacturing<br />
processes that increase the RS fraction of starches. As each<br />
RS preparation has its own specific physico-chemical<br />
characteristics that can influence the rate and site of<br />
fermentation in the colon, it is appropriate that each<br />
preparation should be considered on its own merits, and<br />
the properties associated with one preparation cannot<br />
necessarily be extrapolated to others.<br />
RS is physiologically defined on the basis of in vivo studies.<br />
Quantifying the amount of starch entering the human colon<br />
presents considerable technical problems (Champ et al.,<br />
2003). Hydrogen excreted in breath has been used as an<br />
indicator of fermentation in the colon, but it is considered<br />
to lack the sensitivity required for quantification. Intubation<br />
has been used to sample digesta from the ileum, but this<br />
technique is restricted to liquidized meals. Several studies<br />
have used human ileostomy subjects as a model to<br />
investigate the digestive physiology of the small intestine.<br />
Carbohydrate analysis of the ileostomy effluent allows<br />
determination of the amount of starch escaping digestion<br />
in the small intestine, which was found to vary between<br />
individuals by 720% around the mean (Englyst and<br />
Cummings, 1985, 1986, 1987; Silvester et al., 1995). It is<br />
from these studies that the currently accepted definition of<br />
RS is derived as ‘the sum of starch and starch degradation<br />
products that, on average, reach the human large intestine’<br />
(Englyst et al., 1992). The challenge for in vitro methods that<br />
attempt to quantify the RS content of foods is to reflect the<br />
mean values obtained by the in vivo studies.<br />
Except for the modified RS4, resistant starch is not<br />
chemically different from starch digested and absorbed from<br />
the small intestine although products high in amylose have<br />
a higher propensity to form RS. The amounts of RS in foods is<br />
largely dependent on the degree of food processing, which<br />
can result in an increase or a decrease in the RS values from<br />
those found in the raw product. Therefore, RS needs to be<br />
measured in foods as they would normally be eaten, and<br />
values cannot be derived by summing the RS contents of raw<br />
ingredients, or indeed be measured in samples that have<br />
undergone laboratory preparation (freeze-drying/milling)<br />
before analysis, as this can influence the RS content.<br />
Numerous RS methods have been proposed which have<br />
been reviewed (Champ et al., 2003). The basis of methods<br />
for the determination of RS is the measurement of starch<br />
remaining unhydrolysed after a defined period of incubation<br />
with amylolytic enzymes. Measurements of total RS must<br />
include RS1, RS2 and RS3. However, due to inappropriate<br />
European Journal of Clinical Nutrition<br />
Nutritional characterization and measurement of dietary carbohydrates<br />
K Englyst et al<br />
sample preparation and gelatinization of starch during the<br />
procedure, many methods measure only RS3, or only RS2<br />
and RS3 fractions. In addition, few of the methods have been<br />
developed and validated in conjunction with in vivo studies.<br />
Consequently, highly variable RS values have been reported<br />
for similar foods.<br />
In summary, methods designed to investigate the rate and/<br />
or the extent of starch digestion in the human gut should<br />
incorporate the following principles; analysis of foods<br />
prepared ‘as eaten’, reproducible disruption of the physical<br />
structure of food, standardized conditions of amylolytic<br />
hydrolysis, development and validation of methods in<br />
conjunction with in vivo studies. The analytical procedure<br />
for rapidly available glucose, slowly available glucose and RS<br />
determination conforms to these principles, and has been<br />
tuned to yield values for RS that match the mean proportion<br />
of starch recovered in ileostomy studies for both single foods<br />
and mixed meals (Englyst et al., 1992; Silvester et al., 1995).<br />
Dietary fibre<br />
The term dietary fibre has been applied by different<br />
researchers and in varied disciplines within the field of<br />
nutrition to describe a diverse range of substances. This has<br />
resulted in often disparate interpretations of what is meant<br />
by the term, a situation that has not been helped by the fact<br />
that the phrase ‘dietary fibre’ does not in itself provide an<br />
unambiguous description of what it consists of. At best,<br />
‘dietary’ infers that this is a food component, and ‘fibre’<br />
implies a fibrous, coarse or structural nature. It is agreed that<br />
it was originally used as shorthand for plant cell walls and<br />
that it was intended as a nutritional term describing a<br />
potentially beneficial characteristic of the diet.<br />
In the intervening period, a large number of definitions<br />
have been proposed. Suggestions have included one or more<br />
of the following characteristics: chemical identity; intrinsic<br />
material occurring naturally in foods; resistance to digestion<br />
in the small intestine; demonstration of a specific physiological<br />
effect; and material recovered by a particular methodology.<br />
Where inconsistencies between definitions have<br />
emerged, these can be related directly to which inclusion<br />
criteria have been applied. In striving for a usable approach,<br />
it is important that any limitations associated with proposed<br />
definitions are identified so that any potential conflict with<br />
dietary guidelines and health issues can be assessed.<br />
In essence, the current situation can be summarized by<br />
two contrasting approaches. One firmly retains the link with<br />
plant foods with the definition ‘dietary fibre consists of<br />
intrinsic plant cell-wall polysaccharides’, which remains true<br />
to the original concept. The other approach has ‘indigestibility<br />
in the small intestine’ as its central feature and<br />
encompasses a wider range of substances from diverse<br />
sources. In November 2006, the Codex committee on<br />
nutrition and foods for special dietary uses (CCNFSDU) was
asked to consider both the ‘plant-rich diet’ and the<br />
‘indigestibility’ approaches to dietary fibre definition.<br />
As the substances included within these two approaches<br />
to definition is not the same, the potential public health<br />
implications associated with each of them will also differ. Its<br />
prominent position in guidelines and the associated health<br />
messages has led to good consumer recognition of the<br />
dietary fibre term. Therefore, dietary fibre is very much a<br />
public health term, and a foremost consideration must be to<br />
ensure that consumers can interpret dietary fibre values and<br />
any associated nutrition claims in a manner that assists them<br />
with informed choice in diet selection, and that does not present<br />
the opportunity for the misrepresentation of products.<br />
An important aspect of nutrition is the requirement to<br />
describe clearly defined nutritional components. To this end,<br />
methods of analysis are a secondary issue, where suitability<br />
should be assessed on how well they measure the intended<br />
component. This principle should apply to the definition<br />
and measurement of every nutrient, but for dietary fibre<br />
there has been an inappropriate emphasis on methodology,<br />
to the extent that some proposed definitions have been<br />
based on the material recovered by a particular analytical<br />
procedure. This is an unacceptable situation with respect to<br />
describing food composition. Analytical methods should be<br />
‘fit for purpose’, which for dietary fibre can be assessed by<br />
the following criteria: (1) whether the material described in<br />
the respective stated aims of methods are suitable as a<br />
measure of dietary fibre; (2) the degree to which the methods<br />
actually measure the material described within their respective<br />
stated aims.<br />
The sections that follow evaluate the rationales behind<br />
the ‘plant-rich diet’ and ‘indigestibility’ approaches to the<br />
definition of dietary fibre, including discussion of their<br />
perceived limitations (summarized in Table 5). This includes<br />
an assessment of the methodological approaches available<br />
for the determination of the substances included in each<br />
definition, with a comparison of the main NSP and<br />
enzymatic–gravimetric methods provided in Table 6.<br />
The plant-rich diet approach to dietary fibre definition<br />
Associated definition. By this approach, dietary fibre is a<br />
characterized component of plant foods, providing a consistent<br />
indicator of the minimally refined plant-rich diet<br />
promoted by the food-based guidelines for dietary fibre<br />
consumption. As part of the Food and Agriculture Organization/World<br />
Health Organization scientific update on carbohydrates<br />
in human nutrition, held in Geneva July 2006, it<br />
was agreed that the definition of dietary fibre should<br />
maintain this clear link to fruits, vegetables and whole grain<br />
cereals and the following definition was subsequently<br />
endorsed on behalf of the carbohydrate scientific update<br />
for consideration by CCNFSDU.<br />
‘Dietary fibre consists of intrinsic plant cell-wall polysaccharides’<br />
This definition, together with its rationale and associated<br />
measurement, was proposed at the Geneva meeting in the<br />
Nutritional characterization and measurement of dietary carbohydrates<br />
K Englyst et al<br />
presentation relating to this paper, and is described in the<br />
following sections. The definition cannot easily be misinterpreted,<br />
as demonstrated when evaluating its component<br />
parts:<br />
‘Intrinsic’—This emphasizes that the health benefits of<br />
plant-rich diets is not restricted just to the plant cell wall<br />
(or its polysaccharide component), but may relate as well<br />
to the overall profile of associated micronutrients and<br />
phytochemicals.<br />
‘Plant cell wall’—This identifies the food component of<br />
interest and therefore specifies that it is the structural<br />
polysaccharides of the plant cell wall that should be<br />
determined.<br />
‘Polysaccharides’—This establishes that dietary fibre is a<br />
carbohydrate term, providing the required chemical<br />
element that should form an essential part of any<br />
definition.<br />
Rationale and implications of the plant-rich diet approach. The<br />
modern concept of dietary fibre as a protective nutritional<br />
component has stemmed largely from observations that<br />
diets rich in unrefined plant foods were associated with a<br />
lower incidence of certain diseases including diverticular<br />
disease, colon cancer and diabetes (Burkitt, 1969; Trowell,<br />
1972; Trowell et al., 1985). When compared with their<br />
refined counterparts, the most prominent identifying characteristic<br />
of these foods and diets was the presence of largely<br />
unprocessed plant cell-wall material, which is composed<br />
predominantly of structural polysaccharides. The need to<br />
distinguish this carbohydrate fraction on the basis that it did<br />
not provide the same energy as starch and sugars was already<br />
recognized (McCance and Lawrence, 1929). However, rather<br />
than the issue of energy alone, it has been the prospect of an<br />
association with more direct health benefits that has driven<br />
the demand for a dietary fibre term. The prominent public<br />
health status of dietary fibre and the positive nutritional<br />
message it conveys is largely the result of the consistent<br />
advice within dietary guidelines to increase consumption of<br />
dietary fibre in the form of fruits, vegetables and whole<br />
grains (Department of Health, 1991; WHO, 2003; USDA/<br />
DHHS, 2005). Furthermore, the reference intake values and<br />
nutrition claims relating to dietary fibre have been established<br />
from the health benefits that have been associated<br />
with the intake of these naturally high fibre foods. For<br />
example, the current American reference intake values are<br />
based mainly on three prospective studies on the association<br />
with cardiovascular disease (Pietinen et al., 1996; Rimm et al.,<br />
1996; Wolk et al., 1999; IOM, 2002).<br />
There are important distinctions between advice that<br />
specifies increased intake of dietary fibre from specific food<br />
groups, as opposed to a solely nutrient-based approach. For<br />
instance, their high water content means that fruits and<br />
vegetables may not at first appear to be particularly good<br />
sources of dietary fibre when they are considered in terms of<br />
g/100 g as consumed. In fact, it is precisely this quantitatively<br />
small amount of plant cell wall material that confers the<br />
S27<br />
European Journal of Clinical Nutrition
S28<br />
Table 5 Comparison of the plant-rich diet and indigestibility approaches to the definition of dietary fibre<br />
Plant-rich diet approach Indigestibility approach<br />
Definition: ‘Intrinsic plant cell-wall polysaccharides’. Definition: ‘Indigestible carbohydrate (DP43) and lignin.’<br />
Rationale: This definition is targeted specifically at the fruits, vegetables<br />
and whole grain products that are consistently linked with health<br />
benefits.<br />
These foods have the characteristic feature of containing plant cell walls,<br />
which mainly consist of structural polysaccharides, which can be<br />
quantified in chemical terms. Other non-carbohydrate components are<br />
not included as they can neither be determined specifically nor would<br />
their inclusion enhance the definition as an indicator of these foods.<br />
The definition recognizes that the benefits of a natural fibre-rich diet are<br />
not due to any single component, but rather the effect of synergistic<br />
elements including micronutrients, phytochemicals and low energy<br />
density.<br />
Scientific evidence for rationale: This is a food-based rationale, which is<br />
strongly supported by the epidemiological evidence for the health<br />
benefits of fruits, vegetables and whole grain products.<br />
Retaining a distinct dietary fibre term identifying plant-rich diets with<br />
their unique health benefits reinforces the food-based dietary guidelines.<br />
This distinction allows the properties of other resistant carbohydrates to<br />
be researched and if appropriate promoted in their own right.<br />
Nutrition labelling: A dietary fibre value describing intrinsic plant cell-wall<br />
polysaccharides would guide consumers to the selection of plant-rich<br />
foods.<br />
If other sources of resistant carbohydrates are present, then there would<br />
be scope for these to be labelled specifically.<br />
Nutrition and health claims: The claims for dietary fibre are largely based<br />
on the epidemiological evidence, which relates to fibre from plant-rich<br />
diets.<br />
When appropriate, specific health claims should be established for<br />
individual resistant carbohydrate functional ingredients, thereby<br />
acknowledging their specific properties and taking account of variations<br />
in their effective and safe dosages.<br />
Population reference intakes: The population reference intake values for<br />
dietary fibre are largely based on the epidemiological evidence that<br />
minimally refined plant-rich diets are associated with a lower incidence of<br />
several diseases.<br />
The intrinsic plant cell-wall polysaccharide definition ensures that dietary<br />
fibre intakes contributing towards the reference value would consistently<br />
reflect both the epidemiological evidence and the intended message of<br />
the dietary guidelines.<br />
Impact on food industry: Although values for ‘intrinsic plant cell-wall<br />
polysaccharides’ are generally lower than those for the indigestibility<br />
approach, this should not make a difference to the marketing of the<br />
majority of products, as population reference intakes and claims would<br />
be based on the plant-based approach.<br />
The emphasis would be on manufacturers to incorporate minimally<br />
refined plant ingredients into products to achieve nutrition claims for<br />
dietary fibre.<br />
There would be a positive opportunity to market other types of resistant<br />
carbohydrates with respect to their specific functional properties.<br />
For food labelling purposes, there would be cost savings with the analysis<br />
of NSP compared to the enzymatic-gravimetric and supplementary<br />
analysis.<br />
Impact on nutrition research: Maintaining ‘intrinsic plant cell-wall<br />
polysaccharides’ as a distinct definition of dietary fibre facilitates research<br />
European Journal of Clinical Nutrition<br />
Nutritional characterization and measurement of dietary carbohydrates<br />
K Englyst et al<br />
Rationale: There are numerous versions of this definition, which have the<br />
common feature of placing the emphasis on escaping digestion in the<br />
small intestine. The definition is not restricted to carbohydrates as it<br />
encompasses lignin and other substances associated with the plant cell<br />
wall.<br />
In addition to the plant cell-wall polysaccharides, the indigestibility<br />
criterion has the implication of including RS and other extracted or<br />
synthesized carbohydrates, including resistant oligosaccharides.<br />
However, as this grouping can include a wide range of substances it has<br />
been suggested that there should also be a demonstrated physiological<br />
effect for a specific material to be included.<br />
Scientific evidence for rationale: For the existing epidemiological evidence<br />
relating to the last few decades this definition provides a reasonable<br />
indicator of plant-rich diets, as supplementation with resistant<br />
carbohydrate preparations was uncommon. However, this is not always<br />
the case for manufactured products developed recently.<br />
Specific physiological properties have been associated with individual<br />
supplements, but these vary depending on type, making it difficult to<br />
consider them within a single definition. The long term health effects/<br />
safety remains to be established.<br />
Nutrition labelling: By the indigestibility approach the fibre label would<br />
not provide a consistent indicator of plant-rich foods that may mislead<br />
consumers who have this expectation. By grouping all indigestible<br />
carbohydrates within a single undifferentiated nutrition label, there is less<br />
opportunity to identify any added functional ingredients.<br />
Nutrition and health claims: The epidemiological evidence for dietary fibre<br />
cannot be extrapolated to a definition that includes enzymaticgravimetric<br />
values of unknown composition, as well as a range of<br />
supplemented materials with varied functional properties. There is the<br />
potential for inappropriate nutrition claims for materials with either no<br />
effect or detrimental properties, which would undermine the position of<br />
dietary fibre as a beneficial food component.<br />
Population reference intakes: The use of this definition could result in a<br />
situation where the consumer selects supplemented products on the<br />
basis that they will contribute towards the reference intake value,<br />
although in reality this would not be a true reflection of the intention of<br />
the dietary guidelines. This raises two concerns (1) that the<br />
supplemented product is unjustly promoted on the back of the<br />
epidemiological evidence; and (2) that if direct substitution of products<br />
occurs, then the consumption of the intended target of plant-rich food<br />
groups may be diminished.<br />
Impact on food industry: With this definition, there would be less impetus<br />
for the manufacturer to incorporate unrefined plant ingredients, as it<br />
would be possible to elevate the dietary fibre content through processing<br />
or supplementation instead. However, it would be difficult for the<br />
consumer to distinguish between these different types of product if they<br />
carried identical nutrition claims. This may be perceived as conflicting<br />
with the intended aim of reference intake values and dietary guidelines<br />
which are targeted at plant-rich diets.<br />
Grouping varied functional ingredients together limits the opportunities<br />
for manufacturers to promote the specific properties of individual<br />
products. As gravimetric values are influenced by food processing, food<br />
labelling cannot be based on food table values of component<br />
ingredients.<br />
Impact on nutrition research: The indigestibility approach groups diverse<br />
substances including plant cell-wall material, retrograded starch,
Table 5 Continued<br />
Plant-rich diet approach Indigestibility approach<br />
into the benefits of plant-rich diets, and encourages specific research into<br />
types of resistant carbohydrate preparations.<br />
Only with detailed information on distinct substances will it be possible<br />
for future epidemiological studies to establish the intakes and effects of<br />
different types of resistant carbohydrates.<br />
DP, degree of polymerisation.<br />
supplements and non-carbohydrate artifacts in unknown proportions.<br />
This single undifferentiated grouping will not provide the detailed<br />
information required by future epidemiology studies to establish the<br />
intakes and health effects of different types of resistant carbohydrates.<br />
Nutrition research is better served by detailed information on specific<br />
food components.<br />
Table 6 Comparison of the principles and analytical issues relating to the principal methods associated with the plant-rich diet approach (NSP method)<br />
and the indigestibility approach (enzymatic–gravimetric methods) to the definition of dietary fibre<br />
NSP Method Enzymatic–gravimetric methods (AOAC 985.29 & 991.43)<br />
General principles General principles<br />
Stated aim: To measure polysaccharides that do not contain the a 1–4<br />
glucosidic linkages characteristic of starch (i.e., NSP)<br />
Analytical principle: Complete dispersion and enzymatic hydrolysis of<br />
starch.<br />
Precipitate residue in 80% ethanol and isolate by centrifugation.<br />
Hydrolyse and measure NSP as constituent sugars by colorimetry or<br />
chromatography.<br />
Information provided: Values for total, soluble and insoluble NSP, with the<br />
option of detailed information on constituent sugars by the GC version.<br />
Effect of food processing: As a chemically distinct food component, NSP is<br />
minimally affected by normal food processing.<br />
Is stated aim achieved: Yes. The procedure completely removes starch and<br />
sugars and provides a specific determination of NSP.<br />
Analytical issues Analytical issues<br />
Specific reagents and equipment:<br />
Enzymes: Heat stable amylase, (EC 3.2.1.1), pullulanase (EC 3.2.1.41),<br />
pancreatin (these enzymes should be devoid of NSP hydrolytic activities),<br />
pectinase (EC 3.2.1.15).<br />
Analysis vessels: screw cap test tubes.<br />
Equipment: Centrifuge and either spectrophotometer or GC system.<br />
Practical issues: All the steps of this procedure are conducted in test tubes,<br />
which makes it well suited to the analysis of large batch sizes.<br />
It is important to ensure complete starch dispersion and hydrolysis,<br />
which is achieved by a combination of physical, chemical and enzymatic<br />
steps.<br />
The chemical end-point determination techniques are those used in the<br />
measurement of other carbohydrates (e.g., sugars, starch).<br />
The procedure takes 1 day with colorimetric measure or 1.5 days for<br />
GC measure.<br />
Environmental impact: Only small amounts of solvent waste generated.<br />
Suitability for use in developing countries: The NSP procedure only requires<br />
standard laboratory equipment including a spectrophotometer for the<br />
colorimetric version.<br />
Traceability: The primary standard is a representative mixture of the<br />
individual monosaccharides of NSP.<br />
Method specificity: Only NSP is measured, with no interference from other<br />
substances.<br />
Method reproducibility: A range of certified reference materials are<br />
available (e.g., BCR). Method CV o5%.<br />
Nutritional characterization and measurement of dietary carbohydrates<br />
K Englyst et al<br />
Stated aim: To measure the sum of indigestible polysaccharides and<br />
lignin.<br />
Analytical principle: Partial enzymatic hydrolysis of starch and protein.<br />
Precipitate residue in 80% ethanol and isolate by filtration.<br />
Record total residue weight and then determine and subtract ash and<br />
protein contents.<br />
Information provided: Weight of total, soluble and insoluble residue<br />
containing carbohydrate and non-carbohydrate material in unknown<br />
proportions.<br />
Effect of food processing: A range of materials are recovered in the residue,<br />
which is highly dependent on food processing (e.g., retrograded starch,<br />
Malliard reaction products).<br />
Is stated aim achieved: No, not consistently. In addition to NSP, this<br />
procedure measures a variable amount of RS, which may not relate to the<br />
true extent of physiological starch digestion. In addition to lignin, the<br />
non-carbohydrate part can include food processing artifacts.<br />
Specific reagents and equipment:<br />
Enzymes: Heat stable amylase, (EC 3.2.1.1), protease, amyloglucosidase<br />
(EC 3.2.1.3). These enzymes should be devoid of NSP hydrolytic<br />
activities.<br />
Analysis vessels: 400 ml beakers and fritted glass crucibles.<br />
Equipment: vacuum manifold, muffle furnace and Kjeldahl equipment.<br />
Practical issues: Batch sizes are limited by the difficulties of handling large<br />
numbers of 400 ml beakers.<br />
The selective removal of starch other than RS is difficult or impossible to<br />
achieve within this procedure.<br />
The method is labour intensive due to: preparation and repeated<br />
weighing of the crucibles; numerous pH checks; manual transfer and<br />
filtration of residues; subsidiary ash and Kjeldahl methods.<br />
The procedure takes 1.5–2 days or more with longer filtration times.<br />
Environmental impact: Large amounts of solvent waste are generated.<br />
Suitability for use in developing countries: The gravimetric procedure<br />
requires specialist glassware, muffle furnace and Kjeldahl equipment for<br />
the measurement of nitrogen.<br />
Traceability: No primary standard is available as the procedure does not<br />
measure a chemically distinct component.<br />
Method specificity: Any added material or food processing artefacts<br />
recovered in the residue are a potential source of interference.<br />
Method reproducibility: A range of certified reference materials are<br />
available (e.g., BCR). Method CV o5%.<br />
S29<br />
European Journal of Clinical Nutrition
S30<br />
Table 6 Continued<br />
NSP Method Enzymatic–gravimetric methods (AOAC 985.29 & 991.43)<br />
Suitability as a measure of dietary fibre Suitability as a measure of dietary fibre<br />
Potential discrepancies with definitions: For plant foods, the NSP content is<br />
a measure of ‘intrinsic plant cell-wall polysaccharides’.<br />
In a few plants NSP can occur as gums and alginates, but these are not<br />
typical foods and are more likely to occur as ingredient extracts.<br />
When extracted or synthesized NSP are present in products then these<br />
will be known by the manufacturer and can be deducted from the NSP<br />
measurement to obtain a value for the intrinsic plant cell-wall<br />
polysaccharides. The presence of specific extracts can often be identified<br />
by their NSP constituent sugar profile.<br />
With the plant cell-wall polysaccharide definition, resistant<br />
oligosaccharides and RS are separate groupings. Their content in foods is<br />
measured specifically and they do not conflict with the NSP<br />
measurement.<br />
Evaluation of method: The intrinsic plant cell-wall polysaccharide<br />
definition provides a clear link to the plant-rich diet shown to be<br />
beneficial to health. The NSP procedure provides measurements that are<br />
suitable for this definition.<br />
Abbreviation: GC, gas chromatography.<br />
high water-holding ability of fruit and vegetables, which in<br />
turn is responsible for their low energy density. In addition,<br />
the plant cell walls have a central role in defining the high<br />
nutrient density with respect to vitamins, minerals and<br />
phytochemicals, which are considered as closely associated<br />
companion nutrients. These are unique nutritional properties<br />
associated with the dietary fibre in these food groups, and<br />
therefore food-based guidelines for dietary fibre are always<br />
applicable even if, as is the case with fruits and vegetables,<br />
their contribution to dietary fibre intake is often modest<br />
compared with that derived from whole grain products.<br />
The benefits of plant cell-wall-rich foods is supported by<br />
prospective observational studies that identified significant<br />
inverse relationships between intake of fruits, vegetables<br />
and whole grains and incidence of cardiovascular disease,<br />
diabetes and some cancers (Jacobs et al., 1998; Liu et al.,<br />
1999, 2003; van Dam et al., 2002; Bazzano et al., 2003, 2005;<br />
Rissanen et al., 2003; Slavin, 2003; Steffen et al., 2003; WHO,<br />
2003). To ensure consistency for the public health message<br />
being conveyed, it is essential that any measure of dietary<br />
fibre is a true representation of the unrefined plant foodbased<br />
diet endorsed by the epidemiological evidence and<br />
dietary guidelines.<br />
The nutritional relevance of ‘intrinsic plant cell wall<br />
polysaccharides’ can be considered at various levels (1) as a<br />
distinct carbohydrate component of the food, (2) as a<br />
provider of cell wall structures and (3) as a marker of a diet<br />
rich in micronutrients. When present as an intrinsic part of<br />
plant foods, these elements connected with cell-wall polysaccharides<br />
cannot be disassociated from one another, with<br />
the implication that it is not possible to assign the benefits of<br />
dietary fibre-rich diets to just one of these attributes. In other<br />
words, the proposal to define dietary fibre as the ‘intrinsic<br />
plant cell-wall polysaccharides’ is based on the fact that this<br />
European Journal of Clinical Nutrition<br />
Nutritional characterization and measurement of dietary carbohydrates<br />
K Englyst et al<br />
Potential discrepancies with definitions: As the AOAC gravimetric<br />
procedure measures a range of indigestible materials of varied<br />
composition and origin it does not provide a consistent measure of plant<br />
cell-wall material.<br />
It can include non-carbohydrate food processing artifacts (e.g., Maillard<br />
reaction products) that are not part of any dietary fibre definition.<br />
The residual starch recovered can be misleading, as it does not relate to<br />
physiologically RS, for which separate measurement is required.<br />
It does not recover resistant oligosaccharides, resistant maltodextrins or<br />
all RS, and therefore by itself does not provide a measure of the<br />
indigestible carbohydrates proposed for inclusion. These substances<br />
require separate analysis if they are to be included.<br />
Evaluation of method: The indigestible carbohydrate and lignin definition<br />
does not consistently identify plant-rich diets. Neither does the AOAC<br />
gravimetric procedure provide a consistent measurement of the material<br />
included in this definition.<br />
is the only component that is consistently associated with<br />
the plant-rich diet linked with reduced disease incidence.<br />
Determination of intrinsic plant cell-wall polysaccharides. This<br />
approach describes a chemically defined food component<br />
that can be determined by an enzymatic–chemical method.<br />
The stated aim of this method is to measure the polysaccharides<br />
that do not have the a-(1–4) glucosidic linkages<br />
characteristic of starch. Therefore, the method is designed to<br />
disperse and remove all starch, with NSP measured as the<br />
sum of chemically identified NSP constituent sugars (Englyst<br />
et al., 1994).<br />
The enzymatic–chemical method for the analysis of NSP is<br />
an extension of the pioneering work of McCance and<br />
Lawrence (1929) and later of Southgate (1969), which<br />
recognized the importance of the direct measurement of<br />
the various types of carbohydrates for nutrition composition<br />
purposes. NSP forms part of the unified scheme to classify<br />
and measure all food carbohydrates (Table 1). To evaluate it<br />
as a measure of dietary fibre, the NSP method is assessed here<br />
in terms of its suitability to measure ‘intrinsic plant cell wall<br />
polysaccharides’.<br />
In typically consumed unsupplemented foods, the entire<br />
NSP component will be derived from the intrinsic plant cell<br />
wall. The advantage of NSP as a chemically distinct<br />
substance is that it is not in itself created or destroyed by<br />
normal food preparation or storage techniques, which<br />
means that NSP can be used as a fairly consistent indicator<br />
of plant cell-wall material. When added preparations of NSP<br />
are present in foods, these too are measured as their<br />
carbohydrate components, and will contribute to the total<br />
NSP value. Manufacturers’ data on the amount and type of<br />
carbohydrate preparation used will normally be sufficient to
account for any supplemented material present. However, for<br />
the purpose of traceability and authenticity checks, it would<br />
in most cases be possible to identify the presence of specific<br />
preparations by their profile of constituent NSP sugars. For<br />
example, the presence of guar gum in a product can be<br />
identified by higher galactose and mannose compared with<br />
the NSP sugar profile of the unsupplemented food.<br />
Unfortunately, a lack of understanding of the practical<br />
issues involved has led to inaccurate statements about the<br />
complexity of the NSP method. The actual situation is that<br />
the enzymatic–gravimetric method, promoted as part of the<br />
‘indigestibility approach’, is more time consuming, resource<br />
demanding and subsequently more expensive to perform<br />
than the NSP procedure. The NSP method has been subjected<br />
to successful collaborative trials (Wood et al., 1993;<br />
Pendlington et al., 1996) and for routine purposes, including<br />
food labelling, NSP can be determined by colorimetry with a<br />
simple spectrophotometer. Furthermore, the NSP method<br />
is well suited to the analysis of large batch sizes as it uses test<br />
tubes as the reaction vessel, compared with cumbersome<br />
400 ml beakers and filtration crucibles used in the enzymaticgravimetric<br />
methods.<br />
The indigestibility approach to dietary fibre definition<br />
Associated definition. By this approach, the primary defining<br />
characteristic is indigestibility in the small intestine, thereby<br />
grouping together diverse substances. In addition to cell-wall<br />
polysaccharides, such a grouping would include non-structural<br />
carbohydrates that are normally absent, or present only<br />
in small amounts in most foods (for example, inulin), and<br />
in the case of RS is largely dependent on food processing.<br />
Also included would be extracted, synthesized, or otherwise<br />
manufactured polysaccharides and oligosaccharides that<br />
could be added to individual foods in considerable amounts.<br />
A proposed definition based on this approach has been<br />
considered by CCNFSDU in the context of providing guidelines<br />
for the use of nutrition claims. The proposed definition<br />
states as follows:<br />
Dietary fibre means carbohydrate polymers with a DP not<br />
lower than 3, which are neither digested nor absorbed in the<br />
small intestine. A DP not lower than 3 is intended to exclude<br />
mono- and disaccharides. It is not intended to reflect the<br />
average DP of a mixture.<br />
Dietary fibre consists of one or more of edible carbohydrate<br />
polymers naturally occurring in the food as consumed,<br />
carbohydrate polymers, which have been obtained from<br />
food raw material by physical, enzymatic or chemical means,<br />
synthetic carbohydrate polymers.<br />
In addition, this definition is associated with a lengthy<br />
footnote included to justify the use of specific enzymatic–<br />
gravimetric methods, which are acknowledged to recover a<br />
wide range of non-carbohydrate materials that would<br />
otherwise fall outside the stated definition.<br />
Also linked with the definition is a statement relating to<br />
the physiological properties generally considered to be<br />
Nutritional characterization and measurement of dietary carbohydrates<br />
K Englyst et al<br />
associated with dietary fibre and the recommendation that<br />
‘where a declaration or claim is made with respect to dietary<br />
fibre, a physiological effect should be scientifically demonstrated’,<br />
with the exception of naturally occurring polymers<br />
for which no such justifying criteria were deemed necessary.<br />
With respect to the application of this definition, it goes on<br />
to raise issues as to the food safety requirements, diverse<br />
efficacies of different substances purporting to be dietary fibre,<br />
and the consumer perception of fibre as being of plant origin.<br />
Due to the diverse nature of the substances included, there<br />
is no single analytical method currently available that will<br />
provide an accurate and comprehensive determination of<br />
the material encompassed within the indigestibility approach.<br />
Instead, 10 methods of analysis are stated in<br />
connection with this definition, with one of two versions<br />
of an enzymatic–gravimetric technique considered to be the<br />
principal method.<br />
Rationale and implications of the indigestibility approach. As<br />
evidenced by the length of the above definition and<br />
associated conditions, the rationale for this indigestibility<br />
approach is necessarily more complex as it tries to amalgamate<br />
issues of food composition, analytical methodologies<br />
and physiological attributes. The primary basis for the<br />
indigestibility approach is the fundamental difference in<br />
the physiological handling of carbohydrates depending on<br />
their gastrointestinal fate.<br />
However, although it may be possible to group diverse<br />
substances by a shared attribute such as indigestibility, this<br />
does not mean that such groupings should necessarily form<br />
the basis for dietary advice. The relation between the<br />
amount and type of fermentable substrate reaching the<br />
colon and related physiological parameters is incompletely<br />
understood, with both beneficial and potentially adverse<br />
effects having been reported. There is insufficient evidence<br />
to suggest that all sources of resistant carbohydrates should<br />
be actively promoted, or that it would be desirable to set a<br />
single population reference value for total resistant carbohydrate<br />
intake. Nevertheless, this would in essence be the<br />
prospect with the indigestibility based dietary fibre definition.<br />
As the characteristic of ‘being neither digested nor<br />
absorbed in the small intestine’ does not in itself equate to<br />
a health benefit, it is implied that a further level of justifying<br />
criteria are needed for functional ingredients to be considered<br />
as dietary fibre by the indigestibility approach. This<br />
therefore relies on an evidence base of specific physiological<br />
properties being associated with individual substances.<br />
Although a range of physiological parameters have been<br />
investigated, it is not always clear to what extent these<br />
translate into actual health benefits. What is apparent is the<br />
diversity of the substances and their efficacies with respect<br />
to physiological outcomes varies widely. For example, the<br />
varied impact of different resistant carbohydrates on stool<br />
weight and prebiotic effects are reviewed in the physiology<br />
paper (Elia and Cummings, 2007).<br />
S31<br />
European Journal of Clinical Nutrition
S32<br />
The common attribute of the substances included in the<br />
indigestibility approach is that they provide potential<br />
substrates for colonic fermentation, stimulating bacterial<br />
growth and the production of SCFA, which have a range of<br />
physiological effects (Macfarlane et al., 2006; Wong et al.,<br />
2006). Different amounts and types of substrate vary in the<br />
rate, site and extent of fermentation and the profile of SCFA<br />
produced. Although butyrate has been proposed as protective<br />
against colon cancer, the effects it has are complex and<br />
somewhat contradictory (Sengupta et al., 2006). Some<br />
studies have found butyrate providing substrates have had<br />
adverse effects (Burn et al., 1996; Wacker et al., 2002), and it<br />
seems that the amount, site, whether promixal or distal, and<br />
underlying conditions all influence the effect of butyrate.<br />
The desirability of providing large amounts of easily<br />
fermented resistant carbohydrate substrates has been questioned<br />
(Wasan and Goodlad, 1996; Goodlad, 2007), with<br />
concern about the impact of a feast or famine scenario on<br />
gut health. The epidemiological evidence base for a protective<br />
effect of resistant carbohydrates against colon cancer has<br />
been inconclusive (Bingham et al., 2003; Park et al., 2005),<br />
and so far, intervention studies have tended to show either<br />
no effect or a worsening in outcomes (Alberts et al., 2000;<br />
Bonithon-Kopp et al., 2000). On reviewing the evidence Food<br />
Drug Administration concluded that dietary fibre did not<br />
protect against colon cancer (FDA, 2000).<br />
It should be noted that the exclusion of DP o3 by the<br />
indigestibility linked definition demonstrates a lack of<br />
consistency, as resistant sugars such as lactulose and some<br />
polyols share similar physiological attributes to those<br />
suggested as the basis for characterizing carbohydrates with<br />
DP 43 as dietary fibre, for instance prebiotic effects (Gostner<br />
et al., 2006), and promoting calcium absorption (van den<br />
Heuvel et al., 1999). In addition, by this approach it is not<br />
clear how to handle carbohydrate ingredients that are<br />
indigestible, but for which no beneficial physiological<br />
attributes have been demonstrated.<br />
While the addition of resistant carbohydrates to products<br />
has no direct impact on the food-based guidelines to<br />
consume dietary fibre as fruits, vegetables and whole grains,<br />
there is a greater potential for confusion with respect to the<br />
population reference intake values. For dietary fibre, these<br />
have predominantly been derived from epidemiological<br />
evidence linking plant-rich diets with reduced disease<br />
incidence. However, unless supplemented foods are clearly<br />
identified as such, then a potential conflict arises if the<br />
consumer perceives that such preparations are directly<br />
equivalent to the dietary fibre present in unsupplemented<br />
foods. This could result in a situation where the consumer<br />
selects supplemented products on the basis that they will<br />
contribute towards the reference intake value, although in<br />
reality this would not be a true reflection of the intention of<br />
the dietary guidelines.<br />
This argument does not preclude that some resistant<br />
carbohydrate preparations cannot have a position within<br />
diets, but it should be emphasized that such formulations are<br />
European Journal of Clinical Nutrition<br />
Nutritional characterization and measurement of dietary carbohydrates<br />
K Englyst et al<br />
researched and if shown beneficial promoted on the basis of<br />
the usually very specific functional properties that they may<br />
have. If resistant carbohydrate preparations were included as<br />
dietary fibre, the population reference intake values established<br />
by the epidemiology evidence base would become<br />
redundant, as there would be no clear link between the food<br />
label and the guideline.<br />
It should also be considered that the bulking effect that<br />
acts to self-limit the intake of foods with a naturally high<br />
dietary fibre content, represents much less of a constraint for<br />
some resistant starches and resistant oligosaccharides that<br />
can be formulated within products in relatively high<br />
amounts, and could make a considerable contribution to<br />
some diets. This highlights the need to consider potential<br />
detrimental effects and whether safe upper intake limits for<br />
resistant carbohydrates are required.<br />
Determination of substances included within the indigestibility<br />
approach. The principle of determining carbohydrates<br />
grouped on the basis of the physiological attribute of<br />
indigestibility in the small intestine has already been<br />
addressed within the earlier section on the measurement of<br />
resistant carbohydrates. Although NSP constitutes the major<br />
resistant carbohydrate fraction in most foods, this is typically<br />
not determined specifically by this approach, but instead<br />
forms part of an enzymatic–gravimetric measurement that<br />
includes other materials in unknown amounts. The values<br />
obtained by these enzymatic–gravimetric techniques have<br />
previously been presented as ‘total dietary fibre’ measures,<br />
but a number of supplementary methods have since been<br />
proposed to determine other substances included within the<br />
indigestibility approach. The principal enzymatic–gravimetric<br />
techniques and the other complementing methods are<br />
discussed in turn.<br />
Enzymatic–gravimetric procedures. The stated aim of these<br />
methods is to measure the sum of indigestible polysaccharides<br />
and lignin as the weight of a residue, corrected for ash<br />
and crude protein content, which remains after treatment<br />
with protease and amylolytic enzymes and washing with<br />
80% ethanol. These methods therefore do not focus on plant<br />
cell-wall material, but seek to include RS, which may be<br />
present in large amounts as the result of food processing or<br />
the addition of RS preparations. Non-carbohydrate materials<br />
are also recovered, with the given justification of measuring<br />
lignin and other non-carbohydrate cell-wall components,<br />
although in practice it also recovers food processing artefacts<br />
such as Maillard reaction products, which may have adverse<br />
physiological effects (Tuohy et al., 2006).<br />
This approach has evolved from the early methods used<br />
for measurement of ‘crude fibre’. The different versions of<br />
the enzymatic–gravimetric technique can be considered as<br />
modifications of the method proposed by Prosky and coworkers<br />
(AOAC method 985.29; AOAC, 2005). The most<br />
common variation is AOAC method 991.43, which uses a<br />
different buffer system. Briefly, they utilize 400 ml beakers as
eaction vessels, with successive treatments with amylase,<br />
protease and amyloglucosidase, each step requiring individual<br />
pH adjustments. Four volumes of ethanol are added<br />
and the precipitated material is transferred to a filtration<br />
crucible where it is dried and weighed. For each sample<br />
separate residues are collected for determination of ash and<br />
protein.<br />
Contrary to normal conventions of nutrient definition,<br />
the material recovered by these methods has been presented<br />
by some as a ‘de facto’ definition of dietary fibre (AACC,<br />
2001). Of the various materials that may be determined, only<br />
the intrinsic cell-wall polysaccharides are a consistent feature<br />
of natural unrefined plant foods, and for many plant-based<br />
products this will be the main component of the gravimetric<br />
fibre value. However, as this methodological approach can<br />
include some RS and other substances formed as the result of<br />
food processing or during sample preparation for analysis,<br />
it is not possible to identify how much, if any, of the ‘fibre’<br />
value is plant cell wall material (Ranhotra et al., 1991;<br />
Theander and Westerlund, 1993; Rabe, 1999). A detailed<br />
assessment of the influence of food processing on materials<br />
recovered by enzymatic–gravimetric approaches has been<br />
provided elsewhere (Englyst et al., 1996).<br />
This method cannot be considered as ‘fit for purpose’ in<br />
meeting the requirement to consistently reflect natural<br />
unrefined plant foods. Neither does it meet its own stated<br />
aim of measuring indigestible polysaccharides, as the RS<br />
recovered in the residue may have little bearing on what is<br />
present in the food. Lignin should be excluded from further<br />
consideration as part of a dietary fibre measure on the<br />
grounds that (1) it is not a carbohydrate, (2) it is not present<br />
in the human diet in significant amounts, (3) there is no<br />
specific routine method for is analysis, (4) its inclusion has<br />
often inappropriately been used to justify the presence of<br />
unidentified material in the gravimetric fibre residue.<br />
In terms of practicality for the analytical chemist, the<br />
enzymatic–gravimetric approach is excessively cumbersome.<br />
It requires considerable time and reagent resources and is not<br />
well suited to large batch sizes, increasing the cost of this<br />
analysis.<br />
Complementary procedures for the indigestibility approach. The<br />
intended purpose of the other stated methods associated<br />
with this approach are to give additional information about<br />
individual resistant carbohydrate fractions and provide<br />
determinations of those substances that are incompletely<br />
recovered by precipitation in 78% ethanol with the enzymatic–gravimetric<br />
techniques. Several of these methods<br />
determine carbohydrates as their constituent sugar components<br />
released by hydrolysis, along the principles described<br />
in the carbohydrate determination section.<br />
Similar to the NSP procedure outlined earlier, the AOAC<br />
994.13. method is primarily based on the determination of<br />
sugars released by the acid hydrolysis of polysaccharides<br />
isolated by precipitation in ethanol. It differs in that by this<br />
technique starch is only partially dispersed and hydrolysed,<br />
Nutritional characterization and measurement of dietary carbohydrates<br />
K Englyst et al<br />
so unlike the NSP method it does not describe a chemically<br />
distinct grouping of carbohydrates. It also includes a<br />
determination of Klason lignin as the material recovered in<br />
an acid hydrolysis resistant residue. The reality is that Klason<br />
lignin can include a considerable amount of artifact material<br />
including Maillard reaction products formed during food<br />
processing.<br />
AOAC 2002.02 is a resistant starch method based on<br />
treatment with amylolytic enzymes and precipitation of<br />
unhydrolysed starch in 80% ethanol, which is then chemically<br />
dispersed and determined as glucose released by<br />
hydrolysis. As discussed in the resistant carbohydrate<br />
determination section, the degree of starch hydrolysis is<br />
influenced by the analytical conditions, and for this method<br />
these have principally been designed only to determine<br />
retrograded starch (RS3) and some RS2 in starch granules.<br />
Therefore, this method does not consistently provide a total<br />
RS determination, and neither does it measure the same<br />
starch fraction recovered by the enzymatic–gravimetric<br />
methods, making it difficult to integrate the values obtained<br />
by these methods. Furthermore, small starch degradation<br />
products resulting from the enzyme hydrolysis could<br />
potentially be lost in the 80% ethanolic supernatant, and<br />
therefore would not be included as RS.<br />
The AOAC 995.16 method determines b-glucans and is an<br />
example of the measurement of an individual NSP species<br />
by selective enzymatic hydrolysis. The AOAC 999.03 and<br />
997.08 methods determine fructans (inulin and fructooligosaccharides)<br />
as the fructose (and small amount of<br />
glucose) released after fructanase treatment. AOAC 997.08<br />
uses HPLC to measure the increase in released sugars on top<br />
of the sugars already released by hydrolysis of sucrose and<br />
starch, leading to a high uncertainty when dealing with<br />
small quantities of fructans. Although AOAC 999.03<br />
attempts to address this issue by the removal of sugars by<br />
chemical reduction prior to the fructan hydrolysis, this<br />
approach results in an incomplete recovery of lower DP<br />
fructooligosaccharides as their reducing end groups are also<br />
affected by the reduction step. Along similar principles, the<br />
AOAC 2001.02 method determines trans-galactooligosaccharides<br />
in an aqueous extract as the galactose released<br />
after treatment with b-galactosidase (EC 3.2.1.23), with a<br />
separate measurement and correction for galactose from<br />
lactose, which is also hydrolysed by this enzyme.<br />
The stated methods for the determination of polydextrose<br />
(AOAC 2000.11) and resistant maltodextrin (2001.03) do not<br />
measure their component glucose parts, but instead rely<br />
on quantification of intact oligosaccahrides by chromatography.<br />
AOAC 2000.11 is based on an aqueous extraction<br />
treated to hydrolyze those a 1–4 bonds of polydextrose that<br />
are accessible to an amylolytic enzyme, as well as removing<br />
any available starch and maltodextrins present. A fructanase<br />
treatment is also included to prevent fructans from coeluting<br />
with polydextrose when it is separated by high<br />
performance anion-exchange chromatography. The AOAC<br />
2001.03 method is actually an extension of the soluble/<br />
S33<br />
European Journal of Clinical Nutrition
S34<br />
insoluble version of the enzymatic–gravimetric method<br />
AOAC 985.29, and is intended to measure the resistant<br />
maltodextrins that remain in the solvent filtrate from the<br />
precipitation and washing of the water-soluble residue. This<br />
solvent filtrate, which can be up to 500 ml, is evaporated and<br />
then ion exchange resins are used to remove salts and<br />
proteins from the redisolved residue, which is then dried<br />
again and filtered before quantification by HPLC as units<br />
with DP43. There will be crossover in the materials<br />
measured by the AOAC 2001.03 and 2000.11 methods, and<br />
although fructans can be removed when present, the reality<br />
is that any resistant oligosaccharides and possibly other<br />
substances, may co-elute and therefore inflate the values<br />
obtained.<br />
Taken as a whole, the enzymatic–gravimetric analysis and<br />
the complementing AOAC methods form a disjointed<br />
approach to the determination of resistant carbohydrates.<br />
There is specific concern about the double counting of the<br />
same substances by more than one of these procedures,<br />
which severely limits the integration of values. It has been<br />
suggested by some that the combined enzymatic-gravimetric<br />
and resistant maltodextrin method could provide an<br />
integrated approach to dietary fibre determination for the<br />
indigestibility approach. This must be viewed with some<br />
skepticism, as both these determinations would be prone to<br />
interference due to their empirical nature, and furthermore,<br />
there would be no primary standards available to reflect the<br />
diversity of materials recovered by the HPLC measurement.<br />
The other disadvantage of applying empirical methods<br />
recovering unidentified material is that it is not possible to<br />
indicate what material is present, or how much, if any, of it<br />
conforms to the qualifying criteria of exhibiting beneficial<br />
physiological properties.<br />
Public health application of carbohydrate<br />
measurements<br />
The nutritional characterization of dietary carbohydrates<br />
should acknowledge the heterogeneity in the functional<br />
properties of carbohydrate containing foods. This ranges<br />
from a consideration of the metabolizable energy provided,<br />
to their varied physico-chemical characteristics in the<br />
gastrointestinal tract and subsequent effects on physiology<br />
and metabolism, and to the more holistic consideration of<br />
the overall nutrient profile of the foods.<br />
Describing these varied attributes in a consistent and<br />
nutritionally relevant manner has proved challenging, as<br />
chemical composition does not always adequately reflect<br />
functionality, especially in the context of the food matrix.<br />
The implication is that it has been difficult to assign<br />
population reference intake values and nutrition claims<br />
based on the commonly applied chemical divisions such<br />
as starch and sugars. There is therefore a requirement to<br />
incorporate additional nutritional descriptions into classification,<br />
measurement and public health messages relating to<br />
European Journal of Clinical Nutrition<br />
Nutritional characterization and measurement of dietary carbohydrates<br />
K Englyst et al<br />
carbohydrate containing foods. Some of the challenges and<br />
potential solutions are commented on here.<br />
Sugars<br />
The nutritional considerations relating to sugar containing<br />
foods can be evaluated by their impact on dental caries,<br />
excess energy intake, nutrient:energy ratios, and physiology<br />
due to metabolic differences between sugars. The complexity<br />
in the nutritional description of sugars relates to the food<br />
groups from which they are consumed. This need to<br />
distinguish between sugar sources was recognized by the<br />
development of the term intrinsic sugars for those retained<br />
in intact cellular structures (Department of Health, 1991)<br />
and the terms free sugars, added sugars and non-milk<br />
extrinsic sugars which are essentially synonymous with each<br />
other. US Department of Agriculture have prepared a large<br />
database with values for added and total sugars for a wide<br />
range of products (Pehrsson et al., 2006).<br />
There is no available evidence to suggest that there are any<br />
adverse effects on health outcomes in humans from the<br />
sugars consumed in the form of fruit, vegetables or milk. In<br />
any case, the bulky nature of fruits and vegetables tends to<br />
limit the absolute consumption of sugars from these sources.<br />
In contrast, free (or added) sugars have the potential to be<br />
consumed in large quantities and have a more direct impact<br />
on these related health issues (van Dam and Seidell, 2007).<br />
For this reason, guidelines have limited free sugar intake to<br />
o10% of energy (Department of Health, 1991; WHO, 2003).<br />
As there is no justification to have a specific limit for the<br />
consumption of intrinsic sugars from fruit, vegetables and<br />
milk, these are instead considered within the overall<br />
guidance to consume 45–60% of energy from carbohydrates.<br />
However, apart from when dealing with primary food<br />
groups such as fruits, vegetables and milk, it can be difficult<br />
to identify the source of sugars in foods, particularly in<br />
products composed of multiple ingredients. Furthermore<br />
nutrition labels only state values for total sugars, and it is<br />
perceived as overly complex to include a division between<br />
intrinsic and free sugars. This poses a problem for the<br />
nutrient signposting and claims relating to sugar content. A<br />
practical solution has been proposed that establishes a high<br />
criteria for claim purposes based on the guidelines on free (or<br />
added) sugars (50 g for a 2000 kcal diet), but incorporating<br />
a small allowance (that is, 10 g) for the average consumption<br />
of intrinsic and milk sugars consumed from manufactured<br />
foods (FSA, 2006). This would allow the food labelling for<br />
total sugars to be used in the nutritional signposting of<br />
manufactured foods. This is a pragmatic approach that is<br />
consistent with the dietary guidelines for a selective restriction<br />
of free sugars without the reliance on an analytical<br />
distinction between intrinsic and free (or added) sugars,<br />
which has proved difficult for routine labelling purposes.<br />
Starch and whole grains<br />
Starch has been presented as a preferable source of carbohydrate<br />
to sugars. In reality this is an oversimplification, and
similar to the situation with sugars, the food source of starch<br />
needs to be considered when evaluating nutritional properties.<br />
A considerable amount of starch is consumed as refined<br />
cereal products where the germ and bran fractions have been<br />
lost along with the majority of the associated micronutrients<br />
and phytochemicials. This results in a lower nutrient/energy<br />
ratio for many refined cereal products when compared with<br />
their whole grain counterparts. Furthermore, the physicochemical<br />
characteristics of starch are very dependent on the<br />
biological origin and degree of processing, affecting both the<br />
rate and extent of digestion in the small intestine.<br />
The consequence is that in isolation, a value for the total<br />
starch content in foods or diets is not necessarily very<br />
informative about the functional attributes of a carbohydrate<br />
food. Information on dietary fibre defined as ‘intrinsic plant<br />
cell-wall polysaccharides’ will help identify whether the<br />
starch is associated with refined or whole grain material, and<br />
the detailed profile of the carbohydrate-release characteristics<br />
will indicate the likely gastrointestinal and metabolic<br />
fate of the carbohydrate food.<br />
Glycaemic index<br />
The GI concept has provided insight into the physiological<br />
properties of carbohydrate containing foods, which are not<br />
apparent from chemical composition alone. This physiological<br />
ranking is often presented as a description of carbohydrate<br />
quality, and it is therefore appropriate to consider<br />
how the GI integrates with the overall strategy of characterizing<br />
the functionality of dietary carbohydrates.<br />
In addition to the rate of carbohydrate digestion, other<br />
food-mediated effects on both gastrointestinal events and<br />
postabsorptive metabolism can influence the GI. Therefore,<br />
GI values do not represent a direct measure of carbohydrate<br />
absorption from the small intestine, but rather reflect the<br />
combined effect of all the properties of a food or meal that<br />
influence the rate of influx and removal of glucose from the<br />
circulation. However, the different mechanisms responsible<br />
for changes in the glycaemic response to a food or meal<br />
cannot be considered equally beneficial to health. For<br />
instance, it would be inappropriate to promote a food as<br />
low GI if the underlying mechanisms responsible were either<br />
high contents of fat or fructose. In such cases, any<br />
potentially detrimental nutritional attributes should take<br />
precedence over the physiological GI characteristic of the<br />
food or meal. Therefore, the GI measure should be applied<br />
only to foods with a high carbohydrate content, and there<br />
should be an overall consideration of the food and meal<br />
characteristics. The in vitro carbohydrate-release profiles,<br />
such as the measures of rapidly and slowly available glucose,<br />
can specifically identify the low GI products that are rich in<br />
slow-release carbohydrates, which have demonstrated health<br />
benefits.<br />
As the GI measurement relates to the available carbohydrate<br />
component of foods, it is appropriate to calculate<br />
the portion sizes of test meals based on direct determinations<br />
Nutritional characterization and measurement of dietary carbohydrates<br />
K Englyst et al<br />
of available carbohydrate, thereby reducing this aspect of<br />
GI measurement uncertainty and ensuring that resistant<br />
carbohydrates are not mistakenly included. The accompanying<br />
paper on GI addresses further issues relating to the<br />
determination and application of this physiological measure<br />
(Venn and Green, 2007).<br />
Dietary fibre and other resistant carbohydrates<br />
There has been considerable interest in the development and<br />
marketing of a number of resistant carbohydrates including<br />
polysaccharides (for example, retrograded and modified<br />
resistant starches, modified celluloses), oligosaccharides (for<br />
example, fructooligosaccharides, polydextrose and resistant<br />
maltodextrins) and sugars (for example, polyols and lactulose).<br />
As discussed earlier there has been debate about<br />
whether some or any of these materials should be encompassed<br />
within a dietary fibre term (that is, indigestibility<br />
approach), or whether they should be considered separately<br />
(that is, plant-rich diet approach). This debate is of<br />
considerable importance, as it impacts directly on the<br />
rationale for dietary fibre and on how different resistant<br />
carbohydrates can be managed from a public health<br />
perspective.<br />
By the plant-rich diet approach, the definition very<br />
effectively supports the existing dietary guidelines to consume<br />
fruits, vegetables and whole grains. Likewise, this<br />
approach is consistent with the evidence base on which<br />
population reference intake values have been established.<br />
This need to differentiate between dietary fibre intrinsic to<br />
plant foods, and added preparations was also recognized by<br />
US academy of sciences (IOM, 2001).<br />
By the indigestibility approach, the inclusion of materials<br />
other than ‘intrinsic plant cell wall polysaccharides’ as<br />
dietary fibre could adversely impact on the guidelines to<br />
consume fibre from plant foods, and it could be wrongly<br />
interpreted as inferring that the evidence for the benefit of<br />
the plant-rich diet can be extrapolated to these other<br />
substances. This issue is currently very pertinent, as although<br />
dietary guidelines are to consume at least five portions<br />
of fruit and vegetable and three or more portions of<br />
whole grains daily, average intakes are far lower in some<br />
populations. As a consequence, the average dietary fibre<br />
intakes are also less than the population reference values,<br />
and this has been represented by some as a ‘fibre gap’ that<br />
could be met through supplementation with other substances.<br />
However, this would be a fundamental misinterpretation<br />
of the evidence base for a fibre rich diet being<br />
beneficial to health and would potentially mislead the public<br />
in their selection of this diet.<br />
As only intrinsic plant cell wall polysaccharides are<br />
included within the plant-rich diet definition, other sources<br />
of resistant carbohydrates would need to be described<br />
separately for labelling and nutrition claims purposes. Of<br />
course, it would only be necessary and appropriate to include<br />
additional categories such as resistant oligosaccharides or<br />
S35<br />
European Journal of Clinical Nutrition
S36<br />
resistant starch on nutrition labels if they were shown to be<br />
of sufficient relevance to public health.<br />
The nutrition labelling of separate categories of resistant<br />
carbohydrates represents an opportunity for industry to<br />
stimulate product innovation through the development<br />
and promotion of functional ingredients based on their<br />
specific physiological properties. This would most<br />
appropriately take the form of health claims, for which<br />
there is established legislation to ensure that these substances<br />
are suitably evaluated and controlled (for example,<br />
European Commission Regulation EC No 1924/2006). The<br />
diversity in physiological attributes between different<br />
functional ingredients, and the variation in the quantities<br />
required to produce the nutritional or physiological effects,<br />
makes it unfeasible to group all these substances under a<br />
single set of conditions for nutrition or health claims.<br />
Dietary recommendations and labelling<br />
Food-based dietary guidelines have traditionally been the<br />
most effective approach to the public communication of<br />
nutrition. For carbohydrates, this is simply conveyed by the<br />
promotion of fruit, vegetable and whole grain consumption.<br />
However, the increasing predominance of manufactured<br />
products necessitates additional strategies that address the<br />
varied functional properties of these processed foods, thereby<br />
allowing either beneficial or potentially adverse attributes<br />
to be distinguished. Such functional parameters should<br />
reflect nutritional aspects of different types of ingredients<br />
and specific carbohydrate components, as well as any effects<br />
of processing on the overall food characteristics. These<br />
principles form the basis of the classification and measurement<br />
scheme for dietary carbohydrates presented in Table 1,<br />
which can be applied as a tool for further research into the<br />
link between dietary carbohydrates and health.<br />
Recommendations<br />
1. Food-based guidelines promoting the consumption of<br />
fruits, vegetables and whole grains are some of the most<br />
effective public health messages. Carbohydrate classification<br />
and measurements should support these dietary<br />
guidelines and provide the means with which to describe<br />
the component ingredients and functional properties of<br />
foods, including those attributed to the food matrix.<br />
2. For energy calculation purposes, there is a need to<br />
describe carbohydrates in terms of their gastrointestinal<br />
and metabolic fate, as ‘available’, which provide carbohydrate<br />
for metabolism, and as ‘resistant’, which resist<br />
digestion in the small intestine or are poorly absorbed/<br />
metabolized. These categories should be further subdivided<br />
into types describing attributes of specific nutritional and<br />
functional relevance.<br />
3. There should be a commitment to move away from<br />
empirical based methods that measure unspecified materials,<br />
European Journal of Clinical Nutrition<br />
Nutritional characterization and measurement of dietary carbohydrates<br />
K Englyst et al<br />
towards rational methods providing direct and specific<br />
measurement of different types and categories of carbohydrates<br />
as their chemically identified components.<br />
4. The selective restriction of free or added sugars is a useful<br />
food-based guideline. To support this, nutrition claims<br />
relating to the content of sugars in manufactured<br />
products should be provided in the context of the<br />
established maximum intake limit of free sugars (10% of<br />
energy), but with an additional small allowance for the<br />
intrinsic sugars provided by manufactured food groups.<br />
This allows the content of total sugars to be used for<br />
claims purposes and overcomes the need to distinguish<br />
between intrinsic and free sugars on nutrition labels. This<br />
effectively targets the restriction of free or added sugars,<br />
without adversely influencing intakes of fruits, vegetables<br />
or milk.<br />
5. The GI and glycaemic load are useful nutritional terms<br />
providing insight into a physiological parameter that is<br />
not always apparent from chemical composition alone.<br />
Its application should be limited to foods with high<br />
carbohydrate contents and is most effectively interpreted<br />
in conjunction with information on other food/meal<br />
characteristics including detailed sugar composition and<br />
starch digestibility profiles.<br />
6. Dietary fibre should be considered as a public health term<br />
supporting dietary guidelines to consume a plant-rich<br />
diet. The definition ‘intrinsic plant cell wall polysaccharides’<br />
provides the only consistent link with the scientific<br />
evidence on which these guidelines are based. The<br />
physiological characteristic of indigestibility is therefore<br />
not considered to be an adequate basis for the definition<br />
of dietary fibre.<br />
7. Resistant carbohydrates other than dietary fibre should be<br />
considered separately and by their own merits. Distinct<br />
categories are essential for functional ingredients to be<br />
managed effectively from a public health perspective. As<br />
there is the potential for large amounts of added resistant<br />
carbohydrates to be consumed, safe upper intake limits<br />
may need to be established.<br />
Acknowledgements<br />
We wish to thank Professor Nils-Georg Asp, Professor John H<br />
Cummings, Professor Timothy Key, Professor Jim Mann,<br />
Professor HH Vorster and Dr Roger Wood for the valuable<br />
comments they provided on the earlier manuscript.<br />
Conflict of interest<br />
During the preparation and peer-review of this paper in<br />
2006, the authors and peer-reviewers declared the following<br />
interests.<br />
Authors<br />
Dr Klaus Englyst: Director and share-holder in Englyst<br />
Carbohydrates Ltd which is a small research-oriented
company working on dietary carbohydrates and health. The<br />
UK Food Standards Agency is the main research partner and<br />
sponsor. In addition, Englyst Carbohydrates provide analytical<br />
assistance to universities and food industry worldwide,<br />
albeit on a small scale. The complete independence of<br />
Englyst Carbohydrates is maintained by not entering into<br />
any consultancy agreement.<br />
Professor Simin Liu: Member of the Scientific advisory<br />
board for the EU Health Grain Project.<br />
Dr Hans Englyst: Director and share-holder in Englyst<br />
Carbohydrates Ltd which is a small research-oriented<br />
company working on dietary carbohydrates and health.<br />
The UK Food Standards Agency is the main research partner<br />
and sponsor. In addition, Englyst Carbohydrates provide<br />
analytical assistance to universities and food industry worldwide,<br />
albeit on a small scale. The complete independence of<br />
Englyst Carbohydrates is maintained by not entering into<br />
any consultancy agreement.<br />
Peer-reviewers<br />
Professor Nils-Georg Asp: On part-time leave from university<br />
professorship to be the Director of the Swedish<br />
Nutrition Foundation (SNF), a nongovernmental organization<br />
for the promotion of nutrition research and its practical<br />
implications. SNF is supported broadly by the food sector;<br />
the member organizations and industries are listed on the<br />
SNF home page (www.snf.ideon.se).<br />
Professor John H Cummings: Chairman, Biotherapeutics<br />
Committee, Danone; Member, Working Group on Foods<br />
with Health Benefits, Danone; funding for research work at<br />
the University of Dundee, ORAFTI (2004).<br />
Professor Timothy Key: None declared.<br />
Professor Jim Mann: None declared.<br />
Professor HH Vorster: Member and Director of the Africa<br />
Unit for Transdisciplinary health Research (AUTHeR), Research<br />
grant from the South African Sugar Association<br />
Dr Roger Wood: None declared.<br />
References<br />
Abrams SA, Griffin IJ, Hawthorne KM, Liang L, Gunn SK, Darlington<br />
G et al. (2005). A combination of prebiotic short- and long-chain<br />
inulin-type fructans enhances calcium absorption and bone<br />
mineralization in young adolescents. Am J Clin Nutr 82, 471–476.<br />
Alberts DS, Martinez ME, Roe DJ, Guillen-Rodriguez JM, Marshall JR,<br />
van Leeuwen JB et al. (2000). Lack of effect of a high-fiber cereal<br />
supplement on the recurrence of colorectal adenomas. N Engl J<br />
Med 342, 1156–1162.<br />
American Association of Cereal Chemists (2001). The definition of<br />
dietary fiber. Cereal Foods World 46, 112–126.<br />
AOAC (2005). Official Methods of Analysis 18th Ed W Horwitz. AOAC<br />
International: Gaithersburg, MD, USA.<br />
Bazzano LA, He J, Ogden LG, Loria CM, Whelton PK (2003). Dietary<br />
fiber intake and reduced risk of coronary heart disease in US men<br />
and women. The National Health and Nutrition Examination<br />
Survey I Epidemiologic Follow-up Study. Arch Intern Med 163,<br />
1897–1904.<br />
Nutritional characterization and measurement of dietary carbohydrates<br />
K Englyst et al<br />
Bazzano LA, Serdula M, Liu S (2005). Prevention of type 2 diabetes by<br />
diet and lifestyle modification. J Am Coll Nutr 24, 310–319.<br />
Bingham SA, Day NE, Luben R, Ferrari P, Slimani N, Norat T et al.<br />
(2003). Dietary fibre in food and protection against colorectal<br />
cancer in the European Prospective Investigation into Cancer and<br />
Nutrition (EPIC): an observational study. Lancet 361, 1496–1501.<br />
Bonithon-Kopp C, Kronborg O, Giacosa A, Rath U, Faivre J (2000).<br />
Calcium and fibre supplementation in prevention of colorectal<br />
adenoma recurrence: a randomised intervention trial. European<br />
Cancer Prevention Organisation Study Group. Lancet 356,<br />
1300–1306.<br />
Brand-Miller J, Hayne S, Petocz P, Colagiuri S (2003). Low-glycemic<br />
index diets in the management of diabetes: a meta-analysis of<br />
randomized controlled trials. Diabetes Care 26, 2466–2468.<br />
Burkitt DP (1969). Related disease—related cause? Lancet ii,<br />
1229–1231.<br />
Burn J, Katheuser A, Fodde R, Coaker J, Chapman PD, Mathers JC<br />
(1996). Intestinal tumours in the Apc 1638N mouse: aspirin not<br />
protective and resistant starch increases small bowel tumours. Eur<br />
J Hum Genet 4 (Suppl 1), 13.<br />
Champ MM, Langkilde A-M, Brouns F, Kettlitz B, Bail-Collet YL<br />
(2003). Advances in dietary fibre characterization. 2. Consumption,<br />
chemistry, physiology and measurement of resistant starch;<br />
implications for health and food labelling. Nutr Res Rev 16, 143–161.<br />
Daly M (2003). Sugars, insulin sensitivity, and the postprandial state.<br />
Am J Clin Nutr 78, 865S–872S.<br />
Department of Health (1991). Dietary reference values for food energy<br />
and nutrients for the United Kingdom. Report on Health and Social<br />
41. London.<br />
Elia M, Cummings JH (2007). Physiological aspects of energy<br />
metabolism and gastrointestinal effects of carbohydrates. Eur J<br />
Clin Nutr.<br />
Ellis PR, Rayment P, Wang Q (1996). A physico-chemical perspective<br />
of plant polysaccharides in relation to glucose absorption, insulin<br />
secretion and the entero-insular axis. Proc Nutr Soc 55, 881–898.<br />
Englyst HN, Cummings JH (1985). Digestion of the polysaccharides<br />
of some cereal foods in the human small intestine. Am J Clin Nutr<br />
42, 778–787.<br />
Englyst HN, Cummings JH (1986). Digestion of the carbohydrates of<br />
banana (Musa paradisiaca sapientum) in the human small<br />
intestine. Am J Clin Nutr 44, 42–50.<br />
Englyst HN, Cummings JH (1987). Digestion of the polysaccharides<br />
of potato in the small intestine of man. Am J Clin Nutr 45, 423–431.<br />
Englyst HN, Hudson GJ (1996). The classification and measurement<br />
of dietary carbohydrates. Food Chem 57, 15–21.<br />
Englyst HN, Kingman SM, Cummings JH (1992). Classification and<br />
measurement of nutritionally important starch fractions. Eur J Clin<br />
Nutr 46, S33–S50.<br />
Englyst HN, Quigley ME, Hudson GJ (1994). Determination of<br />
dietary fiber as non-starch polysaccharides with gas–liquid<br />
chromatographic, high-performance liquid chromatographic or<br />
spectrophotometric measurement of constituent sugars. Analyst<br />
119, 1497–1509.<br />
Englyst HN, Quigley ME, Englyst KN, Bravo L, Hudson GJ (1996).<br />
Dietary fibre. Measurement by the Englyst NSP procedure.<br />
Measurement by the AOAC procedure. Explanation of the<br />
differences. J Assoc Pub Anal 32, 1–52.<br />
Englyst HN, Wiggins HS, Cummings JH (1982). Determination of the<br />
non-starch polysaccharides in plant foods by gas–liquid chromatography<br />
of constituent sugars as alditol acetates. Analyst 107,<br />
307–318.<br />
Englyst KN, Englyst HN (2005). Carbohydrate bioavailability. Brit J<br />
Nutr 94, 1–11.<br />
Englyst KN, Englyst HN, Hudson GJ, Cole TJ, Cummings JH (1999).<br />
Rapidly available glucose in foods. An in vitro measurement that<br />
reflects the glycemic response. Am J Clin Nutr 69, 448–454.<br />
Englyst KN, Vinoy S, Englyst HN, Lang V (2003). Glycaemic index of<br />
cereal products explained by their content of rapidly and slowly<br />
available glucose. Br J Nutr 89, 329–339.<br />
S37<br />
European Journal of Clinical Nutrition
S38<br />
Nutritional characterization and measurement of dietary carbohydrates<br />
K Englyst et al<br />
FAO (2003). Food energy—methods of analysis and conversion<br />
factors. Report of a technical workshop. Rome 2002. FAO Food and<br />
Nutrition Paper 77.<br />
FDA (2000). Docket No. 91N-0098. Letter regarding dietary supplement<br />
health claim for fiber with respect to colorectal cancer (US<br />
food and drug administration center for food safety and applied<br />
nutrition office of nutritional products, labeling, and dietary<br />
supplements October 10, 2000).<br />
Fried SK, Rao SP (2003). Sugars, hypertriglyceridemia, and cardiovascular<br />
disease. Am J Clin Nutr 78, 873S–880S.<br />
FSA (2006). Rationale and discussion of the 15 g high sugars criterion<br />
within the FSA signposting scheme. http://www.food.gov.uk/<br />
foodlabelling/signposting/ signposttimeline/rationalesugars/.<br />
Goodlad RA (2007). Fiber can make your gut grow. Nutrition 23,<br />
434–435.<br />
Gostner A, Blaut M, Schäffer V, Kozianowski G, Theis S, Klingeberg M<br />
et al. (2006). Effect of isomalt consumption on faecal microflora<br />
and colonic metabolism in healthy volunteers. Brit J Nutr 95,40–50.<br />
Gross LS, Li L, Ford ES, Liu S (2004). Increased consumption of<br />
refined carbohydrates and the epidemic of type 2 diabetes in the<br />
United States: an ecologic assessment. Am J Clin Nutr 79, 774–779.<br />
Gudmand-Hoyer E (1994). The clinical significance of disaccharide<br />
maldigestion. Am J Clin Nutr 59, 735S–741S.<br />
Institute of Medicine (2001). Dietary Reference Intakes: Proposed<br />
Definition of Dietary Fiber. The National Acadamies Press:<br />
Washington.<br />
Institute of Medicine (2002). Dietary Reference Intakes for Energy,<br />
Carbohydrate, Fiber, Fat, Fatty Acids, Cholesterol, Protein, and Amino<br />
Acids (macronutrients). The National Academies Press: Washington.<br />
Jacobs DR, Meyer KA, Kushi LH, Folsom AR (1998). Whole-grain<br />
intake may reduce the risk of ischemic heart disease death in<br />
postmenopausal women: the Iowa Women’s Health Study. Am J<br />
Clin Nutr 68, 248–257.<br />
Jenkins DJ, Kendall CW, Augustin LS, Franceschi S, Hamidi M,<br />
Marchie A et al. (2002). Glycemic index: overview of implications<br />
in health and disease. Am J Clin Nutr 76, S266–S273.<br />
Liu S (2002). Intake of refined carbohydrates and whole grain foods<br />
in relation to risk of type 2 diabetes mellitus and coronary heart<br />
disease. J Am Coll Nutr 21, 298–306.<br />
Liu S, Lee IM, Ajani U, Cole SR, Buring JE, Manson JE (2001). Intake<br />
of vegetables rich in carotenoids and risk of coronary heart disease<br />
in men: the physicians’ health study. Int J Epidemiol 30, 130–135.<br />
Liu S, Manson J, Lee I, Cole S, Willett W, Buring J (2000b). Fruit and<br />
vegetable intake and risk of cardiovascular disease: the women’s<br />
health study. Am J Clin Nutr 72, 922–928.<br />
Liu S, Manson JE, Stampfer MJ, Hu FB, Giovannucci E, Colditz GA<br />
et al. (2000a). A prospective study of whole-grain intake and risk of type<br />
2 diabetes mellitus in US women. Am J Public Health 90, 1409–1415.<br />
Liu S, Willett WC, Manson JE, Hu FB, Rosner B, Colditz GA (2003).<br />
Relation between changes in intakes of dietary fiber and grain<br />
products and changes in weight and development of obesity<br />
among middle-aged women. J Am Coll Nutr 78, 920–927.<br />
Liu SM, Stampfer MJ, Hu FB, Giovannucci E, Rimm E, Manson JE<br />
et al. (1999). Whole-grain consumption and risk of coronary heart<br />
disease: results from the Nurses’ Health Study. Am J Clin Nutr 70,<br />
412–419.<br />
Livesey G (2003). Health potential of polyols as sugar replacers, with<br />
emphasis on low glycaemic properties. Nutr Res Rev 16, 163–191.<br />
Macfarlane S, Macfarlane GT, Cummings JH (2006). Prebiotics in the<br />
gastrointestinal tract. Aliment Pharmacol Ther 24, 701–714.<br />
McCance RA, Lawrence RD (1929). The Carbohydrate Content of Foods.<br />
MRC Special Report. HMSO: London.<br />
McCleary BV, Murphy A, Mugford DC (2000). Measurement of total<br />
fructan in foods by enzymatic/spectrophotometric method:<br />
collaborative study. J AOAC Int 83, 356–364.<br />
Park Y, Hunter DJ, Spiegelman D, Bergkvist L, Berrino F, van den<br />
Brandt PA et al. (2005). Dietary fiber intake and risk of colorectal<br />
cancer: a pooled analysis of prospective cohort studies. JAMA 294,<br />
2849–2857.<br />
European Journal of Clinical Nutrition<br />
Pehrsson PR, Cutrufelli RL, Gebhardt SE, Lemar LE, Holcomb GT,<br />
Haytowitz DB et al. (2005). USDA database for the added sugars<br />
content of selected foods. www.ars.usda.gov/nutrientdata.<br />
Pendlington AW, Meuree-Vanlaethem N, Brookes A (1996). The<br />
Method Specific Certification of the Mass Fraction of Dietary Fibre in<br />
Lyophilised Haricot Beans, Carrot, Apple, Full Fat Soya Flour and Bran<br />
Breakfast Cereal Reference Materials. CRMs 514, 515, 516, 517 & 518.<br />
Office for Official Publications of the European Communities:<br />
Luxembourg.<br />
Pietinen P, Rimm EB, Korhonen P, Hartman AM, Willett WC,<br />
Albanes D et al. (1996). Intake of dietary fiber and risk of coronary<br />
heart disease in a cohort of Finnish men. The Alpha-Tocopherol,<br />
Beta-Carotene Cancer Prevention Study. Circulation 94, 2720–2727.<br />
Quigley ME, Hudson GJ, Englyst HN (1999). Determination of<br />
resistant short-chain carbohydrates (non-digestible oligosaccharides)<br />
using gas-liquid chromatography. Food Chem 65, 381–390.<br />
Rabe E (1999). Effect of processing on dietary fiber in foods. In: Cho<br />
SS, Prosky L, Dreher, M (eds). Complex carbohydrates in foods.<br />
Marcel Dekker, Ink: NewYork, Basel. pp 395–409.<br />
Ranhotra GS, Gelroth JA, Eisenbraun GJ (1991). High-fiber white<br />
flour and its use in cookie products. Cereal Chem 68, 432–433.<br />
Rimm EB, Ascherio A, Giovannucci E, Spiegelman D, Stampfer MJ,<br />
Willett WC (1996). Vegetable, fruit, and cereal fiber intake and risk<br />
of coronary heart disease among men. JAMA 275, 447–451.<br />
Rissanen TH, Voutilainen S, Virtanen JK, Venho B, Vanharanta M,<br />
Mursu J et al. (2003). Low intake of fruits and berries and<br />
vegetables is associated with excess mortality in men; the Kupio<br />
Ischaemic Heart Disease Risk Factor (KIHD) Study. Am Soc Nutr Sci<br />
133, 199–204.<br />
Roberfroid MB (2005). Introducing inulin-type fructans. Br J Nutr 93<br />
(Suppl 1), S13–S25.<br />
Rumessen JJ (1992). Hydrogen and methane tests for evaluation of<br />
resistant carbohydrates. Eur J Clin Nutr 46 (Suppl 2), S77–S90.<br />
Sengupta S, Muir JG, Gibson PR (2006). Does butyrate protect from<br />
colorectal cancer? J Gastroenterol Hepatol 21, 209–218.<br />
Silvester KR, Englyst HN, Cummings JH (1995). Ileal recovery of<br />
starch from whole diets containing resistant starch measured in<br />
vitro and fermentation of ileal effluent. Am J Clin Nutr 62, 403–411.<br />
Slavin J (2003). Why whole grains are protective: biological<br />
mechanisms. Proc Nutr Soc 62, 129–134.<br />
Southgate DAT (1969). Determination of carbohydrates in foods. II.<br />
Unavailable carbohydrates. J Sci Food Agric 20, 331–335.<br />
Southgate DAT, Englyst HN (1985). Dietary fibre: chemisty, physical<br />
properties and analysis. In: Trowell H, Burkitt D, Heaton K (eds).<br />
Dietary fibre, fibre depleated foods and disease. Academic Press:<br />
London.<br />
Steffen LM, Jacobs DR, Stevens J (2003). Associations of whole-grain,<br />
refined-grain, and fruit and vegetable consumption with risks of<br />
all-cause mortality and incident coronary artery disease and<br />
ischemic stroke: the Atherosclerosis Risk in Communities (ARIC)<br />
Study. Am J Clin Nutr 78, 383–390.<br />
Theander O, Westerlund E (1993). Determination of individual<br />
components of dietary fiber. In: Spiller GA (ed). CRC Handbook of<br />
Dietary Fiber in Human Nutrition. pp 77–98. CRC Press Inc: Boca<br />
Raton, FL.<br />
Trowell H (1972). Crude fibre, dietary fibre and atherosclerosis.<br />
Atherosclerosis 16, 138–140.<br />
Trowell H, Burkitt D, Heaton K (1985). Editors of Dietary Fibre, Fibredepleted<br />
Foods and Disease. Academic Press: London.<br />
Tuohy KM, Hinton DJ, Davies SJ, Crabbe MJ, Gibson GR, Ames JM<br />
(2006). Metabolism of Maillard reaction products by the human<br />
gut microbiota—implications for health. Mol Nutr Food Res 50,<br />
847–857.<br />
USDA/DHHS (2005). Nutrition and Your Health: Dietary Guidelines for<br />
Americans. DHHS: Washington, DC.<br />
van Dam RM, Rimm EB, Willett WC, Stampfer MJ, Hu FB (2002).<br />
Dietary patterns and risk for type 2 diabetes mellitus in US men.<br />
Annals of Internal Medicine 136, 201–209.
van Dam RM, Seidell JC (2007). Carbohydrate intake and obesity.<br />
Eur J Clin Nutr.<br />
van den Heuvel EG, Muijs T, Van Dokkum W, Schaafsma G (1999).<br />
Lactulose stimulates calcium absorption in postmenopausal<br />
women. J Bone Miner Res 14, 1211–1216.<br />
Venn BJ, Green TJ (2007). Glycemic index and glycemic load:<br />
measurement issues and their effect on diet–disease relationships.<br />
Eur J Clin Nutr.<br />
Vinjamoori DV, Byrum JR, Hayes T, Das PK (2004). Challenges<br />
and opportunities in the analysis of raffinose oligosaccharides,<br />
pentosans, phytate, and glucosinolates. J Anim Sci 82,<br />
319–328.<br />
Wacker M, Wanek P, Eder E, Hylla S, Gostner A, Scheppach W (2002).<br />
Effect of enzyme-resistant starch on formation of 1,N(2)-propanodeoxyguanosine<br />
adducts of trans-4-hydroxy-2-nonenal and cell<br />
proliferation in the colonic mucosa of healthy volunteers. Cancer<br />
Epidemiol Biomarkers Prev 11, 915–920.<br />
Nutritional characterization and measurement of dietary carbohydrates<br />
K Englyst et al<br />
Wasan HS, Goodlad RA (1996). Fibre-supplemented foods may<br />
damage your health. Lancet 348, 319–320.<br />
WHO Technical report series 916 (2003). Diet Nutrition and the<br />
Prevention of Chronic Disease. WHO: Geneva.<br />
Willett W, Manson J, Liu S (2002). Glycemic index, glycemic load,<br />
and risk of type 2 diabetes. Am J Clin Nutr 76, S274–S280.<br />
Wolk A, Manson JE, Stampfer MJ, Colditz GA, Hu FB, Speizer FE et al.<br />
(1999). Long-term intake of dietary fiber and decreased risk of<br />
coronary heart disease among women. JAMA 281, 1998–2004.<br />
Wong JM, de Souza R, Kendall CW, Emam A, Jenkins DJ (2006).<br />
Colonic health: fermentation and short chain fatty acids. J Clin<br />
Gastroenterol 40, 235–243.<br />
Wood R, Englyst HN, Southgate DAT, Cummings JH (1993).<br />
Determination of dietary fibre in foods—collaborative trials. IV.<br />
Comparison of Englyst GLC and colorimetric measurement with<br />
the Prosky procedure. J Assoc Pub Anal 29, 57–141.<br />
S39<br />
European Journal of Clinical Nutrition
REVIEW<br />
Physiological aspects of energy metabolism and<br />
gastrointestinal effects of carbohydrates<br />
M Elia 1 and JH Cummings 2<br />
1 2<br />
Institute of Human Nutrition, University of Southampton, Southampton, UK and Department of Pathology and Neuroscience,<br />
Ninewells Hospital and Medical School, Dundee, UK<br />
The energy values of carbohydrates continue to be debated. This is because of the use of different energy systems, for example,<br />
combustible, digestible, metabolizable, and so on. Furthermore, ingested macronutrients may not be fully available to tissues,<br />
and the tissues themselves may not be able fully to oxidize substrates made available to them. Therefore, for certain<br />
carbohydrates, the discrepancies between combustible energy (cEI), digestible energy (DE), metabolizable energy (ME) and net<br />
metabolizable energy (NME) may be considerable. Three food energy systems are in use in food tables and for food labelling in<br />
different world regions based on selective interpretation of the digestive physiology and metabolism of food carbohydrates. This<br />
is clearly unsatisfactory and confusing to the consumer. While it has been suggested that an enormous amount of work would<br />
have to be undertaken to change the current ME system into an NME system, the additional changes may not be as great as<br />
anticipated. In experimental work, carbohydrate is high in the macronutrient hierarchy of satiation. However, studies of eating<br />
behaviour indicate that it does not unconditionally depend on the oxidation of one nutrient, and argue against the operation of<br />
a simple carbohydrate oxidation or storage model of feeding behaviour to the exclusion of other macronutrients. The site, rate<br />
and extent of carbohydrate digestion in, and absorption from the gut are key to understanding the many roles of carbohydrate,<br />
although the concept of digestibility has different meanings. Within the nutrition community, the characteristic patterns of<br />
digestion that occur in the small (upper) vs large (lower) bowel are known to impact in contrasting ways on metabolism, while<br />
in the discussion of the energy value of foods, digestibility is defined as the proportion of combustible energy that is absorbed<br />
over the entire length of the gastrointestinal tract. Carbohydrates that reach the large bowel are fermented to short-chain fatty<br />
acids. The exact amounts and types of carbohydrate that reach the caecum are unknown, but are probably between 20 and<br />
40 g/day in countries with ‘westernized’ diets, whereas they may reach 50 g/day where traditional staples are largely cereal or<br />
diets are high in fruit and vegetables. Non-starch polysaccharides clearly affect bowel habit and so, to a lesser extent, does<br />
resistant starch. However, the short-chain carbohydrates, which are also found in breast milk, have little if any laxative role,<br />
although do effect the balance of the flora. This latter property has led to the term ‘prebiotic’, which is defined as the capacity to<br />
increase selectively the numbers of bifidobacteria and lactobacilli without growth of other genera. This now well-established<br />
physiological property has not so far led through to clear health benefits, but current studies are focused on their potential to<br />
prevent diarrhoeal illnesses, improve well-being and immunomodulation, particularly in atopic children and on increased<br />
calcium absorption.<br />
European Journal of Clinical Nutrition (2007) 61 (Suppl 1), S40–S74; doi:10.1038/sj.ejcn.1602938<br />
Keywords: carbohydrate; energy; short-chain fatty acids; glycaemic index; food labelling; prebiotic<br />
Introduction<br />
European Journal of Clinical Nutrition (2007) 61 (Suppl 1), S40–S74<br />
& 2007 Nature Publishing Group All rights reserved 0954-3007/07 $30.00<br />
www.nature.com/ejcn<br />
All organisms require fuels to maintain their life cycles. For<br />
humans, carbohydrates are the major fuels, typically<br />
accounting for 45–70% of the total energy intake and<br />
Correspondence: Professor M Elia, Institute of Human Nutrition, University of<br />
Southampton, Southampton General Hospital, MP 113 (F Level), Tremona Rd,<br />
Southampton SO16 6YD, UK.<br />
E-mail: elia@soton.ac.uk<br />
expenditure. Despite their importance in energy metabolism,<br />
the energy values of some carbohydrates continue to be<br />
debated and are confused due to the existence of different<br />
energy systems, which are not entirely consistent with each<br />
other (for example, combustible, digestible energy (DE),<br />
metabolizable energy (ME), net metabolizable energy<br />
(NME) systems; general and specific Atwater systems). The<br />
choice of energy system is of considerable importance<br />
because it not only affects the energy values of carbohydrates,<br />
but also those of fats, proteins and alcohol (FAO,
2003). In establishing the energy values of carbohydrates, it<br />
is not only necessary to consider their intrinsic physicochemical<br />
properties, but also their physiology, specifically,<br />
their digestibility, the end products of their metabolism and<br />
even the pathways by which they are metabolized. Since it is<br />
desirable to use the same energy system for all macronutrients,<br />
it is appropriate to consider at least briefly the energy<br />
values of carbohydrates, fats and proteins as a combined<br />
entity. Similarly, the role of carbohydrates in energy balance<br />
can only be adequately examined by considering the broader<br />
perspectives of energy homeostasis, which involve all<br />
macronutrients.<br />
The site of carbohydrate breakdown in the gut, the rate<br />
and extent of breakdown, and the kinetics of absorption are<br />
key to understanding many other roles that carbohydrate<br />
plays beyond providing energy. In the large bowel, dietary<br />
carbohydrate interacts with a rich and diverse microbiota<br />
that produce end products unique to the body. This process<br />
of fermentation affects bowel habit, transit time, mucosal<br />
health, and also provides products to the portal and systemic<br />
circulation, thus effecting metabolism both within and<br />
beyond the gut.<br />
In this paper, we have focused on areas where there has<br />
been progress since the 1997 consultation, or where there is<br />
substantial controversy. The implications for the glycaemic<br />
response and for conditions such as diabetes, obesity and<br />
cancer are dealt with in other papers in this expert review.<br />
The evidence reviewed is primarily from human studies.<br />
Energy values of carbohydrates and other<br />
macronutrients<br />
Figure 1, which is a modification of previous diagrams<br />
(Warwick and Baines, 2000; Livesey, 2001; FAO, 2003), shows<br />
the flow of energy through the body. It presents a conceptual<br />
framework for considering energy values of foods and<br />
individual macronutrients. The pathway begins with the<br />
combustible energy intake that depends on the physicochemical<br />
characteristics of ingested macronutrients, and not<br />
on physiological processes. There are then three subsequent<br />
consecutive steps, each of which depends on the previous<br />
one. Each of these depends on physiological processes:<br />
digestibility (relevant to DE), metabolizability (relevant to<br />
ME) and relative metabolic (bioenergetic) efficiency (relevant<br />
to NME). These are considered separately below.<br />
Combustible energy<br />
Combustible energy refers to the heat released during<br />
complete combustion of foodstuffs or macronutrients in<br />
the presence of O2, to yield CO 2 and H 2O. The heat of<br />
combustion of amino acids/protein is reported in various<br />
ways, for example with S being in elemental form, as SO 3,or<br />
H 2SO 4. In the comprehensive analysis provided by Elia and<br />
Livesey (1992), the end products are H 2O (liquid), CO 2 (gas),<br />
Physiological aspects of energy metabolism<br />
M Elia and JH Cummings<br />
Gains<br />
(Stored energy)<br />
Ingested energy (cIE)<br />
Digestible energy (DE)<br />
= cIE – cFE - cGaE<br />
Metabolisable energy (ME)<br />
= DE – cUE - cSE<br />
Net metabolisable energy<br />
(NME) = ME –Hine = kME<br />
Losses<br />
Faecal energy (cFE)<br />
Combustible gas (cGaE)<br />
Urinary energy (cUE)<br />
Surface energy (cSE)<br />
Heat due to bio-energetic<br />
inefficiency relative to<br />
glucose oxidation (Hine)<br />
Figure 1 Diagram showing the flow of energy through the body.<br />
The abbreviations cIE, cFE, cGaE and cSE refer to combustible intake<br />
energy (cIE), combustible faecal (cFE), gaseous (cGaE) and surface<br />
energy (cSE), respectively. H ine is the heat released as a result of<br />
metabolic inefficiency in performing metabolic and external work<br />
relative to glucose. The coefficient k reflects this metabolic efficiency.<br />
The equations shown in the diagram apply in states of nutrient<br />
balance. In situations where excess energy is deposited, metabolizable<br />
energy (ME) and net metabolizable energy (NME) of the diet<br />
includes the energy that would be made available through<br />
mobilization and oxidative metabolism of the stored energy.<br />
N 2 (gas) and H 2SO 4.115H 2O. Combustible energy has also<br />
been called the heat of combustion, gross energy, intake<br />
energy and energy intake. Since some of these terms can be<br />
confused with DE and ME intake, the term combustible<br />
intake of energy (cIE) will be used in this paper, because it is<br />
self-explanatory and less likely to be misinterpreted or<br />
confused with other terms.<br />
The combustible energy values for hexose-based carbohydrates<br />
(kJ/g) are generally between 15.5 and 17.5 kJ/g (less<br />
than 15% difference) (Table 1) (Livesey and Elia, 1988; Elia<br />
and Livesey, 1992), and are more than twofold lower than<br />
those of typical fats. Since carbohydrates are more oxidized<br />
than fats (their carbon skeletons are linked to relatively more<br />
oxygen and less hydrogen), they generate less heat than fat<br />
when fully combusted with oxygen. The variability in heat<br />
of combustion of different hexose-based carbohydrates (kJ/g)<br />
is almost entirely determined by the number of glycosidic<br />
bonds, the formation of which is associated with loss of one<br />
molecule of water (water of condensation) per glycosidic<br />
bond (Elia and Livesey, 1992). When the heat of combustion<br />
of hexose-based carbohydrates is expressed as monosaccharide<br />
equivalents, the values are very consistent with each<br />
other (B15.7 kJ/g, rounded to 16 kJ/g). The value for<br />
glycogen is only approximately 1.3% greater than that of<br />
glucose (Elia and Livesey, 1992), the difference being due to<br />
the heat released during the breakdown of the glycosidic<br />
bonds (in living organisms, this is achieved through<br />
enzymatic hydrolysis of glycosidic bonds (heat of hydrolysis).<br />
Glucose monohydrate is unusual in being hydrated<br />
S41<br />
European Journal of Clinical Nutrition
S42<br />
Table 1 The RQ (CO 2 production/O 2 consumption), combustible<br />
energy equivalents of CO 2 (cEeqCO 2)andO 2 (cEeqO 2), and the heat<br />
of combustion of the major macronutrients and specific carbohydrates a<br />
RQ EeqO 2 (kJ/l) EeqCO 2 (kJ/l) Heat of<br />
combustion (kJ/g)<br />
Macronutrients<br />
Carbohydrate 1.000 21.12 21.12 17.51<br />
Fat 0.710 19.61 27.62 39.42<br />
Protein 0.835 19.48 23.33 23.64<br />
Alcohol 0.667 20.33 30.49 29.68<br />
Specific carbohydrates<br />
Starch 1.000 21.12 21.12 17.48<br />
Glycogen 1.000 21.12 21.12 17.52<br />
Sucrose 1.000 20.97 20.97 16.48<br />
Maltose 1.000 20.99 20.99 16.49<br />
Lactose 1.000 21.00 21.00 16.50<br />
Glucose 1.000 20.84 20.84 15.56<br />
Galactose 1.000 20.84 20.84 15.56<br />
Fructose 1.000 20.91 20.91 15.61<br />
Glycerol 0.857 21.16 24.69 18.03<br />
Erythritol 0.889 20.91 23.53 17.27<br />
Xylitol 0.909 19.92 21.91 16.96<br />
Sorbitol 0.923 20.89 22.71 16.71<br />
Mannitol 0.923 20.89 22.71 16.71<br />
Maltitol 0.960 20.87 21.74 16.98<br />
Lactitol 0.960 20.87 21.74 16.98<br />
Isomalt 0.960 20.87 21.74 16.98<br />
Abbreviations: EeqCO2, energy equivalents of CO2; EeqO2, energy equivalents<br />
of O2; RQ, respiratory quotient.<br />
a The values are based on the characteristics of the nutrients and are<br />
independent of whether they are endogenous or exogenous or whether they<br />
are given orally or intravenously. Based on Elia and Livesey (1992) and<br />
unpublished data.<br />
and having a low-energy density (14.1 kJ/g), but when<br />
expressed as anhydrous glucose, the value becomes 15.6 kJ/g.<br />
The heat of combustion of polyols (alcohol derivatives of<br />
sugars), as for other carbohydrates, depends on their<br />
composition and number of glycosidic linkages. For many<br />
the values are B17.0 kJ/g (for example, 16.70–17.2 kJ/g for<br />
erythritol, isomalt, lactitol, maltitol, mannitol, sorbitol,<br />
xylitol) (Elia and Livesey, 1992; Livesey, 1992). Glycerol<br />
(triol), which is also a polyol, has a relatively high heat of<br />
combustion (18 kJ/g). The values for polysaccharides that<br />
reach the colon do not differ substantially from those for<br />
starch or glycogen (for example, 17.5 kJ/g for guar gum and<br />
solka-floc cellulose, 17.2 kJ/g for pectin, but as low as 15.5 kJ/<br />
g for psyllum gum and as high as 17.6 kJ/g for sugar beet<br />
fibre) (Livesey, 1992; Livesey and Elia, 1995). The mean<br />
values for non-starch polysaccharides (NSP) in cereals have<br />
been reported to be 17.5 (range 16.6–18.5) kJ/g, vegetables,<br />
16.8 (range 16.6–17.9) kJ/g, and fruits 16.5 (range 14.9–<br />
17.3) kJ/g. Hydroxyl-propylmethyl cellulose, a chemically<br />
modified NSP, has a particularly high heat of combustion<br />
(22.0 kJ/g), which is due to the high heat of formation of the<br />
substituted side chains. The values for oligosaccharides, such<br />
as polydextrose, polyfructose and soya bean oligosaccharides<br />
are between 16.8 and 17.0 kJ/g. It is estimated that the<br />
European Journal of Clinical Nutrition<br />
Physiological aspects of energy metabolism<br />
M Elia and JH Cummings<br />
average combustible energy of NSP in mixed conventional<br />
diets is approximately 17.0 kJ/g, compared to 15.7 kJ/g for<br />
carbohydrates (as monosaccharide equivalents) that are<br />
absorbed by the small bowel (‘available carbohydrates’).<br />
The principles of thermodynamics imply that the heat<br />
released when carbohydrates are completely combusted in a<br />
bomb calorimeter in the presence of oxygen is the same as<br />
when the same quantity of carbohydrate is fully oxidized to<br />
H2O and CO 2 by living organisms through a large series of<br />
metabolic steps. However, ingested macronutrients may not<br />
be made fully available to tissues, and the tissues themselves<br />
may not be able to fully oxidize substrates made available to<br />
them. Therefore, for certain carbohydrates, the discrepancies<br />
between combustible energy (cEI), DE, ME and NME may be<br />
considerable.<br />
Digestible energy<br />
It is obvious that substances that are not absorbed cannot be<br />
metabolized by human tissues. For the purposes of energy<br />
metabolism, digestibility is defined as the proportion of<br />
combustible energy that is absorbed over the entire length of<br />
the gastrointestinal tract. DE (DE ¼ cIE digestibility) is<br />
estimated as the difference between the combustible energy<br />
present in ingested food and that present in faeces<br />
( þ combustible gases, such as H2 and CH 4 which are<br />
excreted).<br />
DE ¼ cIE cFE cGaE<br />
The ‘c’ in cIE (combustible intake energy), cFE (combustible<br />
faecal energy) and cGaE (combustible gaseous energy)<br />
indicates that it is the heat of combustion that is being<br />
considered, thus avoiding confusion with DE, ME and NME<br />
values. DE is actually an ‘apparent’ energy value, because the<br />
flux of nutrients into and out of the colon is not unidirectional.<br />
For example, mucus is secreted into the large bowel<br />
(estimated to be 2–3 g/day, but in certain diseases affecting<br />
the large intestine, the amount may be considerably more).<br />
In addition, desquamated colonic cells are shed directly into<br />
the lumen of the colon, which may also receive desquamated<br />
cells from the small intestine. Some of the energy from these<br />
sources, which is not present in the diet, may be lost to<br />
faeces, reducing the apparent digestibility of the diet.<br />
Another problem concerns loss of energy in the form of<br />
combustible gaseous products (flatus þ breath), which was<br />
neglected in early human studies. The result is that DE intake<br />
was slightly overestimated. However, this omission makes<br />
very little overall difference to DE intake because a relatively<br />
small amount of energy is lost in this way in humans. Whole<br />
body calorimetry studies over 24 h in healthy subjects have<br />
measured the excretion of H2 and CH 4 (via flatus and breath)<br />
and found it to be small (usually o1 l/day) (Poppitt et al.,<br />
1996; King et al., 1998), with variable and sometimes an<br />
inverse relationship between H2 and CH 4 excretion. This<br />
may correspond, very approximately, to about 3–5% of the
combustible energy of the fermentable carbohydrates entering<br />
the colon (0.50–0.85 kJ/g, sometimes rounded up to<br />
1 kJ/g of fermentable carbohydrate) and 0.3–0.5% of total<br />
combustible carbohydrate intake when 10% of it enters the<br />
colon as fermentable carbohydrate. Most H2 and CH 4 are<br />
excreted in flatus, especially at high rates of net gaseous<br />
production, but a variable proportion is absorbed and excreted<br />
unchanged in breath (cf. definition of DE above, which<br />
involves absorption of gases produced during fermentation,<br />
which contributes to the overall ‘digestibility’ of energy).<br />
It should be noted that the digestibility and DE values are<br />
mean values obtained in subjects without disease. It is<br />
recognized that digestibility, and therefore DE (kJ/g), vary<br />
between individuals and are affected by both age (for<br />
example, the fractional absorption of some macronutrients,<br />
is less in young infants than adults) and disease (malabsorption<br />
disorders). There may also be interaction between<br />
nutrients. For example, studies in rats suggest that guar<br />
gum and some pectin preparations induce substantial faecal<br />
fat loss, although quantitatively important interactions of a<br />
similar kind were not observed in humans (Rumpler et al.,<br />
1998). One study in healthy volunteers showed that an<br />
increase in dietary fibre intake from 15 to 46 g/day, through<br />
addition of pectin to the diet, increased fatty acid excretion<br />
from 1.5 to 2.7 g/day (Cummings et al., 1979). Another study<br />
reported a smaller increase in fatty acid excretion when<br />
dietary fibre intake was increased from 17 to 45 g/day<br />
through addition of wheat bran to the diet (Cummings<br />
et al., 1976). The possibility that quantitatively greater<br />
interactions occur with novel fats cannot be excluded.<br />
Dietary fibre has also been repeatedly reported to increase<br />
N excretion, but at least some of this N originates from urea,<br />
which passes through the colonic mucosa to reach bacteria<br />
and which also enters the colon through the ileocaecal valve,<br />
which allows transfer of small intestinal fluid from the small<br />
to the large intestine. Fat and protein (non-nitrogenous<br />
component) in biomass are generally thought to be generated<br />
from fermentable carbohydrate. High intakes of fibre<br />
may also increase shedding of mucosal cells, containing<br />
some fat and protein) into the lumen of the gut.<br />
For carbohydrates that are considered to be fully digested<br />
and absorbed by the small intestine (digestibility ¼ 1.0; for<br />
example, glucose, fructose, lactose, sucrose and starch), DE is<br />
identical to cIE. For carbohydrates that are not absorbed at<br />
all, DE and digestibility are zero (although their cIE is similar<br />
to that of other types of carbohydrates (kJ/g)).<br />
The DE of carbohydrate that reaches the colon (‘unavailable<br />
carbohydrate’) is lower than its cEI, partly because some<br />
are not fermented (faeces generally contain some of this<br />
carbohydrate) and partly because some of the products of<br />
fermentation are lost to faeces (for example, as bacterial<br />
biomass). Virtually, all the short-chain fatty acids (SCFAs)<br />
produced during fermentation are absorbed through the<br />
colon and metabolized by human tissues (butyrate is also<br />
actively metabolized by the colonic mucosa). Guar gum,<br />
which is completely fermented, contributes about 60% of its<br />
Physiological aspects of energy metabolism<br />
M Elia and JH Cummings<br />
cIE to SCFAs; pectin, which is about 95% fermented<br />
contributes a little less of its energy to SCFAs; and other<br />
types of carbohydrates, which are poorly fermented (for<br />
example, Solka-floc) contribute very little of their energy to<br />
SCFAs (Livesey and Elia, 1995). For traditional foods (foods<br />
listed in the 1978 edition of McCance and Widdowson’s<br />
Composition of Foods (Paul and Southgate, 1978), a general<br />
fermentability value of 70% seems reasonable (Livesey and<br />
Elia, 1995; FAO, 1998), since 30% of the NSP is excreted in<br />
faeces over a wide range of intakes. This is in agreement with<br />
intestinal balance studies and net production rates of SCFAs,<br />
which are almost entirely available for metabolism by<br />
human tissues (Livesey and Elia, 1995), with lower efficiency<br />
than glucose (Hine is used to indicate the heat released as a<br />
result of this metabolic inefficiency relative to glucose). A<br />
schematic diagram (Figure 2) can help understand how<br />
standard reference values for DE (and ME) of NSP and other<br />
carbohydrates reaching the colon (‘fibre’) are established,<br />
assuming that 70% are fermented there. For historical<br />
reasons, values for the energy values of ‘fibre’ largely<br />
developed from meta-analyses of studies using either the<br />
AOAC (2002) or Southgate (1969) analytic procedures, which<br />
corresponds approximately to NSP þ resistant starch (RS).<br />
DE ¼cIE cFE cGaE<br />
¼17:0 8:7 0:6kJ=g<br />
¼7:7kJ=g<br />
The value for cFE (8.7 kJ/g) is the sum of the cIE of<br />
unfermented carbohydrate (5.1 kJ/g or 30% of the total cIE<br />
of the carbohydrate entering the colon; Figure 2) and<br />
products of fermentation lost to faeces (mainly bacterial<br />
matter) (3.6 kJ/g). Another way of calculating the same result<br />
is to use a fractional intestinal balance approach. Since 70%<br />
of carbohydrate that reaches the colon is fermented, of<br />
which B65% is transformed into SCFAs (B60%) plus<br />
gaseous energy (5%), then the following equation applies:<br />
DE ¼17:0 0:7 0:65<br />
¼7:7kJ=g<br />
For simplicity, the figure assumes that 5% of the energy of<br />
fermented carbohydrate is lost as fermentation heat and<br />
another 5% as gaseous energy, although it is more likely to<br />
be 7 and 3%. The results also vary between subjects. For<br />
example, calculations based on balance studies carried out in<br />
six subjects who were studied in a metabolic unit and whole<br />
body calorimeter indicate that 3.872.8% of fermentable<br />
energy (NSP þ RS) was lost as gaseous energy (H2 and CH 4)<br />
(Poppitt et al., 1996). The values for individual types of<br />
fermented carbohydrate differ, partly because the proportion<br />
fermented varies and partly because products of fermentation<br />
also vary (that is, bacterial biomass plus gaseous<br />
products, which are excreted vs SCFAs, virtually all of which<br />
are absorbed and metabolized by human tissues) (Livesey<br />
and Elia, 1995).<br />
S43<br />
European Journal of Clinical Nutrition
S44<br />
'Fibre'<br />
17.0 kJ/g<br />
Physiological aspects of energy metabolism<br />
M Elia and JH Cummings<br />
Energy kJ/g<br />
Similar calculation procedures to the above can be used to<br />
establish DE values of polyols. Like NSP, polyols are a<br />
heterogeneous group of substances (Bernier and Pascal,<br />
1990; Japanese Ministry of Health, 1991; Livesey, 1992;<br />
FASEB 1994; Finley and Leveille, 1996) that have different<br />
physiological properties. For example, glycerol, like glucose,<br />
is fully absorbed (digestibility ¼ 1.0), and therefore its DE is<br />
the same as its cEI (18.0 kJ/g). Although other polyols, such<br />
as isomalt, lactitol, maltitol and erythritol, have a cEI of<br />
16.70–17.20 kJ/g, their DE values (11.0–16.61 kJ/g) are 65–<br />
97% of their cEI. In contrast, virtually, all the lactitol in food<br />
escapes digestion and absorption by the small bowel and<br />
finds its way into the large bowel, where about 60% of its cIE<br />
is converted to SCFAs, which are subsequently absorbed by<br />
the colon (cIE, 17.0 kJ/g; DE, estimated to be about 11.1 kJ/g<br />
(DE ¼ 0.65cIE)). With the increasing use of different types of<br />
polyols in foods, it is becoming apparent that their digestibility,<br />
the extent to which they are absorbed by the small bowel and<br />
the extent to which they are subsequently metabolized by<br />
human tissues varies so much (see below) that it might be<br />
appropriate to use individual rather than generic energy values.<br />
A further potential complexity is that polyols may be handled<br />
differently by the gut (resulting in different digestibility and DE<br />
values) when taken in foods compared to drinks. However,<br />
food regulations normally prohibit the use of polyols in drinks.<br />
5.1<br />
3.6<br />
0.6<br />
0.6<br />
7.1<br />
Unfermented fibre<br />
Bacterial matter<br />
H2 and CH4 Fermentation heat<br />
Hine SCFA (1.2 kJ)<br />
Short chain fatty acids<br />
(SCFA)<br />
Faecal energy (8.7 kJ)<br />
Gaseous energy (0.6 kJ)<br />
Metabolisable = Digestible<br />
energy (7.7 kJ)<br />
An exception is the use of erythritol, which is hardly<br />
metabolized once absorbed and hardly fermented when<br />
reaching the colon. An issue for further consideration is<br />
whether low-dose polyols should be used in drinks.<br />
Metabolizable energy<br />
By convention, the metabolizable dietary energy (ME) is measured<br />
at zero nitrogen and energy balance. In these circumstances,<br />
ME is the component of DE that produces heat during oxidative<br />
metabolism. It does not include energy that is lost to urine<br />
(combustible urinary energy (cUE; for example, urea, which is a<br />
partially combusted end product of protein metabolism or<br />
unmetabolized urinary polyols) or body surfaces (combustible<br />
surface energy (cSE; for example, desquamated cells, hair loss,<br />
perspiration), because this energy is not used in metabolism.<br />
Therefore, ME can be defined mathematically as follows:<br />
ME ¼ DE cUE cSE<br />
Since DE ¼ cIE–cGaE, the following also applies:<br />
ME ¼ cIE cGaE cUE cSE<br />
H ine 'fibre'<br />
(1.8 kJ)<br />
Net<br />
metabolisable<br />
energy<br />
(5.9 kJ)<br />
Figure 2 The fate of ‘fibre’ ingested with conventional foods. It is assumed that 70% is fermented, so that 5.1 kJ/g (30% of the combustible<br />
intake energy (cIE) is lost to faeces unchanged. Of the fibre that is fermented, 5% of the cIE energy is lost as gaseous products (H2 and CH4), and<br />
another 5% as heat of fermentation, which contributes to metabolizable energy. The majority (60% of cIE) is converted to short-chain fatty acids,<br />
almost all of which are absorbed and metabolized by human tissues, or lost to faeces (30% of cIE), mainly as bacterial biomass. Of the energy<br />
initially present in total fibre (fermentable and non-fermentable) 51.0% is lost to faeces, 3.5% to gaseous products and the remaining 45.5%<br />
accounts for metabolizable energy.<br />
European Journal of Clinical Nutrition<br />
In normal healthy subjects, loss of surface energy is small<br />
and can be ignored. For many carbohydrates (for example,
glucose, starch, NSP) there is also negligible loss of cIE to<br />
urine, and so cUE can also be ignored. Under these<br />
circumstances (which do not apply to many polyols), the<br />
following equation is valid<br />
DE ¼ ME<br />
For carbohydrates that are fully absorbed and fully metabolized<br />
to CO2 and H 2O (‘available carbohydrates’, for<br />
example, glucose, starch), the following equation also<br />
applies:<br />
cIE ¼ DE ¼ ME<br />
For other types of carbohydrates, ME is less than cIE, either<br />
because there is some loss of cIE to faeces (cFE) and/or urine<br />
(cUE), as in the case of some polyols. Polyols, which are often<br />
used as bulk-sweetening agents, have fewer detrimental<br />
effects on teeth, lower glycemic indices and lower ME values<br />
than conventional sweet sugars (for example, glucose,<br />
fructose, sucrose). The proportion absorbed by the small<br />
intestine varies considerably with the type of polyol (Bernier<br />
and Pascal, 1990; Livesey, 1992; Finley and Leveille, 1996),<br />
and tends to decrease with increasing molecular weight. As<br />
much as 35% of the energy of polyols can be accounted for<br />
in faeces (digestibility of energy, 65–100%; although polyols<br />
are fermented and not recovered in faeces, some of the<br />
products of this fermentation are recovered in faeces). In<br />
addition, a variable proportion of absorbed polyols is lost in<br />
urine. A detailed discussion about the extent of absorption<br />
and metabolism of polyols by bacteria in the human colon<br />
and by human tissues is beyond the scope of this paper.<br />
However, the following brief points illustrate the variability<br />
in their physiological handling. The small intestine absorbs<br />
only about 2–5% of lactitol, which is almost completely<br />
recovered in urine (95%), with little oxidation by human<br />
tissues (suggested by studies involving intravenous administration<br />
of C-labelled lactitol (Bernier and Pascal, 1990)).<br />
The small intestine absorbs B25% of mannitol and, like<br />
lactitol, it is almost totally excreted in urine without<br />
metabolism by human tissues (again suggested by intravenous<br />
administration of labelled (Nasrallah and Iber, 1969)<br />
and unlabelled (Nasrallah and Iber, 1969) mannitol). In<br />
contrast, glycerol is completely absorbed and metabolized by<br />
human tissues, without excretion in urine. Sorbitol is<br />
absorbed to the extent of B50%, of which the majority<br />
(B85%) is metabolized by human tissues (Finley and<br />
Leveille, 1996).<br />
Most studies assessing ME of diets have been carried out in<br />
subjects close to N and energy balance. The DE and ME<br />
systems appear to overestimate DE and ME when energy<br />
intake is low, especially when accompanied by high NSP<br />
intake because apparent digestibility tends to be lower. Food<br />
energy values reflect the supply of energy and not whether it<br />
is spent. Some energy is deposited during growth and<br />
development of obesity. The combustible energy that is<br />
deposited in such situations corresponds to DE, which may<br />
Physiological aspects of energy metabolism<br />
M Elia and JH Cummings<br />
not be made available to oxidative metabolism, if for<br />
example it is retained during the growing process. Some of<br />
it may not be made available even if it were mobilized<br />
and metabolized, because incompletely combusted products<br />
of metabolism, such as urea, are excreted in urine<br />
(for protein, DE4ME). However, when carbohydrate is<br />
mobilized, it is usually totally oxidized (combustible<br />
energy ¼ DE ¼ ME). The issue is discussed further below—<br />
‘Calculating energy balance’.<br />
DE and ME values may be influenced by genetic factors<br />
and disease. For example, although lactose is assigned a<br />
digestibility coefficient of 1.0, so that cIE ¼ DE (also ¼ ME), in<br />
subjects with lactose malabsorption (Matthews et al., 2005;<br />
Montalto et al., 2006) (due to genetic factors that can affect<br />
entire populations, or to damage of intestinal lactase by<br />
gastroenteritis or enteropathy), not all the lactose is hydrolyzed<br />
and absorbed by the small intestine. Some of it reaches<br />
the colon, where it is fermented to produce faecal matter and<br />
gaseous end products (both of which reduce DE and ME) and<br />
SCFAs, which are absorbed and metabolized by human<br />
tissues. Another example concerns fructose, which when<br />
ingested in small quantities is fully absorbed by the small<br />
intestine, but when ingested in large quantities, can reach<br />
the large bowel, where it is fermented (Truswell et al.,<br />
1988). This fermentation results in some loss of energy<br />
to faeces (cFE) (for example, as bacterial biomass), which<br />
again reduces its DE and ME values. Yet another example<br />
involves loss of glucose in the urine of diabetic patients<br />
(metabolizability of o1.0; and MEoDE). Since DE and ME<br />
values vary between individuals and are affected by disease,<br />
the values in general use are based on average results<br />
obtained in ‘healthy’ subjects using doses of substrates that<br />
are likely to be ingested. Any errors in establishing DE values<br />
will not only affect ME values but also NME values, which is<br />
discussed next.<br />
Net metabolizable energy<br />
A criticism that has been raised against the ME system is that<br />
it fails to consider differences in the efficiency with which<br />
substrates supply biologically useful energy. The NME system<br />
is based on the concept of biological efficiency at the level of<br />
ATP and takes into account two specific processes, both of<br />
which have the effect of reducing metabolic efficiency. First,<br />
the heat of fermentation does not yield ATP to the host.<br />
Since this lowers the overall bioenergetic efficiency of the<br />
fermentable substrate, some workers have suggested using<br />
the term ‘true metabolizable energy’, which they have<br />
defined as ME minus the heat of fermentation (Bar, 1990;<br />
Bernier and Pascal, 1990). This approach, which is used in<br />
animal nutrition, differs from that in human nutrition,<br />
where the heat of fermentation is included in ME. Second,<br />
different fuels yield net ATP (ATP gain) with different<br />
bioenergetic efficiencies (Elia and Livesey, 1988, 1992;<br />
Blaxter, 1989). Those with lower efficiencies (for example,<br />
protein) will result in more heat production for the<br />
S45<br />
European Journal of Clinical Nutrition
S46<br />
same useful metabolic or external physical work done than<br />
in those with higher efficiencies (that is, more heat is<br />
released for the same ATP gain). The NME system aims to<br />
make the energy values of all fuels equivalent at a<br />
biochemical level (isobioenergic). It does this by adjusting<br />
ME values to take into account differences in the energetic<br />
efficiency with which net ATP is generated. A theoretical<br />
approach, which is discussed first, has been found to agree<br />
remarkably well with an empirical approach based on<br />
measurements obtained by indirect calorimetry, which is<br />
discussed later.<br />
The energy equivalent of ATP is the heat generated<br />
during oxidation of a substrate (ME) divided by the<br />
number of moles of ATP gained through specified<br />
oxidative metabolic pathways. To understand this,<br />
it is necessary to clarify four points (Elia and Livesey,<br />
1988, 1992).<br />
(1) Application of NME does not require an understanding<br />
of how ATP is generated, any more that<br />
than application of ME requires an understanding<br />
of the complex processes of digestion and fermentation,<br />
which are quantitatively poorly understood and<br />
variable.<br />
(2) ATP gain does not mean that ATP accumulates: ATP has a<br />
small pool size with a very rapid turnover. Therefore, the<br />
term ‘ATP gain’ refers to the ATP made available to the<br />
body for metabolic or external work.<br />
(3) Some pathways involve both production and utilization<br />
of ATP. For example, during glucose oxidation, one ATP<br />
is obligatorily used in the initial activation of glucose to<br />
glucose 6-phosphate and another for the conversion<br />
of fructose-6-phosphate to fructose-1,6-biphosphate.<br />
Therefore, two extra moles of ATP are produced than<br />
are gained. The term ‘ATP gain’ refers to the net gain of<br />
ATP (total ATP produced minus ATP utilized obligatorily<br />
during the oxidation of a substrate).<br />
(4) ATP gain, which refers to the net provision of energy<br />
in the form of ATP, has to be distinguished from<br />
biochemical processes, including substrate cycling<br />
(for example, fatty acid-acetyl-CoA recycling or<br />
glucose-lactate recycling) that utilizes ATP. The two<br />
should not be confused because they are on different<br />
sides of the ATP balance equation (ATP gain ¼ ATP<br />
utilized).<br />
The NME system is based on the concept of relative<br />
metabolic efficiency. Although uncoupling of oxidative<br />
phosphorylation increases the amount of heat released per<br />
ATP gained, this affects all macronutrients, so that the ratio<br />
of metabolic efficiency between two macronutrients is<br />
expected to change much less than that associated with a<br />
single nutrient. This is confirmed quantitatively by theoretical<br />
models of progressive uncoupling (Livesey, 1984, 1986).<br />
By convention, the NME system expresses efficiency of<br />
nutrients relative to glucose, which is assigned an efficiency<br />
coefficient of 1.0 (kglucose ¼ 1.0)(Dutch Nutrition Council,<br />
European Journal of Clinical Nutrition<br />
Physiological aspects of energy metabolism<br />
M Elia and JH Cummings<br />
1987; Blaxter, 1989; Livesey and Elia, 1995).<br />
k ðnutrientÞ ¼ kJðMEglucoseÞ per ATP gain=kJ ðMEnutrientÞ per ATP gain<br />
¼ ATP gain per kJ ðMEnutrientÞ=ATP gain per kJ ðMEglucoseÞ<br />
The following equations show how the coefficient, knutrient,<br />
is related to its NME (NME nutrient).<br />
The lower the value of k nutrient, the greater the metabolic<br />
inefficiency relative to glucose and the greater the amount of<br />
heat released for the same ATP gain (Livesey, 1984; Elia and<br />
Livesey, 1988, 1992; Livesey and Elia, 1995).<br />
The term Hine is the extra heat released as a result of<br />
metabolic inefficiency relative to glucose (that is, extra heat<br />
released for the same ATP gain). H ine is therefore a<br />
component of total heat release.<br />
NMEnutrient ¼ knutrient ME<br />
¼ MEnutrient ðð1 knutrientÞ MEnutrientÞ<br />
¼ MEnutrient Hine<br />
Since H ine is the heat released as a result of the metabolic<br />
inefficiency (relative to glucose) (H ine ¼ (1 k nutrient)<br />
ME nutrient), 1 k nutrient can be regarded as the metabolic<br />
inefficiency coefficient relative to glucose. The overall values<br />
for k (and therefore 1 k) for carbohydrates fermented in the<br />
large bowel takes into account not only the relative<br />
metabolic inefficiency of oxidizing the products of fermentation<br />
(SCFAs are absorbed and oxidized by human tissues),<br />
but also the heat of fermentation, which is not associated<br />
with ATP gain to the host. Both of these elevate the overall<br />
energy equivalent of ATP gain relative to glucose, and<br />
decrease the overall value for knutrient (or increase the<br />
inefficiency coefficient, 1 k nutrient), with a resulting increase<br />
in heat production (H ine).<br />
The metabolic efficiency with which fats are oxidized is<br />
98% that of glucose, proteins about 80%, alcohol about 90%,<br />
SCFAs (direct oxidation) about 85–90%. Various scholars and<br />
committees have established theoretical values of efficiency<br />
of substrate oxidation relative to glucose from the stochiometry<br />
of metabolic pathways (summarized by G Livesey)<br />
with the following ranges: protein (Blaxter, 1971, 1989;<br />
Schulz, 1975, 1978; Flatt, 1978, 1980, 1987, 1992; Livesey<br />
and Elia, 1985; Life Sciences Research Office, 1994; Black,<br />
2000), 0.78–0.85 (mean, 0.81); fat (Armstrong, 1969; Schulz,<br />
1975, 1978; Flatt, 1978, 1980, 1987, 1992; Livesey and Elia,<br />
1985; Blaxter, 1989; Black, 2000), 0.97–1.01 (mean 0.98);<br />
fermentable carbohydrate (British Nutrition Foundation,<br />
1990; Life Sciences Research Office, 1994; Livesey, 2002),<br />
0.74–0.75 (mean, 0.74); and mixed short-chain organic acids<br />
(Armstrong, 1969; Livesey and Elia, 1985; Dutch Nutrition<br />
Council, 1987; Livesey, 1992; Life Sciences Research Office,<br />
1994), 0.83–0.87 (mean, 0.85). In the case of oxidation of<br />
SCFAs by human tissues, this means that about 10–15%<br />
more heat is released for a given ATP gain than when glucose<br />
is oxidized to yield the same ATP gain. However, in subjects<br />
ingesting 80 g protein and only 20 g ‘fibre’, the excess heat
generated through bioenergetic inefficiency during protein<br />
oxidation is B10-fold greater than during SCFA oxidation<br />
(B5-fold greater than the overall Hine of fibre, which<br />
includes the heat of fermentation). This is mainly because<br />
more protein is oxidized than in SCFAs, and partly because<br />
the bioenergetic inefficiency in generating ATP is greater<br />
during protein oxidation than in SCFA oxidation. The<br />
inefficiency associated with the metabolism of NSP as a<br />
whole not only takes into account the bioenergetic inefficiency<br />
of oxidizing SCFAs but also the heat of fermentation<br />
(overall metabolic efficiency of fermentable NSP B72.5%<br />
that of glucose). Even so, the heat released as a result of<br />
metabolic inefficiency relative to glucose (Hine) remains<br />
quantitatively more important with protein than with NSP<br />
mainly because much more protein than NSP is usually<br />
ingested. However, in subjects ingesting large amounts of<br />
NSP and relatively little protein, as in some low-income<br />
countries, the heat released as a result of metabolic<br />
inefficiency associated with these two macronutrients can<br />
be almost equivalent.<br />
To examine the validity of the NME system, theoretically<br />
calculated k coefficients were compared to those based on<br />
experimental observations obtained in human studies that<br />
involved calorimetry (for example, whole body 24 h calorimetry),<br />
N balances, and in some cases measurement of H2<br />
and CH 4 excretion (Livesey, 2001). In these studies, measurements<br />
of energy expenditure were undertaken in subjects<br />
given a control diet or a test diet, which differed from the<br />
control diet in that available carbohydrate was exchanged<br />
for a test substrate (for example, protein, which has a lower k<br />
coefficient than glucose). Test diets, which had lower kdiet<br />
coefficients than control diets, would be expected to be<br />
associated with greater energy expenditure (more heat<br />
production). The increased heat production (H ine) on the<br />
test diet (after adjusting for energy and N balance) was used<br />
to calculate k(nutrient) ((ME–H ine)/ME), assuming that ATP<br />
gain remained unchanged under the conditions of the study,<br />
which involved undertaking a fixed pattern of physical<br />
activity in ambient temperatures of thermal comfort. The<br />
mean results obtained by the theoretical and experimental<br />
approaches are strikingly similar (Table 2). The same type of<br />
approach has been used to establish coefficients for k for the<br />
NME system in animals, and again the similarities between<br />
theoretical and experimental approaches are striking (Livesey,<br />
2001). However, as is the case for DE and ME evaluation<br />
of foods, time-consuming studies cannot realistically be<br />
undertaken to establish efficiency values for large numbers<br />
of foods reported in food tables. Therefore, some of the<br />
recent developments and applications of the human NME<br />
system have relied heavily on the theoretical approach.<br />
Detailed theoretical considerations about potential alternative<br />
pathways for generating ATP gain from the same<br />
substrate are beyond the scope of this paper (for example,<br />
cytosolic vs mitochondrial activation of SCFAs, net lipogenesis<br />
from glucose; Elia and Livesey, 1988; Livesey and<br />
Elia, 1995; and oxidation of alcohol with alcohol dehydro-<br />
Physiological aspects of energy metabolism<br />
M Elia and JH Cummings<br />
Table 2 A comparison of experimentally obtained and theoretical<br />
values of metabolic efficiency of macronutrients relative to glucose<br />
(k nutrient) a<br />
Macronutrient<br />
(number of studies)<br />
Relative metabolic efficiency (k nutrient)<br />
Experimentally<br />
obtained<br />
mean7s.e.m.<br />
Theoretical<br />
Fat (n ¼ 8) 0.9770.01 0.98<br />
Protein (n ¼ 9) 0.7970.02 0.80<br />
Fermentable<br />
unavailable<br />
carbohydrate (n ¼ 8)<br />
0.7170.09 0.76<br />
Alcohol (n ¼ 3) 0.9070.04 0.90<br />
a Based on Livesey (2001).<br />
genase or mixed function oxidase). However, alternative<br />
pathways are considered to have small effects on the overall<br />
energy equivalents of ATP. In addition, some processes may<br />
also operate only in unusual circumstances. For example, 24h<br />
whole-body indirect calorimetry shows that it is unusual<br />
for individuals ingesting a western-type diet to achieve a<br />
non-protein respiratory quotient above 1.0, which would<br />
indicate net lipogenesis from carbohydrate (although persistent<br />
overfeeding with large amounts of carbohydrate can do<br />
this, for example, during nutritional repletion of malnourished<br />
subjects; Pullicino and Elia, 1991). The energy<br />
equivalent of ATP associated with low to moderate intake<br />
of alcohol was established using the pathway involving<br />
alcohol dehydrogenase, and its validity confirmed by<br />
calorimetry studies (Table 2).<br />
The NME system has been supported by many national<br />
committees in different countries, and the FAO has recommended<br />
that it should be considered for food labelling, for<br />
food tables and when calculating practical food needs from<br />
energy requirements. General values for the major macronutrients<br />
and specific values for different types of carbohydrates<br />
are shown in Table 3 (Livesey, 2003a), together with<br />
combustible digestible and metabolizable conversion factors.<br />
Variability in energy values<br />
DE, ME and NME values for specific carbohydrates do not<br />
necessarily apply in all circumstances. For example, in some<br />
individuals, carbohydrates may be totally metabolized by<br />
human tissues after complete absorption by the small<br />
intestine, whereas in others, they are incompletely digested<br />
and absorbed by the small intestine (for example, lactose<br />
malabsorption, which can be elicited more readily certain<br />
ethnic groups). In the latter situation lactose undergoes<br />
colonic fermentation, with some converted into cFE, cGaE<br />
and fermentation heat. The absorption and oxidation of<br />
SCFAs derived from fermentation of lactose is associated<br />
with higher energy equivalents of ATP (less ATP gain) than<br />
when lactose is hydrolyzed and oxidized directly by human<br />
S47<br />
European Journal of Clinical Nutrition
S48<br />
Table 3 Energy values of macronutrients and specific carbohydrates in<br />
foods (kJ/g) a<br />
cIE DE ME NME<br />
Macronutrients<br />
Fat 39.3 37.4 37.4 36.6<br />
Protein 23.6 21.7 16.8 13.4<br />
Available carbohydrates b<br />
15.7 15.7 15.7 15.7<br />
‘Fibre’/NSP 17.0 7.7 7.7 6.0<br />
Alcohol 29.6 29.6 29.0 25.8<br />
Specific carbohydrates<br />
Available carbohydrates<br />
Glucose monohydrate 14.1 14.1 14.1 14.1<br />
Glucose 15.7 15.7 15.7 15.7<br />
Fructose 15.7 15.7 15.7 15.2<br />
Lactose 16.5 16.5 16.5 16.3<br />
Sucrose 16.5 16.5 16.5 16.3<br />
Starch 17.5 17.5 17.5 17.5<br />
Fibre<br />
Fermentable ‘fibre’ 17.0 11.0 11.0 8.0<br />
Non-fermentable ‘fibre’ 17.0 0.0 0.0 0.0<br />
Resistant starch 17.5 11.4 11.4 8.8<br />
Non-digestible oligosaccharides<br />
General, conventional foods<br />
Isolated/synthetic<br />
17.0 11.1 11.1 8.4<br />
Fructooligosaccharides 17.0 11.1 11.1 8.4<br />
Synthetic polydextrose<br />
(5% glucose)<br />
16.9 6.6 6.6 5.2<br />
Inulin (pure) 17.5 11.4 11.4 8.8<br />
Polyols<br />
Erythritol 17.2 16.6 1.1 0.9<br />
Glycerol 18.0 18.0 18.0 16.6<br />
Isomalt 17.0 11.6 11.2 8.9<br />
Lactitol 17.0 11.1 10.7 8.2<br />
Maltitol 17.0 13.4 13.0 11.5<br />
Mannitol 16.7 12.3 8.1 6.3<br />
Polyglycitol 17.1 13.5 13.2 11.6<br />
Sorbitol 16.7 12.0 11.7 9.7<br />
Xylitol 17.0 14.0 13.7 12.4<br />
Abbreviations: cIE, combustible intake of energy; DE, digestible energy; ME,<br />
metabolizable energy; NME, net metabolizable energy; NSP, non-starch<br />
polysaccharides.<br />
a Based on Livesey (2003a). The values for macronutrients have also been<br />
reported in Livesey (2001), with some trivial differences in the values for<br />
protein and alcohol. For available carbohydrates, see also Livesey and Elia<br />
(1988) and Elia and Livesey (1992). For fibre see text.<br />
b Available carbohydrate (as monosaccharide equivalents) measured by direct<br />
analysis of sugars. When carbohydrate is measured ‘by difference’, the values<br />
increase by 1 kJ/g.<br />
tissues. The overall result is that DE, ME and NME values for<br />
lactose, when there is lactose malabsorption, are lower than<br />
cIE, and lower than the usual values assigned to it, which<br />
assume that all lactose is absorbed from the small bowel<br />
(16.5 kJ/g for cIE, DE and ME values, and 16.3 kJ/g for the<br />
NME). However, this problem is likely to be a minor one,<br />
since individuals with lactose intolerance do not normally<br />
ingest large amounts of lactose because it can produce<br />
undesirable bloating effects and diarrhoea.<br />
European Journal of Clinical Nutrition<br />
Physiological aspects of energy metabolism<br />
M Elia and JH Cummings<br />
The standard DE, ME and NME values obviously<br />
overestimate the actual values in patients with malabsorption<br />
disorders to an extent that depends on the<br />
type of malabsorption disorder and its severity. In contrast,<br />
the standard values may underestimate the actual<br />
values when nutrients are given intravenously and made<br />
directly available to human tissues. This problem is<br />
addressed in detail elsewhere (Livesey and Elia, 1985,<br />
1988). However, the energy value for glucose, which is<br />
usually the dominant energy source for intravenous<br />
nutrition, remains unaltered, but this may not be so for<br />
other types of carbohydrates that may be lost in urine to a<br />
variable extent.<br />
Calculating energy balance<br />
There is interest in estimating energy balance during growth,<br />
development of obesity and undernutrition, as well as<br />
during their treatment. The energy balance can be calculated<br />
from changes in body composition (Fuller et al., 1992;<br />
Heymsfield et al., 2005), which can provide estimates of fat<br />
and protein mass, and in some cases carbohydrate (glycogen<br />
stores are small, but can be measured accurately and<br />
precisely using nuclear magnetic resonance; Taylor et al.,<br />
1992; Casey et al., 2000). Energy balance can also be<br />
calculated from classic balance studies, which involve<br />
measurement of energy intake and energy expenditure. In<br />
calculating energy balance, it is important not to confuse the<br />
energy values of endogenous and exogenous fuels and also<br />
not to confuse different food energy systems (combustible,<br />
ME and NME systems; Table 4).<br />
The ME and NME values of nutrients (kJ/g) that are<br />
mobilized from body stores and used for oxidation during<br />
weight loss are higher than the corresponding food energy<br />
values (Table 4), mainly because digestibility does not apply<br />
to the former but it does to the latter. For example, the ME<br />
values of fat in food is 37.4 kJ/g compared to the value of<br />
39.3 kJ/g of stored fat, and for food protein 16.8 kJ/g<br />
compared to 18.4 kJ/g of tissue protein.<br />
Using body composition techniques, the energy balance<br />
equations is<br />
Energy balance ¼Energy storestime point 2 energy storestime point 1<br />
¼energytime point 2ðcarbohydrate þ fat þ proteinÞ<br />
energytime point 1ðcarbohydrate þ fat þproteinÞ<br />
The energy values for all macronutrients in this equation are<br />
the endogenous food energy values and not the exogenous<br />
food energy values (see Table 4 for combustible energy, ME<br />
and NME values). The body composition approach is usually<br />
only of value in long-term studies where there are large<br />
changes in body composition, which far outweigh measurement<br />
precision. In some such studies, the changes in<br />
glycogen stores are small and therefore they are either be<br />
ignored or estimated. The errors associated with this<br />
approach have been assessed (Elia et al., 2003).
Table 4 cE, ME and NME, and content of macronutrients in food and in<br />
body stores<br />
The classic energy balance technique involves measurements<br />
of both total energy expenditure, using calorimetry<br />
(whole-body calorimetry) or tracer techniques (the doubly<br />
labelled water technique (Prentice, 1990) or the bicarbonate–<br />
urea method (Elia et al., 1995; Gibney et al., 1996, 2003;<br />
Paton et al., 1996, 2001; Tang et al., 2002; Elia, 2005) and<br />
energy intake.<br />
The energy balance equation can be considered in terms of<br />
combustible energy or ME.<br />
(i) Energy balance (combustible energy): cEstored ¼ cIE–<br />
heat–cEnergy losses where cEnergy losses are the<br />
combined losses through faeces urine, body surfaces<br />
and gases (cFE þ cUE þ cSA þ cGaE). cIE can be measured<br />
using bomb calorimetry, but can also be estimated<br />
(Table 3).<br />
(ii) Energy balance (ME): MEstored ¼ ME intake–heat<br />
Since the following two equations apply,<br />
ME stored ¼NME=kstored<br />
ME intake ¼ME intake=kintakeðdietÞ ‘Food’ energy Body stores a<br />
cE kJ/g ME kJ/g NME kJ/g cE kJ/g ME kJ/g NME kJ/g<br />
Fat 39.3 37.4 36.6 39.3 39.3 38.5<br />
CHO b<br />
Available 15.7 15.7 15.7 15.7 15.7 15.9 c<br />
Unavailable 17.0 7.7 5.6 — — —<br />
Protein 23.6 16.8 13.4 23.6 18.4 o14.7 d<br />
Alcohol 29.6 29.0 25.8 — — —<br />
Abbreviations: cE, combustible energy; ME, metabolizable energy; NME, net<br />
metabolizable energy.<br />
a The values indicated assume mobilization and oxidation of ‘stored’<br />
macronutrients. The starting points are the body stores (which are lost during<br />
starvation), and as such represent a departure from food energy systems.<br />
b CHO as monosaccharide equivalents.<br />
c The value, which is higher than that of glucose, takes into account the heat of<br />
hydrolysis of glycogen and one extra ATP gained per glucosyl residue during<br />
oxidation of glycogen compared to oxidation of glucose.<br />
d Protein breakdown involves both ATP-independent pathways (in which case<br />
the value of B14.7 kJ/g applies) and ATP-dependent pathways (in which case<br />
the value o14.7 kJ/g applies).<br />
the energy balance equation can also be expressed in relation<br />
to NME.<br />
Energy balance (NME): NME/k stored ¼<br />
ME intake/k intake(diet)–heat<br />
In these equations, the heat released (energy expenditure)<br />
is again measured by calorimetry in controlled laboratory<br />
conditions or by tracer techniques in free-living conditions.<br />
ME intake in this situation is obviously calculated from the<br />
exogenous food energy values (Table 4). Parenthetically, it<br />
should be noted that in short-term studies involving<br />
external work, not all of the heat produced is lost from the<br />
Physiological aspects of energy metabolism<br />
M Elia and JH Cummings<br />
body (some is transiently retained in the body, causing an<br />
increase in body temperature).<br />
Energy systems and food labelling<br />
Food energy systems have evolved over time, as fundamental<br />
physiology of macronutrient metabolism was reviewed. For<br />
example, a value of 17 kJ/g (Atwater general factor) was<br />
assigned to the ME for total carbohydrate including ‘fibre’ (or<br />
unavailable carbohydrate) (this system also assigns values of<br />
17 and 37 kJ/g of protein and fat, respectively) (Merill and<br />
Watt, 1973). There are physiological objections to this: not<br />
all carbohydrate that reaches the colon is fermented (some is<br />
excreted unchanged in faeces); some is converted to<br />
substances, such as combustible bacterial biomass in faecal<br />
matter and combustible gases, which are lost from the body.<br />
Therefore, more appropriate ME values for ‘fibre’/NSP have<br />
been established (for example, ME of 7.7 kJ/g for that present<br />
in conventional foods (see section on Digestible energy),<br />
which can be rounded to 8 kJ/g and NME of 6 kJ/g). The same<br />
evolution of thought occurred with polyols. Regulatory<br />
agencies assigned a value of 17 kJ/g to polyols (as for other<br />
carbohydrates) because none was recovered in faeces.<br />
However, this did not agree with energy balance studies.<br />
Basic physiological considerations (confirmed by experimental<br />
studies) suggest that fermentation of polyols results<br />
in some loss of energy in faeces and gaseous products (as<br />
with ‘fibre’). In addition, absorbed polyols are frequently lost<br />
in substantial quantities in urine. After further consultations<br />
within the European Union, polyols were assigned a general<br />
energy value of 10 kJ/g (European Communities, 1990).<br />
However, because of the variability in ME values for different<br />
polyols, European countries (for example, The Netherlands,<br />
France) as well as non-European countries (for example, the<br />
United States, Canada, New Zealand and Japan) have<br />
adopted or recommended a specific value for each polyol.<br />
An FAO consultation suggested that where one polyol<br />
represents a substantial source of energy in a product, use<br />
of a more specific factor may be desirable (FAO, 2003).<br />
Three food energy systems have been widely promoted for<br />
use in food tables and for food labelling in different world<br />
regions: those that employ the Atwater-specific factors<br />
(Merill and Watt, 1973); those that employ the Atwater<br />
general factors (Merill and Watt, 1973; FAO/WHO/UNU,<br />
1985) (17, 17, 37 kJ/g for carbohydrate, protein and fat,<br />
respectively); and those that employ NME factors (typically<br />
applied to polyols). The use of all these systems is a source of<br />
confusion, especially when factors from different systems are<br />
used in the same country. A further source of confusion is<br />
that in some countries, energy is expressed in relation to<br />
weight of carbohydrate, and in others in relation to weight<br />
of monosaccharide equivalents (B11% difference in the case<br />
of starch). There is also the issue of accuracy. A particular<br />
problem with the Atwater general system (Merill and Watt,<br />
1973) is that it appears to overestimate the energy values of<br />
specific food items, to the extent of 0–30%. The bias is<br />
S49<br />
European Journal of Clinical Nutrition
S50<br />
Physiological aspects of energy metabolism<br />
M Elia and JH Cummings<br />
especially marked for food items containing a high proportion<br />
of ‘fibre’ and certain types of protein, both of which may<br />
be prominent in weight-reducing diets (Brown et al., 1998). A<br />
modification of the Atwater general system that takes into<br />
account the presence of unavailable carbohydrate in foods<br />
(Livesey, 1991) has the advantage of overcoming the inaccuracy<br />
of the Atwater general system, while avoiding the complexity of<br />
the Atwater-specific system (Merill and Watt, 1973).<br />
Terminological and methodological issues in carbohydrate<br />
analysis are also important, due to the varied nature of the<br />
techniques that are in use. These are dealt with in other<br />
papers in this consultation (for example, see Measurement of<br />
dietary carbohydrates for food tables and labelling by Englyst<br />
et al., 2007). All carbohydrates can be determined by direct<br />
analysis. Carbohydrate ‘by difference’ (total carbohydrate<br />
unavailable carbohydrate) requires assumptions about the<br />
fate of carbohydrates in the colon that cannot always be<br />
predicted because this will, for example in the case of<br />
starches, be dependent on the physical form of the food,<br />
cooking and cooling, the degree of ripeness and nature of the<br />
starch granule. Therefore, ‘by difference methods’ should not<br />
have a place in carbohydrate analysis. Compared to the<br />
direct method, the indirect method (‘by difference’) has the<br />
effect of increasing the cEI, DE, ME and NME values of<br />
available carbohydrates by B1 kJ/g. As already suggested, the<br />
direct analysis is preferable (FAO, 1998), although this may<br />
pose practical problems in developing countries with poor<br />
access to analytical facilities. Finally, it should be remembered<br />
that food labelling applies to food items not diets, and<br />
that some foods may acquire different properties and<br />
different energy values before being ingested. For example,<br />
starch in potato can become resistant if it is cooked and<br />
allowed to cool before being ingested (Englyst and<br />
Cummings, 1987). In contrast, RS changes into ordinary of<br />
starch during the maturation of bananas, which occurs whilst<br />
their skins turn from green to yellow. Although these processes<br />
will affect DE, ME and NME values in different ways, food<br />
labelling cannot adequately take them into account.<br />
The idea that bioenergetic inefficiency results in heat<br />
production is not new, since it was already in existence in<br />
early part of the twentieth century. It is also well known that<br />
agents such as 2,4-dinitrophenol, which uncouple oxidative<br />
phosphorylation, produce a considerable amount of heat.<br />
Therefore, measurement of energy expenditure (heat production)<br />
does not necessarily reflect useful metabolic or<br />
external work done. The idea of establishing bioenergetic<br />
equivalence of different macronutrients has obvious attractions<br />
to food labelling. The NME (but not the ME) system is<br />
based on the concept that macronutrients contribute<br />
equivalently to energy balance and energy requirements<br />
irrespective of food composition. The FAO acknowledges<br />
that the Atwater-specific and general systems do not take<br />
into account Hine, which is relevant to calculations of energy<br />
requirements, and in the annexe of its report on food energy<br />
(FAO, 2003), it provides two tables to address this issue<br />
(Table 3.1 provides correction factors when ME intakes are<br />
European Journal of Clinical Nutrition<br />
being matched with requirements and Table 3.2 expresses<br />
food needs as the ‘food NME requirement’).<br />
The current labelling of carbohydrates (and more broadly<br />
foods in general) is unsatisfactory because the ME system is<br />
used for some carbohydrates (usually the most abundant<br />
carbohydrates, such as starch and sucrose), but the NME<br />
system is used for polyols and polydextrose in many regions<br />
(and in the same regions that use the ME system). It would<br />
seem more logical to use the same energy system for all<br />
carbohydrates, and indeed for all other nutrients. It has been<br />
argued that since NME values are only B96% of ME values<br />
(NMEB ¼ 0.96 ME), it makes little difference which system is<br />
used (especially since energy intake cannot generally be<br />
assessed with an accuracy of less than 4%). On the other<br />
hand, values for specific foods can be affected by considerably<br />
more (up to 30%; for example, those rich in certain<br />
types of protein and ‘fibre’ are used for weight reduction).<br />
These errors may fall outside the range permitted by<br />
legislation in the European Union (Commission, 2006). In<br />
addition, by comparison with the NME system different diets<br />
of the same ME value can be constructed that would result in<br />
differences of 10–15% (for example, diets rich in NSP or<br />
protein, as for example energy-restricted diets in which<br />
normal protein intake represents a high proportion of<br />
energy). Therefore, it would seem sensible to use a consistent<br />
method that is sound at all levels, so that the consumer, the<br />
nutritionist and the researcher are not misled. In addition, it<br />
should be remembered that physiological considerations<br />
that make a difference of only a few percent have already<br />
been taken into account in devising food energy systems, for<br />
example DE of the diet is greater than ME by a few percent,<br />
which is similar to the extent to which ME is greater than<br />
NME. Furthermore, as indicated above, early inaccuracies in<br />
energy values for ‘fibre’/NSP and polyols have been<br />
corrected, even though the changes make only a few percent<br />
difference to the total energy value of the diet. An early<br />
example of implementing small changes involves the Atwater<br />
energy factors that replaced the earlier Rubner factors,<br />
for example 2.5% difference for combustible energy of<br />
carbohydrate. Another argument is that errors associated<br />
with measurement of dietary intake and potential errors<br />
associated with the development of RS after cooking are<br />
sources of greater error than the use of the ME system instead<br />
of the NME system. This poses a problem for analysts and<br />
those compiling food composition tables, However, it is<br />
reasonable to suggest that food-labelling policy should aim<br />
to establish a system that avoids bias as far as possible using a<br />
practical user-friendly system. It has also been argued that an<br />
enormous amount of work would have to be undertaken to<br />
change the current ME system into an NME system. On the<br />
other hand, if an attempt is to be made to establish either a<br />
consistent ME or an NME system, some changes will be<br />
necessary. If this involves conversion to a consistent NME<br />
system, the additional changes may not be as great<br />
as anticipated, as the following three equations (round<br />
numbers) indicate.
ME (Atwater general system) (Merill and Watt, 1973) ¼<br />
37F þ 17CHO total þ 17P.<br />
ME (modified Atwater general system) (Livesey, 1991) ¼<br />
37F þ 16CHOavailable* þ 8CHO unavailable þ 17P.<br />
NME (Livesey, 2001) ¼<br />
37F þ 16CHOavailable* þ 6CHO unavailable þ 13P.<br />
In these equations, ME and NME are in kJ, the coefficients<br />
are in kJ/g, and F, P and CHO are in g of fat, protein and<br />
carbohydrate, which may be available or unavailable ( * ¼ as<br />
monosaccharide equivalents).<br />
The key issues are the extent to which the underlying<br />
physiological considerations are sound, the extent to which<br />
they should drive food-labelling policy and the extent to<br />
which food energy system(s) should become consistent<br />
within and between regional jurisdictions.<br />
Carbohydrates, feeding behaviour and energy<br />
balance<br />
The above discussion regarding energy values of carbohydrates<br />
and energy balance equations gives no indication<br />
about physiological processes that control voluntary food<br />
intake and energy expenditure in different environments.<br />
Do carbohydrates play a special role in processes that affect<br />
energy balance? Many theories of appetite regulation and<br />
energy homeostasis have been proposed, with carbohydrates<br />
playing a key role in several of them. None of these theories<br />
are universally accepted. Some have evolved over time and a<br />
few are continuing to do so. The literature is vast, and<br />
therefore only a brief overview of certain aspects of<br />
carbohydrates physiology will be discussed in this paper.<br />
Since there seems to be so much confusion and conflicting<br />
advice being given to the consumer about the types of foods<br />
that should be used for weight control and energy homeostasis,<br />
the origins of some concepts and the mechanisms<br />
involved are also discussed. This provides a platform for<br />
considering future research. It is worth emphasizing that<br />
despite the widespread use of a large number of diets that<br />
vary in macronutrient composition, there is continued<br />
growth of obesity and overweight. If a diet was associated<br />
with long-term compliance and overwhelmingly successful<br />
reduction in weight, a decrease in the prevalence of<br />
overweight and obesity might be expected. Several randomized<br />
and non-randomized controlled trials have reported<br />
weight reduction over several months when low fat (highcarbohydrate<br />
diets) are used. A review of four separate metaanalyses<br />
of low-fat vs control diets (or the relationship<br />
between the fat content of the diet and weight loss) (Astrup<br />
et al., 2002) reported greater weight loss with the low-fat<br />
diets, and one meta-analysis reported a dose–response<br />
relationship between reduction in percent dietary fat intake<br />
and weight loss. And yet, these results raise a conundrum,<br />
firstly because the meta-analyses consistently show weight<br />
Physiological aspects of energy metabolism<br />
M Elia and JH Cummings<br />
loss (generally only slight to modest mean weight loss of<br />
B2–3 kg), whereas in the general population there is<br />
progressive weight gain; and secondly because the percent<br />
fat intake in the United Kingdom (Henderson et al., 2003)<br />
and the United States (Centres for Disease Control and<br />
Prevention (CDC), 2004) appears to have decreased in recent<br />
years, while obesity and overweight have increased. Several<br />
questions arise from these simple observations. Would the<br />
growth of obesity have been greater if there was no decrease<br />
in the percent fat intake? Is the study population representative<br />
of the general population (for example, one metaanalysis<br />
included separate studies of patients with breast<br />
dysplasia, breast cancer and hypercholesterolaemia (Astrup<br />
et al., 2000))? Are confounding variables such as physical<br />
activity adequately controlled for? Is the dietary compliance<br />
under the study conditions of randomized controlled trials<br />
better than non-study conditions? If the studies had been<br />
extended over longer periods, would there have been a<br />
decrease in dietary compliance (for example, one systematic<br />
review included studies that lasted for only 3 weeks; Yu-Poth<br />
et al., 1999)? Are the effects of these diets mediated by energy<br />
density rather than macronutrient composition (low-fat<br />
diets, especially those rich in fibre tend to have a low-energy<br />
density)? Do the types of carbohydrates used in the diets of<br />
studies carried out over the past 20 or more years reflect<br />
those currently ingested (for example, carbohydrates in soft<br />
drinks and other food items have changed over time)? This<br />
section examines some of these issues from a physiological<br />
perspective, focusing on appetite regulation. It is of course<br />
recognized that there is considerable scope for interaction<br />
between feeding behaviour and other confounding factors<br />
that affect energy expenditure. This section does not aim to<br />
provide a detailed summary of the effectiveness or advantages<br />
and disadvantages of the large number of popular<br />
weight-reducing diets (reviewed elsewhere; Freedman et al.,<br />
2001), some of which may suit certain individuals more than<br />
others. It primarily aims to establish some links between<br />
physiology and clinical/public health nutrition, through<br />
examination of feeding behaviour, which has a key role in<br />
energy homeostasis. To do this, it is first necessary to place<br />
the scientific issues in perspective by considering the extent<br />
to which energy balance is regulated in man.<br />
The extent to which energy balance is regulated<br />
Figure 3 shows that the cumulative energy intakes of a<br />
reference male and reference female, both of which were<br />
established using the UK-recommended ME intakes (Department<br />
of Health, 1991). The figure indicates that 231 GJ<br />
(231 000 MJ) are ingested during a lifetime of 75 years by the<br />
reference male, and 196 GJ (196 000 MJ) by the reference<br />
female. Since the ME of stored fat is B39.4 MJ/kg and that of<br />
fat-free tissue is B3.8 MJ/kg (of which o0.1 MJ/kg is in the<br />
form of glycogen), it can be calculated that the total energy<br />
content of a 65 kg man (15% fat) is 0.594 GJ. This<br />
corresponds to 15.6% of the annual energy intake of a man<br />
S51<br />
European Journal of Clinical Nutrition
S52<br />
Cumulative energy intake<br />
(GJ)<br />
Cumulative energy intake<br />
(GJ)<br />
250<br />
200<br />
150<br />
100<br />
50<br />
0<br />
200<br />
150<br />
100<br />
50<br />
Males<br />
CHO<br />
aged 20–50 years. An energy imbalance that halves the body<br />
mass index (BMI) from 20 to 10 kg/m 2 (barely compatible<br />
with life) and that halves body weight from 65 (15% fat;<br />
7.25 kg fat) to 32.5 kg (1.54% fat or 0.5 kg fat) corresponds to<br />
only 0.49 GJ. This is equivalent to only 0.21% of the total ME<br />
intake over a lifetime (or 0.42% of the ME of carbohydrate<br />
intake over a lifetime). It is also equivalent to 0.26% of the<br />
intake during adult life, and 1.3% of the intake over 10 years<br />
of adult life (for example, between 30 and 40 years of age).<br />
The dot by the side of Figure 3 is scaled to correspond to<br />
approximately 1% of the final cumulative intake. These<br />
considerations suggest that any effective regulatory physiological<br />
system (without assumptions about the type or level<br />
of regulation or specific drivers used in regulation; Stock,<br />
1999; Spiegelman and Flier, 2001; Liu et al., 2003; Druce and<br />
Bloom, 2006) must achieve much better results than the<br />
small percentages indicated above, if good health is to be<br />
maintained. Similar calculations can be made for increments<br />
in body weight. An energy imbalance that doubles the BMI<br />
of a man (from 20 to 40 kg/m 2 ) and doubles body weight<br />
(from 65 kg (15% fat) to 130 kg fat (45% fat)) corresponds to<br />
1.98 GJ, which is less than 1% of the total energy intake over<br />
a lifetime (less than 2% of carbohydrate intake), almost<br />
P<br />
Fat<br />
0 10 20 30 40<br />
Age<br />
50 60 70<br />
Females<br />
Fat<br />
CHO<br />
0<br />
0 10 20 30 40<br />
Age<br />
50 60 70<br />
Figure 3 The cumulative energy intake (1 GJ ¼ 1000 MJ) of<br />
reference male and female (based on reference nutrient intake;<br />
Department of Health, 1991) and its distribution between carbohydrate<br />
(CHO; 55% of total intake), fat (35% of total energy intake)<br />
and protein (P; 15% of total energy intake). The arrow points to a<br />
dot that corresponds to approximately 1% of the cumulative energy<br />
intake at 75 years, which if deposited, would double adult body<br />
weight and body mass index.<br />
European Journal of Clinical Nutrition<br />
Physiological aspects of energy metabolism<br />
M Elia and JH Cummings<br />
P<br />
.<br />
.<br />
exactly 1% if this occurred during adult life, and 2.5% if it<br />
occurred over 30 years, between 20 and 50 years of age.<br />
Again, with a view to maintain good health, any effective<br />
regulatory system must achieve very much better results<br />
than these calculations indicate. The alarming increase in<br />
the number of grossly obese individuals in high-income<br />
countries, and to a lesser extent in low-income countries,<br />
argues against the operation of a tightly regulated physiological<br />
system(s) of long-term energy homeostasis to maintain<br />
optimal health in the modern environment. Short-term<br />
regulation of energy balance is probably less precisely<br />
regulated, perhaps reflecting an advantage during evolutionary<br />
development, to store excess energy when food is<br />
available for subsequent use when it is not readily available.<br />
Carbohydrate-specific models of feeding behaviour<br />
Carbohydrate-specific models of feeding behaviour have<br />
been prominent in the last 50 years. Many models established<br />
testable hypotheses, which have been examined, and<br />
through this examination new concepts about energy<br />
homeostasis have emerged. Mayer’s original glucostatic<br />
theory (Mayer, 1955), which was published in 1955,<br />
suggested that regulation of energy balance predominantly<br />
involved short-term ‘glucostatic’ responses that could be<br />
modified by longer term ‘lipostatic’ responses. Russek (1963,<br />
1976) went on to establish the hepatostatic theory in 1963<br />
by postulating the presence of receptors in the liver. Other<br />
studies suggested that 6–12% fall in plasma glucose concentration<br />
predicts meal initiation in animals (Campfield<br />
and Smith, 1990; 2003) and humans (Campfield et al., 1992;<br />
Campfield and Smith, 2003). Simple relationships do not<br />
necessarily prove causality, although infusions of glucose in<br />
animals to prevent the drop in circulating glucose concentrations<br />
were found to delay feeding behaviour. Irrespective<br />
of the regulatory mechanisms, there would be a clear<br />
advantage in coupling oxidative metabolism (energy expenditure)<br />
with feeding behaviour (energy intake). Over the last<br />
25 years, arguments have been put forward that the<br />
oxidation (or deposition) of specific macronutrients, especially<br />
carbohydrates, have a disproportionately large effect<br />
on feeding behaviour. The arguments are set out below.<br />
(1) Macronutrients have different propensities to being<br />
oxidized and stored. Alcohol is not stored at all, and<br />
therefore it has to be oxidized (very little is excreted<br />
unchanged). Protein is also readily oxidized, since little<br />
of it, if any, is accreted into the tissues of non-growing<br />
individuals in a range of pools with varying size, rates of<br />
turnover and ‘lability’. Only a small proportion of<br />
ingested protein is retained during development of<br />
muscular hypertrophy from physical training and during<br />
development of obesity (obese individuals have more<br />
muscle to support the extra body, the heart hypertrophies<br />
as its cardiac output increases and organs may also<br />
enlarge). Carbohydrate stores, which are limited
(o0.8 kg in the adult), increase after ingestion of a mixed<br />
meal (Elia et al., 1988), but much, if not all of the<br />
increased store, may be mobilized for oxidative purposes<br />
before the next meal. The increased post-prandial oxidation<br />
of carbohydrate contrasts with decreased oxidation<br />
of fat, which is the main storage form of energy<br />
(Elia et al., 1988). Fat too can be oxidized before the next<br />
meal, but excess energy intake over time is predominantly<br />
stored as fat, which has very large potential<br />
storage capacity, rather than carbohydrate, which has<br />
a limited storage capacity. Therefore, the oxidative<br />
hierarchy of fuels (alcohol, protein, carbohydrate and<br />
fat) is associated with the reverse hierarchy in storage,<br />
with carbohydrates occupying a fairly central position.<br />
(2) A number of workers have attempted to examine the<br />
relative satiating efficiency of different macronutrients.<br />
They reported that protein is more satiating than<br />
carbohydrate, which in turn is more satiating than fat<br />
(alcohol is enigmatic in that it may actually stimulate<br />
appetite in some circumstances). This hierarchy was<br />
reported to occur at a community level, elucidated<br />
through surveys of dietary intake (de Castro and de<br />
Castro, 1989; de Castro, 1991) (a limitation of such<br />
studies is possible misreporting of dietary intake) and<br />
also at the laboratory level (Weststrate, 1992), where<br />
dietary intake is usually measured by the researchers. It<br />
has also been reported to occur at the level of nutrient<br />
balance in subjects ingesting an oral diet (Stubbs et al.,<br />
1995b) as well as in those receiving nutrients intravenously<br />
(Gil et al., 1991). The results of some of the<br />
macronutrient balance studies undertaken in metabolic<br />
centres do not appear to be simply due to differences in<br />
sensory cues. For example, in a study of men who were<br />
studied on three separate occasions so that they could<br />
receive a high carbohydrate (low fat), medium carbohydrate<br />
(medium fat), or low carbohydrate (high fat) diet,<br />
differences in sensory cues (taste, smell) were minimized<br />
by covertly manipulating the diets (Stubbs et al., 1995a).<br />
The proportion of energy from protein was kept constant<br />
across all diets, but the energy density decreased<br />
progressively as proportion of energy from carbohydrate<br />
increased. The subjects ate these covertly manipulated<br />
diets ad libitum while in a whole body calorimeter for 7<br />
days. Average daily balances were 2.58, 0.77 and<br />
0.27 MJ/day on the low-, medium- and high-carbohydrate<br />
diets, respectively. Carbohydrate appeared to be<br />
more satiating than fat. It also appeared that oxidation<br />
of carbohydrate and protein predicted the subsequent<br />
day’s intake better than fat oxidation. The effects on<br />
energy balance persisted through the entire 7-day period<br />
of study, apparently without compensation as the study<br />
progressed. Other studies suggested that protein, which<br />
has even less ‘storage capacity’ than carbohydrate, is also<br />
more satiating than fat, and probably also more satiating<br />
than carbohydrate, especially when protein is ingested<br />
in large quantities (41.2 MJ per meal) (Weststrate, 1992).<br />
Physiological aspects of energy metabolism<br />
M Elia and JH Cummings<br />
From such studies, it appeared that macronutrients such<br />
as carbohydrate and protein, whose balance is most<br />
tightly regulated, exerted greater suppressive effects on<br />
subsequent energy intake than fat, the balance of which<br />
is not so tightly regulated.<br />
(3) If the macronutrient hierarchy in satiation parallels the<br />
macronutrient hierarchy in oxidation (inversely with the<br />
hierarchy in storage), as several studies suggest, the<br />
possibility exists that the two are causally linked. In<br />
examining this hypothesis, it is necessary to consider at<br />
least two issues: (i) plausible mechanisms by which such<br />
effects might be mediated and (ii) whether the macronutrient<br />
hierarchy on satiety are independent of the<br />
energy density of the diet.<br />
Potential mechanisms by which oxidation and storage are linked<br />
to feeding behaviour. A large number of potential mechanisms<br />
may be invoked in carbohydrate-specific models of<br />
eating behaviour. A basic consideration is whether the sensor<br />
is linked predominantly to storage of specific macronutrients<br />
(glycogen in the case of carbohydrate) or oxidation.<br />
Flatt (1987) suggested that glycogen exerts a strong<br />
negative feedback on energy intake, giving rise to the<br />
glycogenostatic model of appetite regulation. The model,<br />
which was developed from observations in rodents, has its<br />
attractions because changes in carbohydrate stores can occur<br />
rapidly, from meal to meal, and are associated with changes<br />
in carbohydrate oxidation. Therefore, the model could<br />
provide a plausible physiological basis for feeding behaviour,<br />
which typically involves ingestion of carbohydrate as the<br />
major macronutrient. However, the model does not distinguish<br />
between liver, which is rapidly lost during starvation,<br />
and muscle glycogen, which appears to be depleted slowly<br />
compared to muscle rapidly depleted during fasting in which<br />
does not appear to be rapidly lost during starvation (rodents<br />
muscle glycogen appears to be depleted much faster during<br />
short-term starvation than in human). In addition, several<br />
human studies have examined the predictions of this model,<br />
and in some circumstances they were unable to confirm<br />
them. For example, changes in feeding behaviour induced by<br />
dietary manipulations that change carbohydrate stores,<br />
without necessarily altering energy balance, or vice versa,<br />
cannot be readily explained by the glycogenostatic theory<br />
(van Stratum et al., 1978; Shetty et al., 1994; Stubbs et al.,<br />
1995a, 1996; Snitker et al., 1997). Some of these studies<br />
found that oxidation of all three macronutrients are<br />
considerably better at predicting subsequent energy intake<br />
than carbohydrate alone (Stubbs et al., 1995b).<br />
The putative signal(s) and sensor(s) associated with the<br />
glycogenostatic model have also not been identified.<br />
Another approach is to examine the effect of blocking<br />
oxidative pathways, either individually or in combination.<br />
Friedman and Stricker (1976) proposed a model that was<br />
based on the balance between oxidation and storage of fuels.<br />
They established an integrative macronutrient model of<br />
S53<br />
European Journal of Clinical Nutrition
S54<br />
feeding behaviour, which was consistent with pharmacological<br />
inhibition of metabolic pathways. However, the model<br />
does not specify the metabolic sensor(s), and therefore a<br />
number of general questions arise. How are fuel oxidation<br />
and/or storage detected? Can the oxidation of one fuel be<br />
distinguished from that of another (a necessary consideration<br />
in macronutrient-specific models) and how are signals<br />
integrated to influence feeding behaviour? Another basic<br />
issue is whether it is oxidation of fuels per se or oxidative<br />
phosphorylation (for example, ATP (or other related substances)<br />
that is primarily responsible for feeding behaviour.<br />
The use of drugs that uncouple oxidative phosphorylation,<br />
causing a major increase in oxidation of nutrients without<br />
an increase in ATP generation, could be used as tools for<br />
addressing this last issue. Dinitrophenol administration<br />
in humans was found to have a linear relationship with<br />
metabolic rate and weight loss, so that at a dose of 0.5 g/day<br />
it increased metabolic rate by about 50% and decreased body<br />
weight by almost 1 kg/week (Tainter et al., 1935; Harper et al.,<br />
2001). The use of dinitrophenol to treat obesity in the United<br />
States in the 1930s (Tainter et al., 1935; Harper et al., 2001)<br />
made some subjects very hungry during treatment. If this<br />
were a general effect, it would suggest that oxidation of fuels<br />
per se, was not responsible for providing feedback on energy<br />
intake, and that oxidative phosphorylation was more likely<br />
to be the cause. However, the information on the effects of<br />
dinitrophenol in humans is far from clear, since some<br />
subjects became less hungry during treatment, so that in<br />
reality there was no consistent overall effect on appetite. It is<br />
difficult to assess the significance of these briefly reported<br />
observations, partly because no measurements of dietary<br />
intake were made, and partly because dinitrophenol can<br />
cause a range of side effects which suppress appetite (for<br />
example, nausea, gastrointestinal symptoms, loss of taste<br />
(especially for salt and sweet), skin rashes and a variety of<br />
other symptoms) (Rabinowitch and Fowler, 1934; Tainter<br />
et al., 1935; Harper et al., 2001). In addition, uncoupling<br />
oxidative phosphorylation would not distinguish between<br />
carbohydrates and fat because both are uncoupled by<br />
dinotrophenol.<br />
The effect of blocking specific oxidative pathways on<br />
eating behaviour has also been examined. For example,<br />
humans experience increased hunger when given 2-deoxyglucose<br />
(50 mg/kg body weight), which blocks glucose<br />
oxidation by competitively inhibiting phosphohexose isomerase<br />
(EC 5.3.1.9), an enzyme that catalyses one of the<br />
early steps of the glycolytic pathway (Thompson and<br />
Campbell, 1977; Welle et al., 1980; Thompson et al., 1982).<br />
When rats were given 2-deoxyglucose, a dose-dependent<br />
increase in food intake was observed (Friedman and Tordoff,<br />
1986). When rats are given methyl palmoxirate, which<br />
blocks fat oxidation by inhibiting the transport of longchain<br />
fatty acids across the inner mitochondrial membrane<br />
(necessary for mitochondrial fat oxidation), there was also<br />
an increase in food intake (Friedman et al., 1990). Separate<br />
sensory systems for detecting carbohydrate and fat oxidation<br />
European Journal of Clinical Nutrition<br />
Physiological aspects of energy metabolism<br />
M Elia and JH Cummings<br />
have been identified through investigations that have<br />
combined surgical lesions of the nervous system and<br />
administration of pharmacological agents that inhibit either<br />
fat or carbohydrate oxidation (Titter and Calingasan, 1994).<br />
Some inhibitors of glucose oxidation act both centrally in<br />
the brain and peripherally (2-deoxyglucose), whereas others<br />
do not penetrate the blood–brain barrier, and therefore<br />
inhibit glucose oxidation only in peripheral tissues (for<br />
example, 2.5-anhydro-D mannitol). Investigations using<br />
such tools suggest that fatty acid oxidation is monitored<br />
peripherally, whereas glucose oxidation is monitored both<br />
peripherally and centrally. The area postrema and nucleus of<br />
the solitary tract receive signals from both systems (the vagus<br />
nerve relays signals from the periphery). However, lesions<br />
that destroy the sensory but not the motor nucleus abolishes<br />
mercaptoacetate (lipoprivic), but not the 2-deoxyglucose<br />
(glucoprivic)-induced feeding. It is not clear to what extent<br />
these distinct pathways, and their interactions, which have<br />
been identified in animals (Titter and Calingasan, 1994), also<br />
operate in humans.<br />
Feeding behaviour and energy density. Several of the studies<br />
that established a satiating hierarchy of macronutrients did<br />
not control the energy density of the diet. Since highcarbohydrate/low-fat<br />
diets tend to be less energy dense than<br />
low-carbohydrate/high-fat diets, it is possible that energy<br />
density rather than a macronutrient hierarchy is responsible<br />
for many of the differential effects on satiety. If this were the<br />
case generally, macronutrient-specific models of feeding<br />
behaviour would decline in importance and give way to<br />
new alternatives, but perhaps complementary models of<br />
feeding behaviour. Few long-term physiological studies have<br />
been undertaken to address this specific issue, but two are<br />
noteworthy. The first is the study of van Stratum et al. (1978),<br />
which was already published at the time when the macronutrient<br />
hierarchy and glycogenostatic models of feeding<br />
behaviour were being actively explored. It reported that<br />
isoenergetically dense high-fat and high-carbohydrate diets<br />
had similar effects on energy intake over 2 weeks in 22<br />
Trappistine nuns. The second study of Stubbs et al. (1996),<br />
involving men who were also studied over a period of 2<br />
weeks, confirmed the results obtained on the Trappistine<br />
nuns. Both of these studies covertly manipulated the diets to<br />
conceal taste differences. A number of short-term studies<br />
(Johnstone et al., 1996; Stubbs et al., 1996), including those<br />
involving single preloads (Stubbs et al., 1996), found that<br />
there may still be some subtle macronutrient effects that are<br />
independent of energy density. Protein was still considered<br />
by some workers to be more satiating than other macronutrients<br />
when taken in doses of 41.2 MJ per meal<br />
(Weststrate, 1992), although even this was challenged by a<br />
recent short-term study with a crossover design (Raben et al.,<br />
2003). It measured the ad libitum intake of a high-protein,<br />
high-carbohydrate, high-fat and high-alcohol meals over a<br />
period of 5 h in the same subjects on separate occasions. The<br />
energy intake from the high-protein meal, which included
B1.4 MJ from protein in men, did not differ significantly<br />
from the other meals, which had similar energy density and<br />
‘dietary fibre’ content (although they differed in their<br />
sensory attributes, such as taste and after taste). There was<br />
also no difference in intake among the 10 women who<br />
consumed B0.7 MJ of protein from the high-protein meal.<br />
This study did not covertly manipulate the meals to conceal<br />
taste. Nevertheless, all the above observations taken together<br />
raise questions about the predictive value of macronutrient-specific<br />
models of feeding behaviour, at least under<br />
laboratory conditions, which may not necessarily apply to<br />
free-living conditions, for reasons that will emerge later.<br />
Inevitably, attention is focused on the weight and energy<br />
density of foods, including ready-to-eat foods, which have<br />
recently flooded the market in developed countries.<br />
Before considering these issues further, it is worth briefly<br />
reflecting on the likely limitations of physiological processes<br />
controlling feeding behaviour that place disproportionate<br />
importance on a single nutrient (for example, carbohydrate).<br />
Such a system would regulate energy balance poorly because<br />
it would be unable to adapt adequately to situations<br />
associated with changes in the proportions of different<br />
macronutrients in the food supply. Therefore, it is not<br />
surprising that specific macronutrient models of feeding<br />
behaviour were not found to be robust in some circumstances,<br />
particularly those involving covert manipulation of<br />
diets with the same energy density but different macronutrient<br />
composition (see above). In addition, pharmacological<br />
inhibition of both fat and glucose oxidation in animals were<br />
found to elicit a massive increase in food intake, compared to<br />
inhibition of either fat or carbohydrate oxidative pathways<br />
(Friedman and Tordoff, 1986). This suggests that the<br />
regulatory system is responsive to oxidation of both fat<br />
and carbohydrate, and that oxidation of each substrate<br />
compensates for the other, when the availability of one of<br />
them is reduced. Therefore, eating behaviour does not<br />
unconditionally depend on the oxidation of one nutrient,<br />
and indeed it would be surprising if it did. Furthermore, the<br />
satiating effect of the Eskimo diet (fat and protein) (Mowat,<br />
1981) would argue against the operation of a simple<br />
carbohydrate oxidation or storage model of feeding behaviour<br />
to the exclusion of other macronutrients.<br />
Energy density, weight of food and carbohydrates<br />
Several reports suggest that under ad libitum feeding conditions<br />
(mainly under laboratory conditions), people tend to<br />
consume a fixed weight or volume of food (Duncan et al.,<br />
1983; Lissner et al., 1987; Tremblay et al., 1991; Tremblay,<br />
1992; Poppitt, 1995; Rolls and Bell, 1999; Bell and Rolls,<br />
2001). This implies that when foods or diets differ in energy<br />
density, energy intake will be affected. Indeed, it has been<br />
suggested that this is a major mechanism for determining<br />
energy intake at different stages of the life cycle (for example,<br />
compared to young adults, older adults reduce energy intake<br />
by largely decreasing the energy density of the food eaten). If<br />
Physiological aspects of energy metabolism<br />
M Elia and JH Cummings<br />
satiety was mainly determined by the weight of food eaten,<br />
then those who consume high-energy density foods would<br />
be expected to feel satiated only after increased energy<br />
intake, whereas those consuming low-energy density foods<br />
would feel satiated despite lower energy intake. This<br />
argument has been promoted by several workers (Poppitt,<br />
1995; Poppitt and Prentice, 1996; Prentice and Poppitt, 1996;<br />
Rolls and Bell, 1999). It is argued that in real-life energy<br />
dense foods tend to be more palatable and less satiating than<br />
foods with low-energy density. Typically, palatable snacks are<br />
energy dense, and those rich in both fat and available<br />
carbohydrates, which are rapidly digested and absorbed, are<br />
said to be particularly palatable (Drewnowski, 1998). Interestingly,<br />
available carbohydrate and fat also provide more<br />
NME per unit ME than does the diet as a whole or either<br />
protein or NSP or other carbohydrates fermented in the large<br />
bowel. Therefore, when using the ME system, high-fat, highavailable<br />
carbohydrate foods (or diets) are more fattening<br />
than isoenergetic high-protein, high-fibre foods. In addition,<br />
foods of low-energy density (often rich in NSP and water)<br />
were less palatable in these studies.<br />
An examination of 1032 foods revealed that the strongest<br />
predictors of energy density are water, which is negatively<br />
related to energy density, and fat (g per 100 g food), which is<br />
positively related to energy density (Stubbs et al., 2000). The<br />
carbohydrate and protein content of foods (g per 100 g food)<br />
are both positively related to energy density, but the<br />
association is much weaker than those obtained with fat or<br />
water (Figure 4). This weak relationship with carbohydrate is<br />
understandable because it is possible for foods containing a<br />
large proportion of energy from carbohydrate to have either<br />
a low-energy density (for example, vegetables) or highenergy<br />
density (some sweet snacks). Diet surveys do not<br />
generally report the energy density of the food eaten, and<br />
this precludes extensive analyses and interpretation of data<br />
Energy density (kJ/100g)<br />
4000<br />
3500<br />
3000<br />
2500<br />
2000<br />
1500<br />
1000<br />
500<br />
0<br />
0 25 50<br />
Weight (g/100g)<br />
75 100<br />
Fat (r 2 =75)<br />
Protein (r 2 =13.9)<br />
Carbohydrate (r 2 =1.9)<br />
Water (r 2 =66.7)<br />
Figure 4 Relationship between energy density (outcome variable)<br />
and % weight of dietary macronutrients and water of 1032 readyto-eat<br />
foods (Stubbs et al., 2000). The prediction equations<br />
are as follows: Energy density (ED) ¼ 462.6 þ (35.5 fat); ED ¼<br />
781.4 þ (12.2 protein); ED ¼ 654.5 þ (12.5 carbohydrate); and<br />
ED ¼ 2034–(21.2 water). The values in parentheses, derived from<br />
regression are r 2 100.<br />
S55<br />
European Journal of Clinical Nutrition
S56<br />
Physiological aspects of energy metabolism<br />
M Elia and JH Cummings<br />
in free-living conditions. However, below is a summary of<br />
some observations, including some in free-living conditions,<br />
which need to be taken into account in models of<br />
energy homeostasis in free-living conditions. The role of<br />
different types of carbohydrates on satiety, energy intake and<br />
energy balance are then considered in the light of these<br />
observations.<br />
(1) The idea that energy intake and energy balance are<br />
largely determined by energy density or weight of food<br />
eaten has enormous implications for the control of<br />
feeding behaviour and energy balance, because it implies<br />
that normally energy intake is a secondary or passive<br />
manifestation of the drive to eat a constant weight of<br />
food. This would not be an ideal evolutionary strategy<br />
for survival. The energy density of the food eaten by our<br />
ancestors is likely to have varied from a low-energy<br />
density (berries, fruits) to high-energy density (fatty fish,<br />
animal meat and fat), depending on location, season and<br />
other environmental changes, including natural disasters.<br />
Too much reliance on weight of food eaten, rather<br />
than on energy eaten, would bring about poor regulation<br />
in energy homeostasis, at least in the long term.<br />
(2) A recent epidemiological study (Ledikwe et al., 2006)<br />
reported that US adults consuming a low-energy-dense<br />
diet are likely to consume more food by weight, and at<br />
the same time less energy intake (assessed by 24 h recall)<br />
than those consuming a higher energy-dense diet.<br />
Normal weight individuals were found to consume diets<br />
with a lower energy density than obese individuals, but<br />
causality is difficult to assess from the available information.<br />
This study is of course subject to potential problems<br />
associated with misreporting, which are briefly discussed<br />
below.<br />
(3) If free-living individuals primarily eat a constant weight<br />
of food, with energy intake as a passive outcome, then<br />
the within-subject day-to-day coefficient of variation for<br />
weight of food ingested would be expected to be lower<br />
than that for energy intake. This was not found to be the<br />
case. In an analysis of 7-day-weighed food intakes in 73<br />
subjects, the coefficients of variation were found to be<br />
slightly higher for weight of food ingested rather than<br />
energy intake (23 vs 21%, respectively, or 21 vs 20.5%,<br />
when drinks were added in the analysis) (Stubbs et al.,<br />
2000; Stubbs and Whybrow, 2004). It would be valuable<br />
to know the extent to which coefficients of variation of<br />
ingested energy relative to ingested weight of food<br />
depended on the environmental conditions. Studies to<br />
address this issue are subject to the problem of<br />
misreporting of dietary intake. One review concluded<br />
that there is no accurate method of measuring dietary<br />
intake (Westerterp and Goris, 2002). Another extensive<br />
review (Livingstone and Black, 2003) expressed dietary<br />
energy intake per day as a fraction of energy expenditure<br />
measured by the doubly labelled water method. The<br />
results for 7-day-weighed food intake were variable<br />
European Journal of Clinical Nutrition<br />
according to the study. For example, in one study in<br />
women aged 60 years, the values were 1.0770.08 (s.d.)<br />
in unrestrained eaters and 0.9470.05 in restrained eaters<br />
(Bathalon et al., 2000), whereas in another study<br />
(Kaskoun et al., 1994) in 15 and 18-year-old males, the<br />
value was 0.7770.023.<br />
(4) Laboratory studies have been undertaken in which diets<br />
with different energy densities are covertly manipulated<br />
to maintain the same palatability (Titter and Calingasan,<br />
1994). In such environments, studies suggest that a large<br />
proportion of the variability in energy intake (440%)<br />
can be explained by energy density of the diet (Prentice<br />
and Poppitt, 1996; Rolls and Bell, 1999; Stubbs et al.,<br />
2000) compared to only a much smaller proportion in<br />
free-living conditions (for example, only 7% according<br />
to one study; Stubbs and Whybrow, 2004). There are<br />
several possible explanations for the discrepancy between<br />
laboratory and free-living studies. (i) It is easier to<br />
covertly manipulate diets of different energy densities or<br />
macronutrient composition at the lower end of the<br />
energy density range. Studies that have varied the energy<br />
density of foods at constant palatability (Drewnowski,<br />
1998) have used diets containing 2.5–4.4 kJ/g and<br />
compared them with diets containing 5.6–7.0 kJ/g. They<br />
have not extended to the higher energy density range.<br />
To give the readers a feel for the energy density of<br />
specific foods that can make up diets, here are some<br />
values: chocolate cake, hamburger and chips, which can<br />
make up a meal, fall in the range of 12–18 kJ/g;<br />
chocolate, decreases in the range of 22–24 kJ/g; raw<br />
vegetables and soft drinks B2 kJ/g for; the full potential<br />
range is from 0 (water) to B39 kJ/g (pure oil or fat). This<br />
means that the energy density (and the variety) of foods/<br />
diets in free-living conditions are more variable than<br />
those predetermined (lower values) in the laboratory.<br />
There is also some evidence that specific macronutrient<br />
effects are more likely to exert effects at the lower end of<br />
the energy density spectrum (Westerterp-Plantenga,<br />
2001). (ii) Learned cues, which influence eating behaviour,<br />
are absent or dramatically reduced in laboratory<br />
studies, because such studies often use foods that are<br />
unfamiliar or covertly manipulated. (iii) Energy density<br />
is fixed in some laboratory conditions, but not usually in<br />
free-living conditions. (iv) Measurement of dietary<br />
intake is likely to be more accurate under laboratory<br />
than in free-living conditions. (iv) There appear to be a<br />
longer-term compensatory mechanisms for the increase<br />
in energy intake induced by ad libitum intake of highenergy-density<br />
foods (Stubbs et al., 2004). A reduction in<br />
the weight of food eaten appears to be an important<br />
compensatory mechanism. (v) Some free-living studies<br />
have reported an association between energy density of<br />
the diet and increased intake. A recent study (de Castro,<br />
2004) involving 952 subjects who provided 7-day food<br />
diaries, reported such a relationship, but found no<br />
relationship between energy density of the consumed
food and body weight, height or BMI. Since high-energy<br />
density appears to be related to greater overall intake in<br />
the short term, the author suggested that there may be<br />
compensation over the long term with no net effect on<br />
body size. An alternative possibility is that increased<br />
activity may determine the energy density of the diet:<br />
large volumes of bulky diets may be less acceptable to<br />
individuals who require a lot of energy.<br />
(5) Analyses of energy intake in free-living conditions using<br />
multiple regression models suggest that there are multiple<br />
determinants of energy intake, of which energy<br />
density is one, and percent energy from individual<br />
macronutrients, including carbohydrate, is another<br />
(Stubbs and Whybrow, 2004). From this and other<br />
works, it appears that macronutrients have effects on<br />
energy intake that are independent of the energy density<br />
of the food consumed. One study reported that specific<br />
macronutrients influence intake, when foods contain<br />
little water (high-energy density) and not when they<br />
contain a lot of water (low-energy density) (Westerterp-<br />
Plantenga, 2001). This could provide an explanation<br />
why laboratory studies, which have covertly manipulated<br />
diets at the lower end of the energy density range,<br />
have a strong predictive effect on energy intake.<br />
(6) Substitution of sugar for artificial sweeteners offers a way<br />
of separating palatability from energy density of foods.<br />
But even here the effects are not clear-cut. For example,<br />
there is little epidemiological evidence to suggest that<br />
intense sweeteners are causally linked to BMI. In<br />
addition, most intervention studies with intense sweeteners<br />
are of short duration (less than 1 or 2 days, and<br />
often only a few hours), with the exception of a few<br />
studies, which suggested that the intense sweetener,<br />
aspartame, reduced energy intake in metabolic units<br />
(Porikos et al., 1977, 1982) or free-living conditions<br />
(Tordoff and Alleva, 1990a). Some short-term studies<br />
using drinks (Blundell and Rogers, 1994) or gum (Tordoff<br />
and Alleva, 1990b) suggested that intense sweeteners<br />
might actually stimulate appetite. One study found that<br />
aspartame-sweetened water transiently increased appetite<br />
in lean men, but aspartame-sweetened soft drinks<br />
suppressed appetite (Black et al., 1993; Black and<br />
Anderson, 1994). Other studies report that sweeteners<br />
have the same effect as water (Rogers et al., 1988; Rodin,<br />
1990; Canty and Chan, 1991), whereas others report<br />
suppression of overall intake when compared with soft<br />
drinks containing sugar (Rolls, 1997). Yet, other studies<br />
suggest that there is an increased intake when an<br />
unpalatable food item is made more palatable by<br />
addition of a sweetener. Methodological problems are<br />
at least partly responsible for the variable results<br />
obtained. In addition, the responses to sweet foods and<br />
drinks depend on dietary restraint (Lavin et al., 1997)<br />
and they can be conditioned. Intense sweeteners may<br />
mimic the ingestive effects of sugars on satiety but not<br />
the post-ingestive effects. For example, animal studies<br />
Physiological aspects of energy metabolism<br />
M Elia and JH Cummings<br />
suggest that initial dislike for a bitter taste of a sucrose<br />
octa acetate solution is reversed once the animals learn<br />
to associate this taste with positive post-ingestive effects<br />
(Sclafani, 1987, 2001). Finally, a 10-week study involving<br />
overweight men and women, who consumed 28% of<br />
their energy as sucrose (mostly as beverages), showed an<br />
increase in body weight (1.6 kg), which was not observed<br />
in a similar group of subjects who consumed artificial<br />
sweeteners (Raben et al., 2002).Overall it appears that<br />
intense sweeteners do not reliably affect appetite and<br />
energy intake, but more longer term studies in free-living<br />
conditions are required.<br />
From the above, it appears that the control of appetite<br />
operates through a redundant system that does not rely<br />
overwhelmingly on one or two major factors, such as energy<br />
density or on a specific macronutrient. Rather it depends on<br />
multiple factors that can interact, compensate or override<br />
each other, depending on environmental exposures and<br />
their duration. Given the fundamental importance of eating<br />
for survival, this is not surprising. The factors that influence<br />
eating behaviours include sensory factors, diet composition<br />
and variety of available food items, eating environment and<br />
individual subject characteristics, such as age, habitual<br />
dietary intake and prior social conditioning. It has been<br />
difficult to establish the relative importance of these factors,<br />
which are likely to differ with the environmental setting, for<br />
example, developed or developing countries. However, it is<br />
clear that feeding behaviour is influenced by both nutritional<br />
and non-nutritional factors. In addition, it appears<br />
that there is a good defence against development of underweight<br />
(in the absence of disease) (Garrow, 1988), but less<br />
good defence against development of overweight (Blundell<br />
and Stubbs, 1999), especially in an environment where the<br />
availability of abundant and varied food is coupled with<br />
limited physical activity. This defence needs to be very tight<br />
because deposition if only 1% of the lifetime cumulative<br />
energy intake were deposited in the reference male or female<br />
(equivalent to the dot by the side of Figure 3), it would<br />
double adult body weight and BMI, and adversely affect<br />
health.<br />
Effect of different types of carbohydrate on feeding behaviour and<br />
energy homeostasis<br />
With this background, the role of different types of<br />
carbohydrates on eating behaviour might not be expected<br />
to have overwhelming effects on long-term energy homeostasis.<br />
The following summary based on intervention<br />
studies is generally consistent with this view.<br />
Non-starch polysaccharides (dietary fibre). The majority of<br />
studies comparing the effects of carbohydrates on energy<br />
balance and weight loss have been undertaken with NSP in<br />
various forms, probably because there are several potential<br />
ways in which NSP might induce a negative energy balance.<br />
S57<br />
European Journal of Clinical Nutrition
S58<br />
The following are potential mechanisms: compared to<br />
available carbohydrates, NSP has a lower energy density<br />
(kJ/g; see above); foods containing NSP are often made from<br />
whole grains or whole foods such as fruit and vegetables and<br />
are thus bulky with a low-energy density, which may<br />
promote satiety; some types of NSP are viscous and can<br />
delay gastric emptying, causing feelings of increased fullness<br />
and satiety; NSP affects the intestinal absorption of other<br />
macronutrients, such as fat, although there is little evidence<br />
for significant losses in this way in humans; and delayed<br />
colonic metabolism of NSP after meal ingestion may delay<br />
the onset of hunger before the next meal (although the<br />
possible role of SCFAs and other potential signals from the<br />
colon appear to have been little investigated in humans).<br />
Results of more than 50 studies have been summarized in<br />
several reviews (Blundell and Burley, 1987; Stevens, 1988;<br />
Burley and Blundell, 1990; Levine and Billington, 1994), but<br />
it is difficult to establish firm overarching conclusions that<br />
apply to all circumstances. There are several reasons for this:<br />
the type and amount of NSP used in different studies have<br />
varied; the intervention has sometimes involved administration<br />
of tablets of extracted NSP and at other times diets<br />
rich in NSP; the age and adiposity of the study population<br />
have varied; and study designs have varied from open trials<br />
to double-blind control trials. Nevertheless, it appears that<br />
dietary supplementation with extracted NSP to a level that<br />
can be tolerated has at best a modest effect in reducing body<br />
weight over a period of several months or longer. Bulky NSPrich<br />
diets with a low-energy density might be expected to<br />
encourage weight loss, or prevent weight gain, by promoting<br />
satiety, but such diets are often less palatable and less likely<br />
to be consumed. Better modelling techniques of the available<br />
data, including dose–response curves (for example,<br />
studied by meta-regression), may shed further light on<br />
possible effects of NSP on energy intake and body weight.<br />
Starch and sugars. A few short-term preload studies have<br />
examined the effects of different types of hexose-based<br />
sugars on appetite and found little difference between them.<br />
Comparisons between sugars and high glycaemic index (GI)<br />
starches using short-term preloading protocols or 7-day<br />
protocols (Mazlam, 2001) suggest no major differences in<br />
satiety. However, a study comparing a high-starch diet with a<br />
high-sucrose diet found that the ad libitum intake over 14<br />
days was lower and weight loss greater with the high-starch<br />
diet than the high-sucrose diet, which scored better on<br />
palatability (Raben et al., 1997). Another study (Raben et al.,<br />
1994) found that exchange of digestible starch for RS in a<br />
meal reduced satiety as well as post-prandial glycaemia and<br />
insulinaemia. The authors acknowledged that the differences<br />
in satiety may be due to texture and palatability of the meal,<br />
but it can be difficult to separate the sensory properties of<br />
diets from their macronutrient composition. However, it<br />
appears from other studies that sensory-specific satiety is<br />
related more to the sensory characteristics of a food than to<br />
its macronutrient composition (Johnson and Vickers, 1993).<br />
European Journal of Clinical Nutrition<br />
Physiological aspects of energy metabolism<br />
M Elia and JH Cummings<br />
As indicated in section above, energy density (see section<br />
Energy density, weight of food and carbohydrates) is also a<br />
potentially confounding variable. There is a lack of longterm<br />
studies. The CARMEN multicentre trial (Saris et al.,<br />
2000) compared the effects of ad libitum intake of low-fat<br />
diets rich in either complex carbohydrates or simple<br />
carbohydrates. Body weight loss in the low-fat simple<br />
carbohydrate and low-fat complex carbohydrate groups did<br />
not differ significantly (0.9 and 1.8 kg, respectively). There<br />
were also no significant differences in circulating lipids.<br />
Since the distribution of complex carbohydrate between<br />
starch and NSP was not reported, it is not possible to assess<br />
the effects of starch vs sugars. Therefore, it appears that there<br />
is lack of convincing evidence from long-term studies that<br />
starch offers advantages over sugars in weight reduction.<br />
Polyols. There appears to be little information on the effect<br />
of polyols relative to other carbohydrates on weight loss or<br />
on satiety and other appetite sensations. One study found<br />
that replacement of sucrose with increasing doses of isomalt<br />
(12, 24 and 48 g per day), which is mostly unavailable<br />
carbohydrate, resulted in weight loss of about 2 kg over a<br />
period of 12 weeks (Spengler and Boehme, 1984).<br />
Low vs high glycaemic index (GI carbohydrates, foods and<br />
diets). Numerous reports have examined the role of different<br />
carbohydrates, foods and diets with varying GI on<br />
appetite and satiety (Raben et al., 1994; Anderson et al., 2002;<br />
Kaplan and Greenwood, 2002; Anderson and Woodend,<br />
2003; Ball et al., 2003), and weight control (Pawlak et al.,<br />
2002; Raben, 2002; Ludwig, 2003; Warren et al., 2003). The<br />
overall results do not appear to be consistent, although<br />
many short-term studies (o1 day) suggest that low-GI<br />
carbohydrates and foods promote satiety. One review<br />
concluded that short-term feeding trials generally show an<br />
inverse association between GI and satiety, and mediumterm<br />
clinical trials show less weight loss on high-GI (or high<br />
glycaemic load) diets compared to low-GI (or low glycaemic<br />
load) diets (Pawlak et al., 2002). However, the differences in<br />
weight between control and intervention groups were small.<br />
Another review (Pawlak et al., 2002) (presented as part of a<br />
debate) systematically examined 31 short-term studies (o1<br />
day) and reported that in 15 of these, low-GI foods promoted<br />
satiety or reduced hunger, and in the remaining 16 low-GI<br />
foods either reduced or made no difference to satiety. Low-GI<br />
foods reduced ad libitum food intake in seven studies, but did<br />
not do so in eight other studies. The same systematic review<br />
examined results from 20 longer term studies (up to 6<br />
months). Weight loss was favoured by the low-GI diets in<br />
four studies, by the high-GI diets in two studies and there<br />
was no significant difference between the low and high-GI<br />
diets in the remaining 14 studies. The average weight loss<br />
was only 1.5 kg on the low-GI diets and 1.6 kg on the high-GI<br />
diets. Not surprisingly, the author concluded that there was<br />
no evidence that low-GI foods were superior to high-GI<br />
foods for long-term weight control. The overall differences in
esults may relate not only to the duration of the studies, but<br />
also to the energy density and sensory attributes of foods or<br />
diets, as well as the age of subjects, which has ranged from<br />
the young age of pre-pubertal children (Warren et al., 2003)<br />
to that of elderly people . The sensory attributes of foods are<br />
particularly important in free-living studies, because poorly<br />
palatable diets are likely to be associated with poor<br />
compliance. The obligatory ingestion of a diet or a meal<br />
when used as a preload under short-term laboratory conditions<br />
may well produce different results when the same diet<br />
is promoted for longer term use under free-living conditions.<br />
Ingestion of such a diet is not obligatory in free-living<br />
conditions, and therefore a diet may show efficacy in<br />
laboratory conditions but not effectiveness in free-living<br />
conditions. In addition, a recent study (Alfenas and Mattes,<br />
2005) examined the effect of consuming only low- or high-<br />
GI foods ad libitum in the laboratory for 8 days in either high<br />
(three foods per meal) or low (one food per meal) variety<br />
conditions. It appeared that differential appetite sensations<br />
and glycaemic responses to foods tested in isolation were not<br />
preserved under conditions of longer term ad libitum<br />
ingestion of mixed meals. The potential interactions<br />
between different foods are much greater in free-living<br />
conditions than in laboratory conditions. In summary, the<br />
evidence suggesting that low-GI foods favour weight loss is<br />
stronger in short-term than in long-tem studies. It would be<br />
valuable to examine dose–response curves, especially in the<br />
long term, partly because there are fewer long-term studies,<br />
and partly because they are more relevant to health.<br />
Liquid vs solid carbohydrates. Several papers and reviews<br />
(Mattes, 1996, 2006; DiMeglio and Mattes, 2000) suggest<br />
that supplemental energy provided as carbohydrates in fluids<br />
is less precisely compensated than when solid foods are<br />
manipulated. The reasons for the difference in energy<br />
compensation are not clear but may involve the rate at<br />
which these are ingested (liquids can be ingested several<br />
times more rapidly than solid food items), their energy<br />
density and sensory attributes, and gastric emptying rates,<br />
which are generally faster for liquids than solids. Reactive<br />
hypoglycaemia may also be implicated. One short-term<br />
study lasting a few hours examined the effect of ingesting<br />
the same quantity of available carbohydrate at the same rate<br />
in the form of an apple, puree apple or juice without the cell<br />
wall material or ‘fibre’. The juice was less satiating than the<br />
puree, which in turn was less satiating than the apple. These<br />
changes were associated with greater insulin responses,<br />
which peaked at 30 min (juice4puree4apple) and a greater<br />
subsequent rebound hypoglycaemia (also juice4puree4<br />
apple) from similar peak glucose concentrations (measured<br />
in venous rather than arterial blood, which could confound<br />
interpretation) (Haber et al., 1977). There are few long-term<br />
studies, but in 1958 Fryer (Fryer, 1958) reported the effects of<br />
supplementing the diet of 20 college students for 2 months<br />
with a carbohydrate-rich drink (1.8 MJ/day). Dietary compensation<br />
for the extra liquid energy intake was only about<br />
Physiological aspects of energy metabolism<br />
M Elia and JH Cummings<br />
half complete by 2 months. Other studies (observational or<br />
epidemiological) have shown that the compensation that<br />
does occur displaces the intake of protein and micronutrients<br />
from the diet, the full significance of which is still<br />
somewhat uncertain. The above intervention trials are<br />
complemented by epidemiological studies, such as the<br />
Nurses’ Health Study II in the United States (Schulze et al.,<br />
2004), which reported that higher consumption of sugarsweetened<br />
beverages is associated with greater weight gain<br />
(4–5 kg over 4 years in those who increased consumption<br />
from one or fewer drinks per week to one or more drinks per<br />
day) and greater risk of type II diabetes. Conversely, weight<br />
gain was smaller among women who decreased their intake<br />
of sugar-sweetened drinks (0–1.5 kg over 4-year periods).<br />
Epidemiological studies in children (for example, US Growing<br />
Up Today Study; Berkey et al., 2004) also show a link<br />
between sugar-added beverages and weight gain. The link<br />
between soft drinks and childhood obesity has been<br />
reviewed recently (James and Kerr, 2005). Finally, a longterm<br />
intervention trial in England (The Christchurch obesity<br />
prevention project in schools (CHOPPS); James et al., 2004)<br />
reported that the results of a cluster randomized control trial<br />
involving 644 children aged 7–11 years. A focused educational<br />
program at school over a year reported the average 3day<br />
consumption of carbonated drinks decreased by 0.6<br />
glasses (average glass size 250 ml) in the intervention group<br />
and increased by 0.2 glasses in the control group, with the<br />
result that in the percentage of overweight and obese<br />
children at the end of the year increased by 7.5% in the<br />
control group and decreased by 0.2% in the intervention<br />
group. In summary, there is epidemiological, physiological<br />
evidence, as well as interventional evidence linking sugarsweetened<br />
beverages and weight gain.<br />
The need to expand the physiological evidence base<br />
The early growth of the obesity epidemic in developed<br />
countries some 30 years ago was associated with ingestion of<br />
high-fat, low-carbohydrate diets. Many workers felt that the<br />
macronutrient composition of the diets had a large part to<br />
play in this, and physiological studies that varied the<br />
carbohydrate to fat ratios (without controlling for<br />
energy density or GI) in laboratory studies were consistent<br />
with this notion. However, the recent trend in many<br />
developed countries, such as the United States (Centres<br />
for Disease Control and Prevention (CDC), 2004) and<br />
the United Kingdom (Henderson et al., 2003), for a<br />
decrease in the proportion of dietary energy from fat<br />
and an increase from carbohydrate, has not prevented<br />
the growth in obesity and overweight, which has continued<br />
to rise unabated. It is possible that without this change<br />
an even greater rise would have occurred. These trends<br />
have also been associated with exposure to an increased<br />
variety of foods and drinks containing different types of<br />
carbohydrates, carbohydrate combinations, sweeteners<br />
and sweet-bulking agents. Advances in technology can<br />
S59<br />
European Journal of Clinical Nutrition
S60<br />
modify the structures of carbohydrates, for example, starch<br />
to RS, and lead to the development of new types of<br />
carbohydrates or mimetics (substances that mimic<br />
carbohydrates). However, their functional effects and their<br />
interactions with other dietary components need systematic<br />
examination so that their overall effect on energy balance<br />
can be understood.<br />
Consumer behaviour and demands have also grown, and<br />
they have strained the existing physiological evidence base.<br />
For example, the above discussion indicates that macronutrients<br />
(or particular types of macronutrients, such as sugars,<br />
starch or NSP) can themselves influence energy density, GI<br />
and palatability of foods, all of which have been implicated<br />
in feeding behaviour. However, some of the effects of these<br />
food attributes on feeding behaviour overlap with each other<br />
to an uncertain degree (Figure 5). They probably also interact<br />
with other factors, such as texture and viscosity, which can<br />
also be influenced by macronutrients (for example, viscosity<br />
can be increased by certain types of NSP, such as guar gum).<br />
Most studies on feeding behaviour have studied only one of<br />
these attributes, some have considered a couple, but there is<br />
a lack of studies that have considered the effects of three or<br />
more such attributes simultaneously. Therefore, a number of<br />
key questions arise, which emphasize the need for integrative<br />
research. To what extent is energy density linked with GI<br />
and palatability? To what extent is palatability linked to GI<br />
and energy density? How do different types of carbohydrates<br />
influence these attributes, and can artificial modification<br />
bring about predictable changes? There is also the issue<br />
about the extent to which feeding behaviour is causally<br />
Energy<br />
density<br />
Macronutrients<br />
and water<br />
Palatability<br />
Glycaemic<br />
index/load<br />
Feeding behaviour<br />
Physiological aspects of energy metabolism<br />
M Elia and JH Cummings<br />
Other factors<br />
Other factors<br />
(nutritional + non-nutritional)<br />
Figure 5 A model showing a possible pathway between intake of<br />
different macronutrients (and different subtypes, such as sugar,<br />
starch, polyols and fibre, in the case of carbohydrate) and feeding<br />
behaviour. Study of only one of the properties of foods (glycaemic<br />
index, energy density, palatability and others) is less informative<br />
than their simultaneous study, especially when linked to food and<br />
macronutrient composition.<br />
European Journal of Clinical Nutrition<br />
linked to these food attributes, as opposed to being markers<br />
of some other functional and causal property or properties. It<br />
has been suggested that weight-reducing diets should avoid<br />
high glycaemic foods, on the basis that they might cause<br />
reactive hypoglycaemia, which in turn, it is argued, stimulates<br />
appetite, reduces satiety and makes weight loss more<br />
difficult (Agatston, 2003). Mention has already been made<br />
(see section Liquid vs solid carbohydrates’) about the<br />
hypothetical role of reactive hypoglycaemia in mediating<br />
differences in satiety after ingestion of apple, puree and juice<br />
(Haber et al., 1977). However, the evidence base for this<br />
causal pathway is weak and further work at each one of these<br />
steps is required.<br />
Another issue concerns the energy system used in detailed<br />
metabolic studies, for example, studies that accurately<br />
assessed the effects of isoenergetic diets on ad libitum energy<br />
intake. Almost invariably the ME system has been used for<br />
this purpose (at least for the major macronutrients—fat,<br />
protein and carbohydrate absorbed by the small bowel).<br />
However, since this system can be considered to be flawed in<br />
relation to energy balance, a re-evaluation of the situation<br />
using the NME system is necessary, especially for those<br />
studies that have used large amounts of protein, fibre or<br />
other macronutrients that have a low bioenergetic efficiency.<br />
Diets that are isoenergetic in relation to the ME system are<br />
not necessarily isoenergetic in relation to the NME system<br />
(see sections Net metabolizable energy, and Energy systems<br />
and food labelling).<br />
There is also a need to bridge the gap between short-term<br />
physiological studies that are undertaken in confined<br />
environments (laboratory studies) and longer term studies<br />
in free-living environments. Epidemiological approaches are<br />
useful in establishing associations, but they may have greater<br />
difficulty in separating causes from effects. For example,<br />
cross-sectional epidemiological studies on the role of sweeteners<br />
on weight control may be difficult to interpret because<br />
sweeteners may be preferentially used by those already<br />
overweight or obese, and this may mask any associations<br />
between sweeteners and weight loss. In addition, it should be<br />
remembered that sweeteners are used both as replacements<br />
for sugar and as supplements to sugar (for example, in several<br />
sugary soft drinks) in an attempt to promote a more<br />
prolonged and desirable after taste.<br />
This discussion has placed much emphasis on physiological<br />
determinants of eating behaviour. However, there have<br />
been long-standing debates about the relative importance of<br />
physiology and psychology on feeding behaviour, and the<br />
boundary between them. Both are important, but their<br />
interactions and their independent contributions to feeding<br />
behaviour almost certainly vary with the environment.<br />
Social conditioning, social and environmental ambiance,<br />
and learned behaviour all play a role. Even the extent to<br />
which compensation occurs following supplementation may<br />
depend on whether the food is familiar to the consumer.<br />
Future research using a multidisciplinary approach is to be<br />
encouraged. Such an approach should also involve the
ecologist, who is pre-occupied with why animals evolved<br />
with the behavioural programmes that control food intake.<br />
In contrast, the physiologist is pre-occupied with more<br />
immediate determinants of feeding behaviour. Both can<br />
provide important insights into mechanisms of eating<br />
behaviour and possible ways for combating over- and<br />
undernutrition.<br />
Requirements for dietary carbohydrate<br />
Using the brain’s requirement of glucose as a basis for<br />
considering carbohydrate requirements, the Institute of<br />
Medicine has estimated the average requirement to be<br />
100 g/day, and the Recommended Dietary Allowance to be<br />
130 g/day day, for both men and women aged 19 years and<br />
above (Institute of Medicine, 2005). Estimated average<br />
requirement typically represents only 10–20% of total energy<br />
requirements, which vary according to weight and physical<br />
activity (FAO/WHO/UNU Expert Consultation, 2004). However,<br />
high-fat, high-protein diets are not considered healthy<br />
and many national and international bodies have set limits<br />
and ranges for carbohydrate intake based mainly on supplying<br />
energy needs for the individual that would not be<br />
supplied by recommended amounts of fat and protein. In its<br />
report ‘Diet and Prevention of Chronic Diseases’, WHO/FAO<br />
recommended that carbohydrate provides 55–75% of total<br />
energy (WHO, 2003). The upper limit is thought to allow<br />
adequate protein and fat intake, whereas the lower limit<br />
allows a maximum energy intake from fat of 30% and<br />
protein of 15%.<br />
The partial replacement of carbohydrate with monounsaturated<br />
fats in diabetic diets has been seen to be<br />
beneficial (Garg, 1998). This has motivated European and<br />
UK diabetes associations to implement this advice for people<br />
with diabetes (Diabetes and Nutrition Study Group of<br />
European Association for the Study of Diabetes, 2000;<br />
Connor et al., 2003). They recommend that 40–60% of total<br />
energy should come from carbohydrate, and that carbohydrate<br />
plus monounsaturated fat should provide 60–70% of<br />
energy. This allows 20% of energy to come from monounsaturates.<br />
WHO/FAO, and other bodies, also suggest that there<br />
should be a limit on the intake of free sugars at o10% of<br />
energy. This arises from the relation of sugar to dental caries,<br />
an increasing problem in the developing world, and that<br />
FAO/WHO ‘considered that studies showing no effect of free<br />
sugars on excess weight have significant limitations’ (Nishida<br />
et al., 2004). The 10% figure is given as a maximum, and<br />
one would expect therefore that sugar intakes on average<br />
would be less than this for populations as a whole.<br />
Carbohydrate and physical performance<br />
Carbohydrate feeding both before and during exercise can<br />
improve performance through a variety of mechanisms<br />
(Jeukendrup, 2004).<br />
Physiological aspects of energy metabolism<br />
M Elia and JH Cummings<br />
Carbohydrates in the large bowel<br />
Quantitative aspects<br />
The principal carbohydrates that reach the human large<br />
bowel are the NSP, RS, non-a-glucan oligosaccharides (shortchain<br />
carbohydrates), and some polyols and modified<br />
starches. In many populations of the world, there is primary<br />
low lactase activity in the small bowel.<br />
The amount of these carbohydrates that arrive in the<br />
caecum is difficult to calculate because dietary intakes of<br />
most, except NSP, are largely unknown. NSP in the diet in<br />
European countries is between 11 and 33 g/day (Cummings<br />
and Frolich, 1993; Bingham et al., 2003) and all of this will<br />
reach the colon. Intakes of NSP in Mexicans are reported<br />
as 22 and 17 g/day in rural men and women, and 18 and<br />
16 g/day in urban men and women (Sanchez-Catillo et al.,<br />
1997). In a West African village, intakes (corrected to 100%<br />
energy intake) were in the range of 25–28 g/day for men and<br />
21–24 g/day for women, and 10–13 g/day in children of<br />
unspecified age, but sharing meals with adults (Hudson and<br />
Englyst, 1993). Other data, reported by Cassidy et al. (1994)<br />
give NSP intakes for Australia of 12–13 g/day, India 15–21 g/day,<br />
Ireland 9–11 g/day, Japan 11 g/day and the United States<br />
12–17 g/day. Higher intakes may occur in vegetarians and<br />
populations with high intakes of fruit and vegetables such as<br />
some Pacific Islanders.<br />
Resistant starch intakes are much more difficult to<br />
determine. This is because almost any handling of starchy<br />
foods from diet collections, that is mixing with water,<br />
heating, homogenization, freezing or cooling, will affect RS<br />
content. Present estimates for countries with westernized<br />
diets are in the range of 3–10 g/day (Champ et al., 2003;<br />
Goldring, 2004). Clearly this is very diet dependent. A couple<br />
of relatively unripe bananas will readily provide 20 g RS. A<br />
single biscuit made with potato flour would give 10 g.<br />
Estimates for developing countries for RS intakes are 9–10<br />
to 30–40 g/day where starch intakes are high (Stephen et al.,<br />
1995). The amount of RS that escapes digestion also varies<br />
between people, partly dependent on transit time through<br />
the small bowel (Stephen et al., 1983; Silvester et al., 1995).<br />
Modified starches are also likely to reach the colon because<br />
of their ether and ester bonds or increased cross-linking and<br />
substitutions. These starches are used in small amounts by<br />
the food industry for their functional properties and intakes<br />
are unlikely to be more than 2–3 g/day.<br />
Almost no data have been reported of intakes of the non-aglucan<br />
oligosaccharides or short-chain carbohydrates. Fructooligosaccharide<br />
and inulin intakes were estimated at<br />
between 1 and 10 g/day in European countries by Van Loo<br />
et al. (1995), but one must add to this the other oligosaccharides<br />
in beans, peas, non-wheat cereals and milk. Again, a<br />
meal containing 100 g of Jerusalem artichokes would provide<br />
16–20 g of inulin, and babies living on breast milk will be<br />
getting 15 g/l of oligosaccharides (Miller and McVeagh,<br />
1999). Average oligosaccharide intakes for westernized diets<br />
could, therefore, be in excess of 10 g/day.<br />
S61<br />
European Journal of Clinical Nutrition
S62<br />
Polyols, such as lactitol, isomalt, maltitol, sorbitol,<br />
manitol, erythritol and xylitol, are mostly used as lowcalorie<br />
substitutes for sugar in foodstuffs and confectionary.<br />
Daily intake of these carbohydrates is unknown but is likely<br />
to average only 2–3 g. However, people selecting sugar-free<br />
products including diabetics and those trying to lose weight<br />
may easily consume 20 g/day, so variation in intakes may<br />
well be great. Intakes are limited because of gastrointestinal<br />
intolerance (Lee et al., 2001). Even when intakes are known,<br />
the amount of these carbohydrates reaching the colon is<br />
difficult to calculate because their absorption varies between<br />
2 and 90%, whereas some, such as erythritol, are almost<br />
completely excreted by kidney (Livesey, 2003b).<br />
Overall, therefore, carbohydrate reaching the colon in people<br />
on westernized diets is probably in the range of 20–40 g/day,<br />
whereas in countries with high cereal intakes or higher intakes<br />
of fruit and vegetables, this could reach 50 g/day.<br />
Virtually, all carbohydrate that enters the large bowel will<br />
be fermented by the commensal bacteria that live in the<br />
colon at densities of up to 10 12 /g. The extensive fermentation<br />
of NSP has been known for many years (Cummings,<br />
1981), while recovery of oligosaccharides from faeces is<br />
effectively nil (Cummings et al., 2001). Similar data are also<br />
available for RS with only very resistant retrograded starches<br />
partly surviving, the amount depending on colonic transit<br />
time, although occasional individuals are unable to digest<br />
some RS fractions (Cummings et al., 1996). Microcrystalline<br />
cellulose may resist fermentation because of its highly<br />
condensed structure, an observation that led to the belief<br />
that cellulose was not digested in the human gut. This is<br />
because microcrystalline cellulose was used in many early<br />
experiments of cellulose digestion. However, cellulose<br />
naturally present in the cell wall of food is completely<br />
fermented unless in association with large amounts of lignin.<br />
Other polysaccharides of the plant cell wall are also readily<br />
fermented, even when given in purified forms such as pectin<br />
or guar gum. This process is facilitated by the ability of these<br />
latter substances to form gels readily accessible to the<br />
microbiota.<br />
Fermentation<br />
Fermentation is an anaerobic process and, therefore, produces<br />
unique end products. These include principally the<br />
SCFAs acetate, propionate and butyrate (Cummings, 1995;<br />
Cummings et al., 1995). They are rapidly absorbed. Butyrate<br />
is the major energy source for the colonic epithelial cell, in<br />
contrast to glutamine for the small bowel and glucose for<br />
most other tissues. Butyrate also has differentiating properties<br />
in the cell, arresting cell division through its ability to<br />
regulate gene expression (Siavoshian et al., 2000). This<br />
property provides a credible link between the dietary intake<br />
of fermented carbohydrates, such as NSP, and protection<br />
against colorectal cancer (Bingham et al., 2003).<br />
Propionate is absorbed and passes to the liver where it is<br />
taken up and metabolized aerobically. This molecule is not<br />
European Journal of Clinical Nutrition<br />
Physiological aspects of energy metabolism<br />
M Elia and JH Cummings<br />
seen as having significant regulatory properties in humans,<br />
although it may moderate hepatic lipid metabolism (Todesco<br />
et al., 1991; Stephen, 1993). However, in ruminant animals,<br />
propionate is crucial to life because it is used to synthesize<br />
glucose in the liver.<br />
Acetate is the major SCFA produced in all types of<br />
fermentation, the molar ratio of acetate:propionate:butyrate<br />
is around 60:20:20. Acetate is rapidly absorbed, stimulating<br />
sodium absorption and passes to the liver and then into the<br />
blood from where it is available as an energy source. Fasting<br />
blood acetate levels are about 50 mmol/l, rising 8–12 h later to<br />
100–300 mmol/l after meals containing fermentable carbohydrate.<br />
Acetate is rapidly cleared from the blood with a halflife<br />
of only a few minutes and is metabolized principally by<br />
skeletal and cardiac muscle and the brain. Acetate spares free<br />
fatty acid oxidation in humans and its absorption does not<br />
stimulate insulin release. Another precursor of blood acetate<br />
is alcohol.<br />
Fermentation also gives rise to the gases hydrogen and<br />
carbon dioxide. Much of the hydrogen is converted to<br />
methane by bacteria, and both hydrogen and methane are<br />
excreted in breath and flatus. Gas production, especially if<br />
rapid, is one of the principal complaints of people unused to<br />
eating foods containing significant amounts of fermentable<br />
carbohydrate. Another product of fermentation is microbial<br />
biomass or microbial growth (Stephen and Cummings,<br />
1980). These bacteria are excreted in faeces and this is one<br />
of the principal mechanisms of laxation by NSP. Lactate is<br />
also produced from fermentation, usually during rapid<br />
breakdown of soluble carbohydrates such as oligosaccharides.<br />
Both D- and L-lactate are produced and both are<br />
absorbed. Some ethyl alcohol is produced during hind gut<br />
fermentation, although it is more characteristic of fermentation<br />
due to yeasts as in brewing and wine making.<br />
Bowel habit<br />
Carbohydrates in the colon have additional health benefits<br />
beyond providing energy through SCFA absorption. The best<br />
documented effect is that of NSP on bowel habit. Table 5 is a<br />
compilation of faecal weight data from around 120 papers<br />
published between 1932 and 1992 detailing 150 separate<br />
studies (Cummings et al., 2004). It shows the average<br />
increase in stool output expressed as grams of stool (wet<br />
weight) per gram of ‘fibre’ fed using weighted means from<br />
published data. Wheat bran as a source comes out as the<br />
most effective with raw bran at 7.2 g/g more effective than<br />
cooked bran, 4.4 (Po0.05), but has the disadvantage of<br />
containing 3% phytate—a known inhibitor of the absorption<br />
of divalent cations (calcium, magnesium, zinc and iron).<br />
Fruit and vegetables are remarkably effective, 6.0 g/g, and<br />
with wheat bran are well ahead of the rest. After fruit and<br />
vegetables comes psyllium at 4.0 g/g and then the league<br />
table progresses through oats 3.4, other gums and mucilages<br />
3.1, corn 2.9, legumes (mainly soya) 1.5 and lastly pectin 1.3.<br />
The overall differences among the various sources of NSP are
Table 5 Effect of NSP (dietary fibre) on bowel habit a<br />
Source N b<br />
Increase in<br />
stool weight<br />
(mean g/g<br />
‘fibre’ fed)<br />
Median Range<br />
Raw bran 82 7.2 6.5 3–14.4<br />
Fruit and vegetables 175 6.0 3.7 1.4–19.6<br />
Cooked bran 338 4.4 4.9 2–12.3<br />
Psyllium/ispaghula 119 4.0 4.3 0.9–6.6<br />
Oats 53 3.4 4.8 1–5.5<br />
Other gums and<br />
mucilages<br />
66 3.1 1.9 0.3–10.2<br />
Corn 32 2.9 2.9 2.8–3.0<br />
Soya and other<br />
legumes<br />
98 1.5 1.5 0.3–3.1<br />
Pectin 95 1.3 1.0 0–3.6<br />
Abbreviations: ANOVAR, analysis of variance; NSP, non-starch polysaccharides.<br />
Difference among sources significant: ANOVAR: F ¼ 4.78; Po0.001.<br />
a<br />
Modified and recalculated from Cummings et al. (2001, 2004).<br />
b<br />
N, number of subjects involved in studies.<br />
statistically significant. These laxative properties of NSP are<br />
used in the prevention and treatment of constipation<br />
(Cummings, 1994).<br />
Are any of the changes brought about by plant cell wall<br />
NSP unique? For most of them the answer is ‘no’, although<br />
the physical properties of NSP in the gut, especially gel<br />
function in the small bowel and surface effects in the large<br />
intestine, come closest. What has put the physiological and<br />
health effects of NSP into perspective has been the arrival on<br />
the nutritional scene in the last 20 years of RS and prebiotic<br />
carbohydrates (oligosaccharides).<br />
Resistant starch shows some of the attributes of NSP in that<br />
it provides substrate for fermentation with the production of<br />
SCFA, but differs radically from NSP in not having physical<br />
properties that come from the plant cell wall, and RS is more<br />
the product of food processing rather than being an<br />
indicator of a healthy diet. RS, through its fermentability<br />
has mild laxative properties. Seven studies have reported<br />
accurate RS measurements in diet and have carried out<br />
adequate faecal collections (Table 6), from which it can be<br />
seen that the average increase in stool weight is 1.5 g/g RS<br />
fed. A meta-analysis including data from six of these seven<br />
studies (Tomlin and Read, 1990; van Munster et al., 1994;<br />
Phillips et al., 1995; Cummings et al., 1996; Silvester et al.,<br />
1997; Heijnen et al., 1998; Hylla et al., 1998) (excluding<br />
Tomlin and Read, 1990; because no error measurements are<br />
given in the paper) has been carried out and the results are<br />
given in Figure 6. This shows a highly significant overall<br />
increase in mean daily stool weight for the group of<br />
41.1 g/day (75.4 g s.e.m.; Po0.001), but no significant<br />
dose-response was found using meta-regression. It was not<br />
possible to distinguish from these data among the different<br />
types of RS. This puts RS very much towards the bottom of<br />
the league table of carbohydrates that affect bowel habit<br />
(Table 5) and a minor contributor compared with NSP from<br />
Physiological aspects of energy metabolism<br />
M Elia and JH Cummings<br />
Table 6 Effect of RS on bowel habit<br />
Source N Amount<br />
fed (g/day)<br />
Increase in<br />
stool weight<br />
(mean g/g<br />
RS fed)<br />
Potato RS2 9 26.8 1.6<br />
Banana RS2 8 30.0 1.7<br />
Wheat RS3 9 17.4 2.5<br />
Maize RS3 8 19.0 2.7<br />
Hylon VII RS2 23 32 1.4<br />
Hylon VII RS3 23 32 2.2<br />
Hylon VII 12 55 0.8<br />
Mixed potato RS2<br />
8 40 0.9<br />
and Hylon VII<br />
Mixed food sources 11 39 1.8<br />
Cornflakes 8 10 0<br />
Hylon VII RS2 14 28 1.0<br />
Abbreviation: RS, resistant starch.<br />
Overall weighted mean (s.e.m.) 1.5 g/g (0.24).<br />
N ¼ 147 diet periods in 11 studies.<br />
For data sources see Figure 6.<br />
whole grain cereals, fruit, vegetables, psyllium, oats and<br />
corn. In vitro starch and RS are good sources of butyrate<br />
(Cummings, 1995), but these findings do not lead through<br />
to consistent changes in faecal butyrate output or molar<br />
ratios of SCFA (Flourie et al., 1986; van Munster et al., 1994;<br />
Phillips et al., 1995; Cummings et al., 1996; Heijnen et al.,<br />
1998; Hylla et al., 1998).<br />
Clinical aspects<br />
Irritable bowel syndrome (IBS) is one of the most common<br />
disorders seen in the gastroenterology clinic. It has two main<br />
presenting features, namely, abdominal pain and altered<br />
bowel habit. It is, however, a very diverse disease with no<br />
clear aetiology. While the cause is unknown, NSP has a useful<br />
role to play in the management of constipation-predominant<br />
IBS. However, wheat bran is not universally beneficial<br />
in this condition possibly because it is thought that a<br />
significant number of IBS patients are wheat intolerant<br />
without having the diagnostic features of coeliac disease<br />
(Nanda et al., 1989; Francis and Whorwell, 1994; Snook and<br />
Shepherd, 1994). Furthermore, changing people onto significantly<br />
increased NSP intakes leads to excess gas production<br />
and IBS patients may have a gut that is unusually<br />
sensitive to gas (King et al., 1998; Drossman et al., 2002;<br />
Talley and Spiller, 2002; Longstreth et al., 2006).<br />
Colonic diverticular disease is another condition that<br />
benefits from carbohydrate in the diet, particularly NSP. A<br />
diverticulum is a pouch that protrudes outwards from the<br />
wall of the bowel and is associated with hypertrophy of the<br />
muscle layers of the large intestine, particularly the sigmoid<br />
colon. Diverticular disease is very common in industrial<br />
societies, the prevalence rising with age to about 30 percent<br />
of people over the age of 65 years. Many people with<br />
diverticula do not have symptoms, but those that do,<br />
S63<br />
European Journal of Clinical Nutrition
S64<br />
complain of lower abdominal pain and changes in bowel<br />
habit. High NSP-containing diets were introduced in the<br />
1960s and their use revolutionized the management of this<br />
condition (Painter et al., 1972). Wheat bran is thought to be<br />
more effective than other sources of NSP or bulk laxatives,<br />
although bran is not a panacea and may aggregate gas<br />
production, feelings of abdominal distension and incomplete<br />
emptying of the rectum (Stollman and Raskin, 2004).<br />
The role of carbohydrate in the prevention of colorectal<br />
cancer is dealt with elsewhere in this consultation.<br />
Prebiotics<br />
Physiological aspects of energy metabolism<br />
M Elia and JH Cummings<br />
Study name RS (dose) Difference in means and 95% CI<br />
RS Control<br />
Cummings et al., 1996 Banana RS 2 (30.0g) 8 12<br />
Cummings et al., 1996 Maize RS 2 (19.0g) 8 12<br />
Cummings et al., 1996 Potato RS 2 (26.8g) 9 12<br />
Cummings et al., 1996 Wheat RS 3 (17.4g) 9 12<br />
Heijnen et al., 1998 Hylon VII RS 2 (32.0g) 23 22<br />
Heijnen et al., 1998 Hylon VII RS 3 (32.0g) 23 22<br />
Hylla et al., 1998 Hylon VII (55g) 12 12<br />
Silvester et al., 1997 Potato starch + Hylon VII (40g) 8 8<br />
Phillips et al., 1995 Mixed diet (38.6g) 11 11<br />
Van Munster et al., 1994 Hylon VII RS 2 (28g) 13 13<br />
124 136<br />
Definition<br />
‘A prebiotic is a non-digestible food ingredient that beneficially<br />
affects the host by selectively stimulating the growth<br />
and/or activity of one of a limited number of bacteria<br />
in the colon, and thus improves host health’ (Gibson and<br />
Roberfroid, 1995). This use of the term ‘non-digestible’ in<br />
this context is meant to convey the idea of carbohydrates<br />
that are not digested and absorbed in the small intestine. As<br />
such it conflicts with the use of the term digestion referred to<br />
in the section on DE where ‘digestibility is defined as the<br />
proportion of combustible energy that is absorbed over the<br />
entire length of the gastrointestinal tract.’ (see below).<br />
Physiology and microbiology<br />
The main candidate prebiotics are all non-a-glucan oligosaccharides.<br />
They are present in the normal diet, as described<br />
above, at intakes of 5–10 g/day. Those that have been shown<br />
-150.00 -75.00 0.00 75.00 150.00<br />
Favours control Favours RS<br />
Figure 6 Meta-analysis (fixed effect model) of effect of various sources of resistant starch on bowel habit (stool weight). Point estimate<br />
þ 41.1 g/day; 95% CI: þ 30.5 to þ 51.7 g/day. The test of overall effect was highly significant (P ¼ o0.001), and the test of heterogeneity was<br />
not significant (I 2 ¼ 0%; P ¼ 0.971).<br />
European Journal of Clinical Nutrition<br />
to be prebiotic are fructooligosaccharides, galactooligosaccharides<br />
and lactulose. The ability of fructooligosaccharides,<br />
galactooligosaccharides and inulin, when taken in<br />
relatively small amounts in the diet of around 5–15 g/day,<br />
to alter the composition of the flora to one dominated by<br />
bifidobacteria and lactobacilli is now well established<br />
(Gibson et al., 2004; Roberfroid, 2005).<br />
Prebiotic carbohydrates are important because of the new<br />
concept of a healthy or balanced gut flora. A healthy, or<br />
‘balanced’ microbiota is one that is predominantly saccharolytic<br />
and comprises significant numbers of bifidobacteria<br />
and lactobacilli (Cummings et al., 2004). This concept is<br />
based on a number of observations. The genera Bifidobacterium<br />
and Lactobacillus do not contain any known pathogens,<br />
and they are primarily carbohydrate-fermenting bacteria,<br />
unlike other groups such as bacteroides and clostridia that<br />
are also proteolytic and amino-acid fermenting. The products<br />
of carbohydrate fermentation, principally SCFAs are<br />
beneficial to host health, while those of protein breakdown<br />
and amino acid fermentation, which include ammonia,<br />
phenols, indoles, thiols, amines and sulphides, are not<br />
(Cummings and Macfarlane, 1991). Furthermore, lactic<br />
acid-producing bacteria such as bifidobacteria and lactobacilli<br />
play a significant role in the maintenance of colonization<br />
resistance, through a variety of mechanisms (Gibson<br />
et al., 2005). Equally importantly, the exclusively breast-fed<br />
neonate has a microflora dominated by bifidobacteria,<br />
which is part of the baby’s defence against pathogenic<br />
microorganisms, and which is an important primer for their<br />
immune system. This microflora is nurtured by oligosaccharides<br />
in breast milk, which can be considered to be the<br />
original prebiotics.
As already described, almost any carbohydrate that reaches<br />
the large bowel will provide a substrate for the commensal<br />
microbiota, and will affect its growth and metabolic<br />
activities. This has been shown for NSP (Stephen and<br />
Cummings, 1980), and will occur with other substrates such<br />
as RS, sugar alcohols and lactose. However, stimulation of<br />
growth by these carbohydrates is a nonspecific, generalized<br />
effect, that probably involves many of the major saccharolytic<br />
groups, and associated cross-feeding species in the<br />
large bowel (Macfarlane and Cummings, 1991). The selective<br />
properties of prebiotics relate to the growth of bifidobacteria<br />
and lactobacilli at the expense of other groups of bacteria in<br />
the gut, such as bacteroides, clostridia, eubacteria, enterobacteria,<br />
enterococci, and so on. In practice, studies show<br />
that such selectivity is variable, and the extent to which<br />
changes in the microbiota allow a substance to be called<br />
prebiotic have not been established. There are also qualitative<br />
aspects of the concept of selectivity. Some investigations<br />
have shown increases in other bacterial genera such as<br />
Roseburia, Ruminococcus and Eubacterium, with established<br />
prebiotics like inulin (Duncan et al., 2003; Langlands et al.,<br />
2004). Moreover, it is now recognized that many bacteria<br />
inhabiting the large bowel have not yet been identified and<br />
are difficult to culture routinely (Macfarlane and Macfarlane,<br />
2004; Eckburg et al., 2005). One consequence of this is that<br />
we do not know what the global effects of prebiotics are on<br />
the structure of the microbiota. Furthermore, prebiotics can<br />
only enhance the growth of bacteria that are already present<br />
in the gut and the composition of the microbiota can be<br />
affected by a variety of other factors, such as diet, disease,<br />
drugs, antibiotics, age, and so on. Nevertheless, prebiotic<br />
carbohydrates do have dramatic effects on the gut flora. Does<br />
this lead to any health benefits?<br />
Table 7 Effects of prebiotics on bowel habit<br />
Physiological aspects of energy metabolism<br />
M Elia and JH Cummings<br />
Prebiotics should be laxative but as Table 7 and<br />
Figure 7 show (Ito et al., 1990; Gibson et al., 1995;<br />
Alles et al., 1996; Bouhnik et al., 1997; Castiglia-Delavaud<br />
et al., 1998; van Dokkum et al., 1999; Gostner et al., 2005),<br />
they are not significantly so. Meta-analysis of the studies in<br />
Table 7 show that overall there is no significant change in<br />
faecal weight when a wide range of sources and doses of<br />
oligosaccharides are studied. Most of these papers do,<br />
however, report a clear bifidogenic effect, so this alone does<br />
not affect bowel habit. Subjects often report increased<br />
flatulence and bloating, a sign that fermentation is occurring,<br />
but there is no change in SCFA profile or bile acid<br />
output. Studies in constipated subjects (Teuri and Korpela,<br />
1998; Chen et al., 2000; Den Hond et al., 2000), report<br />
increases in stool weight, which is surprising and should be<br />
followed up.<br />
Health benefits<br />
The main potential health benefit of prebiotics should be in<br />
strengthening gut barrier function against infection. So far,<br />
however, few randomised controlled trial (RCT) have been<br />
done and those that have, in traveller’s diarrhoea, IBS,<br />
inflammatory bowel disease and pouchitis, really do not<br />
show a clear benefit except, possibly, in well-being, although<br />
animal studies in inflammatory bowel disease are numerous<br />
and show reductions in inflammation. In antibioticassociated<br />
diarrhoea, three RCT have been reported, in one<br />
of which there was a benefit in reducing episodes of<br />
diarrhoea in patients with Clostridium difficile-associated<br />
symptoms treated with metronidazole and vancomycin.<br />
Again, it is too early to draw conclusions from these studies.<br />
(see review by Macfarlane et al., 2006).<br />
Type Amount (g/day) N MDSW/g/day Increase in stool weight<br />
(mean g/g ‘fibre’ fed)<br />
Control Prebiotic<br />
Oligomate 55 (GOS) 4.8 12 151 134 0<br />
9.6 12 151 0<br />
19.2 12 162 0.6<br />
Oligofructose 15.0 8 134 154* 1.3<br />
Inulin 15 4 92 123 2.1<br />
Oligofructose 5 24 272 279 0<br />
15 264 0<br />
TOS 10 8 105 80 0<br />
Inulin 31 9 129 204* 2.4<br />
Inulin 15 12 129 155 1.7<br />
Oligofructose 15 12 108 0<br />
GOS 15 12 158 1.9<br />
Isomalt a<br />
30 19 99 111 0.4<br />
Abbreviations: GOS, galacto-oligosaccharides; gram/gram increase, gram increase in stool weight per day per gram prebiotic fed; MDSW, mean daily stool weight;<br />
N, number of subjects; TOS, transgalacto-oligosaccharide.<br />
*Significantly different from control Po0.05.<br />
a<br />
Proposed as a prebiotic but not established as one.<br />
For data sources see Figure 7.<br />
S65<br />
European Journal of Clinical Nutrition
S66<br />
Study name Oloigosaccharide (OS) (g) Difference in means and 95% CI<br />
OS Control<br />
Ito et al 1990 GOS (10g) 12 12<br />
Ito et al 1990 GOS (2.5g) 12 12<br />
Ito et al 1990 GOS (5g) 12 12<br />
Gibson et al 1990 FOS (15g) 8 8<br />
Gibson et al 1990 Inulin (15g) 4 4<br />
Alles et al 1996 FOS (5g) 24 24<br />
Alles et al 1996 FOS (15g) 24 24<br />
Bouhnik et al al 1997 TOS (10g) 8 8<br />
Castiglia-Delavaud et al 1998 Inulin (22g) 9 9<br />
van Dokkum et al 1999 FOS (15g) 12 12<br />
van Dokkum et al 1999 GOS (15g) 12 12<br />
van Dokkum et al 1999 Inulin (15g) 12 12<br />
Gostner et al 2005 Isomalt (30g) 19 19<br />
168 168<br />
-200.00 -100.00 0.00 100.00 200.00<br />
Favours control Favours OS<br />
Figure 7 Meta-analysis (fixed effect model) of various prebiotic carbohydrates on bowel habit (stool weight). Point estimate þ 12.6 g/day; 96%<br />
CI: 1.5 to þ 26.6 g/day. The test of overall effect was not significant (P ¼ 0.079) and nor was the test of heterogeneity (I 2 ¼ 21.6%; P ¼ 0.225).<br />
Table 8 Effect of prebiotics on calcium absorption in humans<br />
Subjects N Prebiotic Study design Absorption<br />
method<br />
Adolescents, M 14–16 years 12 FOS 15 g RCT feeding study. 9-day<br />
periods<br />
Adolescents, F 11–14 years 59 FOS 8 g<br />
FOS þ inulin 8 g<br />
Adolescents, F/M 9–13 years 100 Mixed long- and<br />
short-chain inulin 8 g<br />
M 20–30 years 12 Inulin 15 g, FOS 15 g,<br />
GOS 15 g<br />
An unexpected but potentially very important effect of<br />
prebiotics is that on calcium absorption and bone mineral<br />
density. Studies in animal models show clearly enhanced<br />
absorption of calcium, magnesium and iron with galacto-<br />
Randomized crossover<br />
feeding study. 3-week<br />
periods<br />
1-year supplement to<br />
diet<br />
Randomized crossover<br />
feeding study. 21-day<br />
periods<br />
M 9 Inulin Latin square feeding<br />
study. 28-day periods<br />
Post menopausal women<br />
12 FOS 10 g RCT feeding study. 5-<br />
50–70 years<br />
week periods<br />
Post menopausal women<br />
12 TOS 20 g RCT crossover. 9-day<br />
55–65 years<br />
periods<br />
8 men 7 women, 25–36 years 15 FOS 0.8–1.1 g Absorption from fortified<br />
milk drinks<br />
Abbreviations: FOS, fructo-oligosaccharides; TOS, transgalacto-oligosaccharides.<br />
For data sources see Macfarlane et al. (2006).<br />
European Journal of Clinical Nutrition<br />
Physiological aspects of energy metabolism<br />
M Elia and JH Cummings<br />
Result<br />
44 Ca, 48 Ca Fractional absorption<br />
increased from 48717%<br />
to 60717%<br />
46 Ca, 42 Ca FOS—effect<br />
FOS/inulin absorption<br />
increased from 32710%<br />
to 38710%<br />
46 Ca Calcium absorption<br />
greater. Bone mineral<br />
density higher<br />
44 Ca, 48 Ca No effect on calcium or<br />
iron absorption<br />
Balance Significant increase in<br />
absorption. No effect on<br />
magnesium, iron or zinc<br />
44<br />
Ca and balance No effect<br />
44 48<br />
Ca, Ca Ca absorption increased<br />
from 2177% to 2477%<br />
42 43 44<br />
Ca, Ca, Ca No effect<br />
oligosaccharides, fructooligosaccharides and inulin, and<br />
prevention of osteopenia following gastrectomy and ovariectomy.<br />
Table 8 summarizes the studies in humans<br />
in which five out of eight show a benefit, most importantly,
in adolescents. Possible mechanisms are discussed elsewhere<br />
(Macfarlane et al., 2006). How specific this effect on calcium<br />
absorption is to this class of fermented carbohydrate remains<br />
to be seen. Lactose has traditionally been thought to<br />
promote calcium absorption, although this is not a consistent<br />
finding (Zittermann et al., 2000).<br />
Other possible health benefits of prebiotics are now being<br />
explored in many situations, facilitated by their safety and<br />
ease of use. A substantial literature is accumulating on<br />
prebiotics and cancer. However, much of the published work<br />
is in animals where the role of prebiotics looks to be<br />
beneficial, whereas human studies are mostly concerned<br />
with identification of early biomarkers of risk (Pool-Zobel,<br />
2005). Prebiotics are now being added to follow-on feeds for<br />
infants (Fanaro et al., 2005), a practice which arises from the<br />
clear benefits to children of probiotics in preventing and<br />
ameliorating the symptoms of acute infectious diarrhoea,<br />
and in atopic disease. Their use to prevent necrotizing<br />
enterocolitis shows promise in animal models (Butel et al.,<br />
2002). Prebiotics clearly change the gut microbiota of infants<br />
and alter large bowel function, but large clinical trials are<br />
awaited. Another area of importance is lipid metabolism<br />
where prebiotic studies in animals have shown reduced<br />
blood levels of cholesterol and triglycerides and beneficial<br />
effects on fatty liver. Clinical trials in humans have not<br />
yielded such consistent results (Williams and Jackson, 2002;<br />
Beylot, 2005). However, the effects on hepatic lipid metabolism<br />
are worth further study. There is also great interest in<br />
prebiotics in the pet food and animal feed industry<br />
(Flickinger and Fahey, 2002), where improved control of<br />
gastrointestinal infection is reported and enhanced growth<br />
performance is seen in poultry especially. Other areas of<br />
interest include prebiotics and immunomodulation and the<br />
gut immune system, glycaemic control, behavioural effects,<br />
especially cognitive performance, and the enhancement of<br />
probiotic activity in synbiotics.<br />
Prebiotics bring a new dimension to dietary carbohydrates,<br />
which might not have been predicted. Their ability to<br />
change the composition of the gut flora towards one that<br />
should protect against infection and their effect on calcium<br />
absorption are very important for public health. However,<br />
much work needs to be done in determining intakes of<br />
prebiotics in individuals and populations, on their mechanisms<br />
of action in the gut and potential effect on the immune<br />
system, inflammation and cancer.<br />
Digestibility concepts<br />
Within the nutrition community there is an awareness that<br />
the digestion (mechanical, chemical and enzymic breakdown)<br />
of food and absorption of products takes place in<br />
characteristically different regions of the gut. Of particular<br />
consequence has been the division of digestive processes<br />
into those that take place in the small bowel vs the large<br />
bowel. Small bowel digestion and absorption occurs for most<br />
Physiological aspects of energy metabolism<br />
M Elia and JH Cummings<br />
nutrients, whereas the large bowel, through the versatility of<br />
its anaerobic bacteria, deals mainly with carbohydrates such<br />
as NSP, non-a-glucan short-chain carbohydrates (oligosaccharides),<br />
RS and polyols.<br />
The end products of carbohydrate breakdown vary in<br />
different regions of the gut with sugars appearing in blood<br />
and insulin secretion stimulated after small bowel absorption,<br />
while from the colon the process of fermentation yields<br />
SCFAs, which metabolically are entirely different (Remesy<br />
et al., 1995). Other divisions within the gut are also valid,<br />
especially between duodenum/jejunum and ileum with, for<br />
example, iron being absorbed in the duodenum and upper<br />
jejunum and vitamin B12 in the terminal ileum. These<br />
patterns of digestion are significant for health and extend<br />
across the animal kingdom depending largely on the<br />
anatomy of the gut. For example, in ruminants, fermentation<br />
takes place primarily in the upper gut (the stomach<br />
and rumen).<br />
Knowledge of the importance of this contrasting physiology<br />
linked to different regions of the gut has led to suggested<br />
classifications of nutrients, especially carbohydrates on the<br />
basis of the apparent site of their digestion and absorption.<br />
An example is fibre, originally the cell wall carbohydrates of<br />
plants such as cellulose, hemicellulose and pectin. However,<br />
as our understanding of carbohydrate digestion has increased,<br />
it has become clear that while regional differences in<br />
function occur, there is no such clarity in regional differences<br />
in carbohydrate digestion. Most carbohydrates can<br />
reach the colon, for example, lactose, polyols, short-chain<br />
carbohydrates, some starches and all NSP. For some of these,<br />
for example, polyols or starch, the amount can vary between<br />
meals and individuals, depending on factors such as dose<br />
and transit time (Stephen et al., 1983; Cummings and<br />
Englyst, 1991; Silvester et al., 1995; Cummings et al., 1996;<br />
Livesey, 2003b). To describe carbohydrates by the region of<br />
their digestion in the gut is, therefore, not an exact science.<br />
Moreover, the gut acts as a single organ in digestion.<br />
Internal regulation of gut digestive processes occurs through<br />
neuro-endocrine loops between different regions. A classic<br />
example is the gastro-colic reflex, but much more intricate<br />
feedback occurs between regions of the gut (Cooke and<br />
Reddix, 1994; Nightingale et al., 1996; Camilleri, 2006).<br />
Furthermore, as already indicated in the discussion of<br />
energy values of food, ‘digestibility is defined as the<br />
proportion of combustible energy that is absorbed over the<br />
entire length of the gastrointestinal tract’. Other terms in use<br />
include ‘true digestibility’ (small bowel), ‘fermentable’ (large<br />
bowel) and ‘apparent digestibility’ (whole gut).<br />
There is a strong case for looking at carbohydrate digestion<br />
as an integrated whole gut process. For the purposes of<br />
classifying food as carbohydrates, both their DE and<br />
digestion and absorption should be seen as a single<br />
integrated system. This is not to underestimate the importance<br />
of regional differences in these processes and their<br />
subsequent metabolic effects, but the digestion and classification<br />
of carbohydrate should be based on their chemistry<br />
S67<br />
European Journal of Clinical Nutrition
S68<br />
while considering their digestion and digestibility, a whole<br />
gut approach should be used.<br />
Conclusion<br />
Being quantitatively the most important dietary energy<br />
source for most populations, carbohydrates have a special<br />
role to play in energy metabolism and homeostasis. The<br />
overview provided here deals with only selected physiological<br />
effects of energy metabolism and gastrointestinal effects<br />
of carbohydrates and their health implications. Several<br />
carbohydrate-specific theories of appetite regulation have<br />
been proposed but none are universally accepted, although<br />
high-carbohydrate, low-energy-density diets rich in fruit,<br />
vegetables and fibre are often recommended for weight<br />
reduction or prevention of weight gain. Appetite and<br />
hunger, which are of fundamental to survival, appear to<br />
have many layers of control, with one layer compensating or<br />
dominating another in some circumstances. The recent<br />
growth of overweight and obesity throughout the world is<br />
related to lifestyle changes, which have placed the human in<br />
the unusual situation (at least in evolutionary terms) of<br />
having to defend against a combination of persistent<br />
abundance of tasty food and reduced physical activity. There<br />
is a need to better understand the interaction between<br />
energy density, GI/load, palatability and other factors and<br />
their effects on feeding behaviour. At the same time, there is<br />
room to establish more rational national and international<br />
dietary energy systems and to consider greater application of<br />
the NME system, which has some advantages over the more<br />
commonly used, ME system.<br />
The other physiological effects of many carbohydrates<br />
depend on the site, rate and extent of their digestion in and<br />
absorption from the gut. The majority of mono- and<br />
disaccharides, together with maltodextrins and most starch,<br />
are hydrolyzed by pancreatic enzymes in the small bowel<br />
and at the epithelial surface, and the resultant monosaccharide<br />
mixtures absorbed transported to the liver and then<br />
stored or metabolized. These carbohydrates are primarily<br />
energy yielding. The non-a-glucan oligosaccharides have<br />
other properties, in that they increase calcium absorption<br />
and some selectively modify the composition of the large<br />
bowel microbiota to one dominated by bifidobacteria and<br />
lactobacilli, known as the prebiotic effect. Studies to<br />
demonstrate proven health benefits of prebiotics are<br />
awaited.<br />
The prebiotic carbohydrates, along with NSP, RS and some<br />
polyols, reach the large bowel where they are fermented. The<br />
principal end products, SCFA, are absorbed and provide a<br />
further energy source to the tissues. Fermentation benefits<br />
bowel habit, although the effects can be very small, and<br />
provides mechanisms that could be important in cancer<br />
prevention in the colon.<br />
In the digestion of carbohydrates, the gut acts as an<br />
integrated organ with distinct regions of function. The<br />
European Journal of Clinical Nutrition<br />
Physiological aspects of energy metabolism<br />
M Elia and JH Cummings<br />
nature of carbohydrate, both its chemical and physical<br />
properties, together with the physiological responses of<br />
absorption and secretion, local and visceral neuro-endocrine<br />
reflexes, enzyme section and microbial activity, determine<br />
the varied responses to carbohydrate in our diet.<br />
Acknowledgements<br />
We thank Professor Nils-Georg Asp, Professor Arne V Astrup,<br />
Professor Nancy Keim, Dr Geoffrey Livesey, Professor Ian<br />
MacDonald, Dr Gabriele Riccardi, Professor A Steward<br />
Truswell and Dr Ricardo Uauy for the valuable comments<br />
they provided on the earlier manuscript. We also thank Dr<br />
Klaus Englyst and Dr R James Stubbs for helpful comments.<br />
Conflict of interest<br />
During the preparation and peer review of this paper in 2006,<br />
the authors and peer reviewers declared the following<br />
interests.<br />
Authors<br />
Professor John Cummings: Chairman, Biotherapeutics<br />
Committee, Danone; Member, Working Group on Foods<br />
with Health Benefits, Danone; funding for research work at<br />
the University of Dundee, ORAFTI (2004).<br />
Professor Marinos Elia: Since undertaking this work,<br />
Professor Elia has joined a committee to undertake a<br />
systematic review on the role of fibre in enteral tube feeding,<br />
with an unrestricted grant from Numico.<br />
Peer-reviewers<br />
Professor Nils-Georg Asp: On part-time leave from university<br />
professorship to be the Director of the Swedish<br />
Nutrition Foundation (SNF), a nongovernmental organization<br />
for the promotion of nutrition research and its practical<br />
implications. SNF is supported broadly by the food sector;<br />
the member organizations and industries are listed on the<br />
SNF home page (www.snf.ideon.se).<br />
Professor Arne V Astrup: Research grants from Arla Foods,<br />
Danish Diary Association, Danish Meat Industry, Dutch<br />
Diary Association, Schulstad (Bakery), Unilever and Weight<br />
Watchers; speaker for Campina/Dutch Diary Association and<br />
Suikerstichting, Holland.<br />
Professor Nancy Keim: None declared.<br />
Dr Geoffrey Livesey: Director and shareholder of Independent<br />
Nutrition Logic Ltd, which also employs him as a<br />
consultant to work with commercial, governmental and<br />
educational establishments and to undertake research on<br />
commissioned works on matters regarding health and<br />
nutrition. Received payment or other support covering a<br />
period during 2002–2006, and has an expectation of support<br />
for the future from several commercial entities with an<br />
interest in the subject matter of the FAO/WHO scientific<br />
update, even if it does not convey any benefit to him<br />
personally, but which benefits his position or administrative
unit, such as a grant or fellowship or payment for the<br />
purpose of financing a post or consultancy.<br />
Professor Ian MacDonald: None declared.<br />
Dr Gabriele Riccardi: None declared.<br />
Professor A Steward Truswell: None declared.<br />
Professor Ricardo Uauy: Scientific Adviser on a temporary<br />
basis for Unilever and Wyeth; Scientific Editorial/Award<br />
Adviser for Danone, DSM, Kelloggs, and Knowles and Bolton<br />
on an ad hoc basis.<br />
References<br />
Agatston A (2003). The South Beach Diet. Headline Book Publishing:<br />
London.<br />
Alfenas RC, Mattes RD (2005). Influence of glycemic index/load on<br />
glycemic response, appetite, and food intake in healthy humans.<br />
Diabetes Care 28, 2123–2129.<br />
Alles MS, Hautvast JG, Nagengast FM, Hartemink R, Van Laere KM,<br />
Jansen JB (1996). Fate of fructo-oligosaccharides in the human<br />
intestine. Br J Nutr 76, 211–221.<br />
Anderson GH, Catherine NL, Woodend DM, Wolever TM (2002).<br />
Inverse association between the effect of carbohydrates on blood<br />
glucose and subsequent short-term food intake in young men. Am<br />
J Clin Nutr 76, 1023–1030.<br />
Anderson GH, Woodend D (2003). Effect of glycemic carbohydrates<br />
on short-term satiety and food intake. Nutr Rev 61, S17–S26.<br />
AOAC (2002). AOAC Official Methods of AOAC International, 17th edn.<br />
Gaithersburg, MD, USA.<br />
Armstrong DG (1969). Cell bioenergetics and energy metabolism. In:<br />
Lenkeit W, Breiren D, Crassman E (eds). Handbuch Der Tierernahrung.<br />
Parey Publishing: Hamburg.<br />
Astrup A, Buemann B, Flint A, Raben A (2002). Low-fat diets and<br />
energy balance: how does the evidence stand in 2002? Proc Nutr<br />
Soc 61, 299–309.<br />
Astrup A, Grunwald GK, Melanson EL, Saris WH, Hill JO (2000). The<br />
role of low-fat diets in body weight control: a meta-analysis of ad<br />
libitum dietary intervention studies. Int J Obes Relat Metab Disord<br />
24, 1545–1552.<br />
Ball SD, Keller KR, Moyer-Mileur LJ, Ding YW, Donaldson D, Jackson<br />
WD (2003). Prolongation of satiety after low versus moderately high<br />
glycemic index meals in obese adolescents. Pediatrics 111, 488–494.<br />
Bar A (1990). Factorial calculation model for the estimation of the<br />
physiological caloric value of polyols. In: Hosoya N (ed). Proceedings<br />
of the International Symposium on the Caloric Evaluation of<br />
Carbohydrates. The Japanese Association for of Dietetic and<br />
Enriched Foods: Tokyo, pp 209–379.<br />
Bathalon GP, Tucker KL, Hays NP, Vinken AG, Greenberg AS, McCrory<br />
MA et al. (2000). Psychological measures of eating behavior and the<br />
accuracy of 3 common dietary assessment methods in healthy<br />
postmenopausal women. Am J Clin Nutr 71, 739–745.<br />
Bell EA, Rolls BJ (2001). Energy density of foods affects energy intake<br />
across multiple levels of fat content in lean and obese women. Am J<br />
Clin Nutr 73, 1010–1018.<br />
Berkey CS, Rockett HR, Field AE, Gillman MW, Colditz GA (2004). Sugaradded<br />
beverages and adolescent weight change. Obes Res 12, 778–788.<br />
Bernier J, Pascal G (1990). Valeur energetique des polyols (surcres<br />
alcools). Med Nutr 26, 221–238.<br />
Beylot M (2005). Effects of inulin-type fructans on lipid metabolism<br />
in man and in animal models. Br J Nutr 93 (Suppl 1), S163–S168.<br />
Bingham SA, Day NE, Luben R, Ferrari P, Slimani N, Norat T et al.<br />
(2003). Dietary fibre in food and protection against colorectal<br />
cancer in the European prospective investigation into cancer and<br />
nutrition (EPIC): an observational study. Lancet 361, 1496–1501.<br />
Black JL (2000). Modelling growth and lactation in pigs. In:<br />
Theodorou KM, France J (eds). Feeding Systems and Feed Evaluation<br />
Models. Wallingford, Oxon, UK, pp 363–391.<br />
Physiological aspects of energy metabolism<br />
M Elia and JH Cummings<br />
Black RM, Anderson GH (1994). Sweeteners, food intake and<br />
selection. In: Fernstrom JD, Miller GD (eds). Appetite and Body<br />
Weight Regulation: Sugar, Fat and Macronutrient Substitutes. Boca<br />
Raton, FL.<br />
Black RM, Leiter LA, Anderson GH (1993). Consuming aspartame<br />
with and without taste: differential effects on appetite and food<br />
intake of young adult males. Physiol Behav 53, 459–466.<br />
Blaxter KB (1989). Energy Metabolism in Animals and Man. Cambridge<br />
University Press: Cambridge.<br />
Blaxter KL (1971). Methods of measuring the energy metabolism<br />
of animals and interpretation of results obtained. Fed Proc 30,<br />
1436–1443.<br />
Blundell JE, Burley VJ (1987). Satiation, satiety and the action of fibre<br />
on food intake. Int J Obes 11 (Suppl 1), 9–25.<br />
Blundell JE, Rogers PJ (1994). Sweet carbohydrate substitutes<br />
(intense sweeteners) and control of appetite: scientific issues. In:<br />
Fernstrom JD, Miller GD (eds). Appetite and Body Weight Regulation:<br />
Sugar, Fat and Macronutrient Susbstitutes. Boca Raton, FL.<br />
Blundell JE, Stubbs RJ (1999). High and low carbohydrate and fat<br />
intakes: limits imposed by appetite and palatability and<br />
their implications for energy balance. Eur J Clin Nutr 53 (Suppl 1),<br />
S148–S165.<br />
Bouhnik Y, Flourie B, D’Agay-Abensour L, Pochart P, Gramet G,<br />
Durand M et al. (1997). Administration of transgalactooligosaccharides<br />
increases fecal bifidobacteria and modifies<br />
colonic fermentation metabolism in healthy humans. J Nutr 127,<br />
444–448.<br />
British Nutrition Foundation (1990). Energy from complex carbohydrates.<br />
In: BNF Task Force on Complex Carbohydrates in Foods.<br />
Chapman and Hall: London.<br />
Brown J, Livesey G, Roe M, Faulks R, Poppitt S, Wilkinson J et al.<br />
(1998). Metabolizable energy of high non-starch polysaccharidemaintenance<br />
and weight-reducing diets in men: experimental<br />
appraisal of assessment systems. J Nutr 128, 986–995.<br />
Burley VJ, Blundell JE (1990). Action of dietary fibre on the satiety<br />
cascade. In: Kritchevsky D, Bonfield C, Anderson JW (eds). Dietary<br />
Fibre. Chemistry, Physiology and Health Effects. Plenum Press: New<br />
York, NY.<br />
Butel MJ, Waligora-Dupriet AJ, Szylit O (2002). Oligofructose and<br />
experimental model of neonatal necrotising enterocolitis. Br J Nutr<br />
87 (Suppl 2), S213–S219.<br />
Camilleri M (2006). Integrated upper gastrointestinal response to<br />
food intake. Gastroenterology 131, 640–658.<br />
Campfield LA, Smith FJ (1990). Transient declines in blood glucose<br />
signal meal initiation. Int J Obes 14 (Suppl 3), 15–31; discussion<br />
31–34.<br />
Campfield LA, Smith FJ (2003). Blood glucose dynamics and control<br />
of meal initiation: a pattern detection and recognition theory.<br />
Physiol Rev 83, 25–58.<br />
Campfield LA, Smith FJ, Rosenbaum M (1992). Human hunger: is<br />
there a role for blood glucose dynamics? Appetite 18, 244.<br />
Canty DJ, Chan MM (1991). Effects of consumption of caloric vs<br />
noncaloric sweet drinks on indices of hunger and food consumption<br />
in normal adults. Am J Clin Nutr 53, 1159–1164.<br />
Casey A, Mann R, Banister K, Fox J, Morris PG, Macdonald IA et al.<br />
(2000). Effect of carbohydrate ingestion on glycogen resynthesis<br />
in human liver and skeletal muscle, measured by (13)C MRS. Am<br />
J Physiol Endocrinol Metab 278, E65–E75.<br />
Cassidy A, Bingham SA, Cummings JH (1994). Starch intake and<br />
colorectal cancer risk: an international comparison. Br J Cancer 69,<br />
937–942.<br />
Castiglia-Delavaud C, Verdier E, Besle JM, Vernet J, Boirie Y, Beaufrere<br />
B et al. (1998). Net energy value of non-starch polysaccharide<br />
isolates (sugarbeet fibre and commercial inulin) and their impact<br />
on nutrient digestive utilization in healthy human subjects. Br<br />
J Nutr 80, 343–352.<br />
Centres for Disease Control and Prevention (CDC) (2004). Trends in<br />
intake of energy and macronutrients—United States, 1971–2000.<br />
MMWR Morb Mortal Wkly Rep 53, 80–82.<br />
S69<br />
European Journal of Clinical Nutrition
S70<br />
Physiological aspects of energy metabolism<br />
M Elia and JH Cummings<br />
Champ M, Langkilde A-M, Brouns F et al. (2003). Advances in dietary<br />
fibre characterization. 2. Consumption, chemistry, physiology and<br />
measurement of resistant starch; implications for food health and<br />
food labelling. Nutr Res Rev 16, 143–161.<br />
Chen H-L, Lu Y-H, Lin JJ, Ko L-Y (2000). Effects of fructooligosaccharide<br />
on bowel function and indicators of nutritional status<br />
in constipated elderly men. Nutr Res 20, 1725–1733.<br />
Commission E (2006). Directive 90/496/EEC on Nutrition Labelling of<br />
Foodstuffs: Discussion Paper on Revision of Technical Issues. Services<br />
for the European Commission.<br />
Connor H, Annan F, Bunn E, Frost G, McGough N, Sarwar T et al.<br />
(2003). The implementation of nutritional advice for people with<br />
diabetes. Diabet Med 20, 786–807.<br />
Cooke HJ, Reddix RA (1994). Neural regulation of intestinal<br />
electrolyte transport. In: Johnson LR, Alpers DH, Christensen J,<br />
Jacobson ED, Walsh JH (eds). Physiology of the Gastrointestinal Tract.<br />
Raven Press, New York, pp 2083–2132.<br />
Cummings JH (1981). Dietary fibre. Br Med Bull 37, 65–70.<br />
Cummings JH (1994). Non-starch polysaccharides (dietary fibre)<br />
including bulk laxatives in constipation. In: Kamm MA, Lennard-<br />
Jones JE (eds). Constipation. Wrightson Biomedical Publishing Ltd:<br />
Petersfield, UK, pp 307–314.<br />
Cummings JH (1995). Short-chain fatty acids. In: Gibson GR,<br />
Macfarlane GT (eds). Human Colonic Bacteria. CRC Press: Boca<br />
Raton, FL, pp 101–130.<br />
Cummings JH, Antoine JM, Azpiroz F, Bourdet-Sicard R, Brandtzaeg<br />
P, Calder PC et al. (2004). PASSCLAIM—gut health and immunity.<br />
Eur J Nutr 43 (Suppl 2), II118–II173.<br />
Cummings JH, Beatty ER, Kingman SM, Bingham SA, Englyst HN<br />
(1996). Digestion and physiological properties of resistant starch<br />
in the human large bowel. Br J Nutr 75, 733–747.<br />
Cummings JH, Englyst HN (1991). Measurement of starch fermentation<br />
in the human large intestine. Can J Physiol Pharmacol 69,<br />
121–129.<br />
Cummings JH, Frolich W (1993). Dietary Fibre Intakes in Europe: A<br />
Survey Conducted by Members of the Management Committee of COST<br />
92. Metabolic and Physiological Aspects of Dietary Fibre in Food.<br />
Brussels.<br />
Cummings JH, Hill MJ, Jenkins DJ, Pearson JR, Wiggins HS (1976).<br />
Changes in fecal composition and colonic function due to cereal<br />
fiber. Am J Clin Nutr 29, 1468–1473.<br />
Cummings JH, Macfarlane GT (1991). The control and consequences<br />
of bacterial fermentation in the human colon. J Appl Bacteriol 70,<br />
443–459.<br />
Cummings JH, Macfarlane GT, Englyst HN (2001). Prebiotic<br />
digestion and fermentation. Am J Clin Nutr 73, 415S–420S.<br />
Cummings JH, Rombeau JL, Sakata T (1995). Physiological and Clinical<br />
Aspects of Short-Chain Fatty Acids. Cambridge University Press:<br />
Cambridge.<br />
Cummings JH, Southgate DA, Branch WJ, Wiggins HS, Houston H,<br />
Jenkins DJ et al. (1979). The digestion of pectin in the human gut<br />
and its effect on calcium absorption and large bowel function. Br J<br />
Nutr 41, 477–485.<br />
de Castro JM (1991). Seasonal rhythms of human nutrient intake and<br />
meal pattern. Physiol Behav 50, 243–248.<br />
de Castro JM (2004). Dietary energy density is associated<br />
with increased intake in free-living humans. J Nutr 134,<br />
335–341.<br />
de Castro JM, de Castro ES (1989). Spontaneous meal patterns of<br />
humans: influence of the presence of other people. Am J Clin Nutr<br />
50, 237–247.<br />
Den Hond E, Geypens B, Ghoos Y (2000). Effect of high performance<br />
chicory inulin on constipation. Nutr Res 20, 731–736.<br />
Department of Health (1991). Dietary Reference Values for Food, Energy<br />
and Nutrients for the United Kingdom. HMSO: London.<br />
Diabetes and Nutrition Study Group of European Association for the<br />
Study of Diabetes (2000). Recommendations for the nutritional<br />
management of patients with diabetes mellitus. Eur J Clin Nutr 54,<br />
353–355.<br />
European Journal of Clinical Nutrition<br />
DiMeglio DP, Mattes RD (2000). Liquid versus solid carbohydrate:<br />
effects on food intake and body weight. Int J Obes Relat Metab<br />
Disord 24, 794–800.<br />
Drewnowski A (1998). Energy density, palatability, and satiety:<br />
implications for weight control. Nutr Rev 56, 347–353.<br />
Drossman DA, Camilleri M, Mayer EA, Whitehead WE (2002). AGA<br />
technical review on irritable bowel syndrome. Gastroenterology<br />
123, 2108–2131.<br />
Druce M, Bloom SR (2006). The regulation of appetite. Arch Dis Child<br />
91, 183–187.<br />
Duncan KH, Bacon JA, Weinsier RL (1983). The effects of high and<br />
low energy density diets on satiety, energy intake, and eating time<br />
of obese and nonobese subjects. Am J Clin Nutr 37, 763–767.<br />
Duncan SH, Scott KP, Ramsay AG, Harmsen HJ, Welling GW, Stewart<br />
CS et al. (2003). Effects of alternative dietary substrates on<br />
competition between human colonic bacteria in an anaerobic<br />
fermentor system. Appl Environ Microbiol 69, 1136–1142.<br />
Dutch Nutrition Council (1987). The Energy Values of Polyols. Recommendations<br />
of the Committee on Polyols. Nutrition Council: The Hague.<br />
Eckburg PB, Bik EM, Bernstein CN, Purdom E, Dethlefsen L, Sargent<br />
M et al. (2005). Diversity of the human intestinal microbial flora.<br />
Science 308, 1635–1638.<br />
Elia M (2005). Insights into energy requirements in disease. Public<br />
Health Nutr 8, 1037–1052.<br />
Elia M, Folmer P, Schlatmann A, Goren A, Austin S (1988).<br />
Carbohydrate, fat, and protein metabolism in muscle and in the<br />
whole body after mixed meal ingestion. Metabolism 37, 542–551.<br />
Elia M, Jones MG, Jennings G, Poppitt SD, Fuller NJ, Murgatroyd PR<br />
et al. (1995). Estimation of energy expenditure from specific<br />
activity of urine urea during lengthy subcutaneous NaH 14 CO3<br />
infusion. Am J Physiol 269, E172–E182.<br />
Elia M, Livesey G (1988). Theory and validity of indirect calorimetry<br />
during net lipid synthesis. Am J Clin Nutr 47, 591–607.<br />
Elia M, Livesey G (1992). Energy expenditure and fuel selection in<br />
biological systems: the theory and practice of calculations based<br />
on indirect calorimetry and tracer methods. World Rev Nutr Diet<br />
70, 68–131.<br />
Elia M, Stratton R, Stubbs J (2003). Techniques for the study of energy<br />
balance in man. Proc Nutr Soc 62, 529–537.<br />
Englyst HN, Cummings JH (1987). Digestion of polysaccharides<br />
of potato in the small intestine of man. Am J Clin Nutr 45,<br />
423–431.<br />
Englyst KN, S Liu, Englyst HN (2007). Nutritional characterisation<br />
and measurement of dietary carbohydrates. Eur J Clin Nutr 61<br />
(Suppl 1), S19–S39.<br />
European Communities (1990). Directive 90/496/EEC. Nutrition<br />
labelling for foodstuffs. Off J Eur Commun L276, 40–44.<br />
Fanaro S, Boehm G, Garssen J, Knol J, Mosca F, Stahl B et al. (2005).<br />
Galacto-oligosaccharides and long-chain fructo-oligosaccharides as<br />
prebiotics in infant formulas: a review. Acta Paediatr Suppl 94,22–26.<br />
FAO (1998). Carbohydrates in human nutrition. Report of a Joint FAO/<br />
WHO Expert Consultation. FAO Food and Nutrition Paper No. 66.<br />
FAO: Rome.<br />
FAO (2003). Food Energy—Methods of Analysis and Conversion Factors.<br />
FAO: Rome.<br />
FAO/WHO/UNU (1985). Energy and Protein Requirements. WHO:<br />
Geneva.<br />
FAO/WHO/UNU (2004). Human Energy Requirements. Food and<br />
Nutrition Technical Series 1. FAO: Rome.<br />
FASEB (1994). The Evaluation of the Energy of Certain Sugar Alcohols Used<br />
as Food Ingredients. Life Science Research Office: Bethesda, MD.<br />
Finley JW, Leveille GA (1996). Macronutrient substitutes. In:<br />
Zeigler EE, Filer LJ (eds). Present Knowledge in Nutrition. ILSI Press:<br />
Washington, DC, pp 581–595.<br />
Flatt JP (1978). The biochemistry of energy expenditure. In: Bray GA<br />
(ed). Recent Advances in Obesity Research. Newman Publications<br />
Limited: London, pp 221–228.<br />
Flatt JP (1980). Energetics of intermediary metabolism. In: Assessment<br />
of Energy Metabolism in Health and Disease. Report of the First ROSS
Conference on Medical Research. Ross Laboratories: Columbus, OH,<br />
pp 77–87.<br />
Flatt JP (1987). The difference in the storage capacities for<br />
carbohydrate and for fat, and its implications in the regulation<br />
of body weight. Ann N Y Acad Sci 499, 104–123.<br />
Flatt JP (1992). Energy costs of ATP synthesis. In: Kinney JM, Tucker<br />
HN (eds). Energy Metabolism: Tissue Determinants and Cellular<br />
Corollaries. Raven Press: New York, pp 319–343.<br />
Flickinger EA, Fahey Jr GC (2002). Pet food and feed applications of<br />
inulin, oligofructose and other oligosaccharides. Br J Nutr 87<br />
(Suppl 2), S297–S300.<br />
Flourie B, Florent C, Jouany JP, Thivend P, Etanchaud F, Rambaud JC<br />
(1986). Colonic metabolism of wheat starch in healthy humans.<br />
Effects on fecal outputs and clinical symptoms. Gastroenterology<br />
90, 111–119.<br />
Francis CY, Whorwell PJ (1994). Bran and irritable bowel syndrome:<br />
time for reappraisal. Lancet 344, 39–40.<br />
Freedman MR, King J, Kennedy E (2001). Popular diets: a scientific<br />
review. Obes Res 9 (Suppl 1), 1S–40S.<br />
Friedman MI, Ramirez I, Bowden CR, Tordoff MG (1990). Fuel<br />
partitioning and food intake: role for mitochondrial fatty acid<br />
transport. Am J Physiol 258, R216–R221.<br />
Friedman MI, Stricker EM (1976). The physiological psychology of<br />
hunger: a physiological perspective. Psychol Rev 83, 409–431.<br />
Friedman MI, Tordoff MG (1986). Fatty acid oxidation and glucose<br />
utilization interact to control food intake in rats. Am J Physiol 251,<br />
R840–R845.<br />
Fryer JH (1958). The effects of a late-night caloric supplement upon<br />
body weight and food intake in man. Am J Clin Nutr 6, 354–364.<br />
Fuller NJ, Jebb SA, Laskey MA, Coward WA, Elia M (1992). Fourcomponent<br />
model for the assessment of body composition in<br />
humans: comparison with alternative methods and evaluation of<br />
the density and hydration of fat-free mass. Clin Sci 82, 687–693.<br />
Garg A (1998). High-monounsaturated-fat diets for patients with<br />
diabetes mellitus: a meta-analysis. Am J Clin Nutr 67, 577S–582S.<br />
Garrow JS (1988). Obesity and Related Diseases. Churchill Livingstone:<br />
Edinburgh.<br />
Gibney E, Elia M, Jebb SA, Murgatroyd P, Jennings G (1996). Total<br />
energy expenditure in patients with small cell lung cancer: results<br />
of a validated study using the bicarbonate-urea method. Metabolism<br />
46, 1412–1417.<br />
Gibney ER, Murgatroyd P, Wright A, Jebb S, Elia M (2003).<br />
Measurement of total energy expenditure in grossly obese women:<br />
comparison of the bicarbonate-urea method with whole-body<br />
calorimetry and free-living doubly labelled water. Int J Obes Relat<br />
Metab Disord 27, 641–647.<br />
Gibson GR, Beatty ER, Wang X, Cummings JH (1995). Selective<br />
stimulation of bifidobacteria in the human colon by oligofructose<br />
and inulin. Gastroenterology 108, 975–982.<br />
Gibson GR, McCartney AL, Rastall RA (2005). Prebiotics and<br />
resistance to gastrointestinal infections. Br J Nutr 93 (Suppl 1),<br />
S31–S34.<br />
Gibson GR, Probert HM, Van Loo J, Rastall RA, Roberfroid M (2004).<br />
Dietary modulation of the human colonic microbiota: updating<br />
the concept of prebiotics. Nutr Res Rev 17, 259–275.<br />
Gibson GR, Roberfroid MB (1995). Dietary modulation of the human<br />
colonic microbiota: introducing the concept of prebiotics. J Nutr<br />
125, 1401–1412.<br />
Gil KM, Skeie B, Kvetan V, Askanazi J, Friedman MI (1991). Parenteral<br />
nutrition and oral intake: effect of glucose and fat infusions. JPEN J<br />
Parenter Enteral Nutr 15, 426–432.<br />
Goldring JM (2004). Resistant starch: safe intakes and legal status.<br />
J AOAC Int 87, 733–739.<br />
Gostner A, Schaffer V, Theis S, Menzel T, Luhrs H, Melcher R et al.<br />
(2005). Effects of isomalt consumption on gastrointestinal and<br />
metabolic parameters in healthy volunteers. Br J Nutr 94, 575–581.<br />
Haber GB, Heaton KW, Murphy D, Burroughs LF (1977). Depletion<br />
and disruption of dietary fibre. Effects on satiety, plasma-glucose,<br />
and serum-insulin. Lancet 2, 679–682.<br />
Physiological aspects of energy metabolism<br />
M Elia and JH Cummings<br />
Harper JA, Dickinson K, Brand MD (2001). Mitochondrial uncoupling<br />
as a target for drug development for the treatment of obesity.<br />
Obes Rev 2, 255–265.<br />
Heijnen ML, van Amelsvoort JM, Deurenberg P, Beynen AC (1998).<br />
Limited effect of consumption of uncooked (RS2) or retrograded<br />
(RS3) resistant starch on putative risk factors for colon cancer in<br />
healthy men. Am J Clin Nutr 67, 322–331.<br />
Henderson L, Gregory J, Irving K, Swan G (2003). The National Diet &<br />
Nutrition Survey: Adults Aged 19 to 64 Years. Energy, Protein,<br />
Carbohydrate, Fat and Alcohol Intake. The Stationery Office:<br />
London.<br />
Heymsfield SB, Lohman TG, Wang W, Going SB (2005). Human Body<br />
Composition, 2nd edn. Human Kinetics: Champaign, IL.<br />
Hudson GJ, Englyst HN (1993). UK and some other countries. In:<br />
Cummings JH, Frolich W (eds). Dietary Fibre Intakes in Europe.<br />
CEC—Directorate General, Science, Research & Development:<br />
Brussels, pp 83–87.<br />
Hylla S, Gostner A, Dusel G, Anger H, Bartram HP, Christl SU et al.<br />
(1998). Effects of resistant starch on the colon in healthy<br />
volunteers: possible implications for cancer prevention. Am J Clin<br />
Nutr 67, 136–142.<br />
Institute of Medicine (2005). Dietary Reference Intakes for Energy,<br />
Carbohydrate, Fiber, Fat, Fatty Acids, Protein, and Amino Acids. The<br />
National Academies Press: Washington, DC.<br />
Ito M, Deguchi Y, Miyamori A, Matsumoto K, Kiluchi H, Matsumoto<br />
K et al. (1990). Effects of administration of galactooligosaccharides<br />
on the human faecal microflora, stool weight and abdominal<br />
sensation. Microb Ecol Health Dis 3, 285–292.<br />
James J, Kerr D (2005). Prevention of childhood obesity by reducing<br />
soft drinks. Int J Obes (Lond) 29 (Suppl 2), S54–S57.<br />
James J, Thomas P, Cavan D, Kerr D (2004). Preventing childhood<br />
obesity by reducing consumption of carbonated drinks: cluster<br />
randomised controlled trial. BMJ 328, 1237.<br />
Japanese Ministry of Health and Welfare (1991). Japanese Ministry<br />
of Health and Welfare Official Notice: Evaluation of the Energy Value of<br />
Indigestible Carbohydrates in Nutritive Foods. Docket Number Ei-shin<br />
71. Japanese Ministry of Health and Welfare: Tokyo.<br />
Jeukendrup AE (2004). Carbohydrate intake during exercise and<br />
performance. Nutrition 20, 669–677.<br />
Johnson J, Vickers Z (1993). Effects of flavor and macronutrient<br />
composition of food servings on liking, hunger and subsequent<br />
intake. Appetite 21, 25–39.<br />
Johnstone AM, Stubbs RJ, Harbron CG (1996). Effect of overfeeding<br />
macronutrients on day-to-day food intake in man. Eur J Clin Nutr<br />
50, 418–430.<br />
Kaplan RJ, Greenwood CE (2002). Influence of dietary carbohydrates<br />
and glycaemic response on subjective appetite and food intake in<br />
healthy elderly persons. Int J Food Sci Nutr 53, 305–316.<br />
Kaskoun MC, Johnson RK, Goran MI (1994). Comparison of energy<br />
intake by semiquantitative food-frequency questionnaire with<br />
total energy expenditure by the doubly labeled water method in<br />
young children. Am J Clin Nutr 60, 43–47.<br />
King TS, Elia M, Hunter JO (1998). Abnormal colonic fermentation in<br />
irritable bowel syndrome. Lancet 352, 1187–1189.<br />
Langlands SJ, Hopkins MJ, Coleman N, Cummings JH (2004).<br />
Prebiotic carbohydrates modify the mucosa associated microflora<br />
of the human large bowel. Gut 53, 1610–1616.<br />
Lavin JH, French SJ, Read NW (1997). The effect of sucrose- and<br />
aspartame-sweetened drinks on energy intake, hunger and food<br />
choice of female, moderately restrained eaters. Int J Obes Relat<br />
Metab Disord 21, 37–42.<br />
Ledikwe JH, Blanck HM, Kettel Khan L, Serdula MK, Seymour JD,<br />
Tohill BC et al. (2006). Dietary energy density is associated with<br />
energy intake and weight status in US adults. Am J Clin Nutr 83,<br />
1362–1368.<br />
Lee A, Livesey G, Storey D, Zumbe A (eds). (2001). International<br />
symposium on low-digestible carbohydrates. Br J Nutr 85, S1–S64.<br />
Levine AS, Billington CJ (1994). Appetite and Body Weight Regulation:<br />
Sugar, Fat, and Macronutrient Substitutes. CRC Press: Boca Raton, FL.<br />
S71<br />
European Journal of Clinical Nutrition
S72<br />
Physiological aspects of energy metabolism<br />
M Elia and JH Cummings<br />
Life Sciences Research Office (1994). The Evaluation of the Energy of<br />
Certain Sugar Alcohols used as Food Ingredients. Life Sciences Research<br />
Office, Federation of American Societies for Experimental Biology.<br />
Bethesda, MD.<br />
Lissner L, Levitsky DA, Strupp BJ, Kalkwarf HJ, Roe DA (1987).<br />
Dietary fat and the regulation of energy intake in human subjects.<br />
Am J Clin Nutr 46, 886–892.<br />
Liu YJ, Araujo S, Recker RR, Deng HW (2003). Molecular and genetic<br />
mechanisms of obesity: implications for future management. Curr<br />
Mol Med 3, 325–340.<br />
Livesey G (1984). The energy equivalents of ATP and the energy<br />
values of food proteins and fats. Br J Nutr 51, 15–28.<br />
Livesey G (1986). ATP yields from proteins, fats and carbohydrates<br />
and mitochondrial efficiency in vivo. In: Barry EM, Blondheim SH,<br />
Eliahou HE, Shafir E (eds). Recent Advances in Obesity Research. V.<br />
John Libbey: London, Paris.<br />
Livesey G (1991). Calculating the energy values of foods: towards<br />
new empirical formulae based on diets with varied intakes of<br />
unavailable complex carbohydrates. Eur J Clin Nutr 45, 1–12.<br />
Livesey G (1992). The energy values of dietary fibre and sugar<br />
alcohols for man. Nutr Res Rev 5, 61–84.<br />
Livesey G (2001). A perspective on food energy standards for<br />
nutrition labelling. Br J Nutr 85, 271–287.<br />
Livesey G (2002). Thermogenesis associated with fermentable<br />
carbohydrate in humans, validity of indirect calorimetry, and<br />
implications of dietary thermogenesis for energy requirements,<br />
food energy and body weight. Int J Obes Relat Metab Disord 26,<br />
1553–1569.<br />
Livesey G (2003a). Analytical issues in food energy and composition.<br />
Energy in food labeling—including regulatory and trade issues.<br />
Posited with FAO.<br />
Livesey G (2003b). Health potential of polyols as sugar replacers,<br />
with emphasis on low glycaemic properties. Nutr Res Rev 16,<br />
163–191.<br />
Livesey G, Elia M (1985). Food energy values for artificial feeds for<br />
man. Clin Nutr 4, 99–111.<br />
Livesey G, Elia M (1988). Estimation of energy expenditure, net<br />
carbohydrate oxidation and net fat oxidation and synthesis by<br />
indirect calorimetry. Evaluation of some errors with special<br />
reference to the detailed composition of fuels. Am J Clin Nutr 47,<br />
608–623.<br />
Livesey G, Elia M (1995). Short chain fatty acids as an energy source<br />
in the colon: metabolism and clinical implications. In: Cummings<br />
JH, Rombeau JL, Sakata TT (eds). Physiological and Clinical Aspects<br />
of Short Chain Fatty Acids. Cambridge University Press: Cambridge,<br />
pp 1427–1482.<br />
Livingstone MB, Black AE (2003). Markers of the validity of reported<br />
energy intake. J Nutr 133 (Suppl 3), 895S–920S.<br />
Longstreth GF, Thompson WG, Chey WD, Houghton LA, Mearin F,<br />
Spiller RC (2006). Functional bowel disorders. Gastroenterology<br />
130, 1480–1491.<br />
Ludwig DS (2003). Dietary glycemic index and the regulation of body<br />
weight. Lipids 38, 117–121.<br />
Macfarlane GT, Cummings JH (1991). The colonic flora, fermentation<br />
and large bowel digestive function. In: Phillips SF, Pemberton<br />
JH, Shorter RG (eds). The Large Intestine: Physiology, Pathophysiology<br />
and Disease. Raven Press: New York, pp 51–92.<br />
Macfarlane S, Macfarlane GT (2004). Bacterial diversity in the human<br />
gut. Adv Appl Microbiol 54, 261–289.<br />
Macfarlane S, Macfarlane GT, Cummings JH (2006). Prebiotics in the<br />
gastrointestinal tract. Aliment Pharmacol Ther 24, 701–714.<br />
Mattes R (2006). Fluid calories and energy balance: the good, the bad,<br />
and the uncertain. Physiol Behav 89, 66–70.<br />
Mattes RD (1996). Dietary compensation by humans for supplemental<br />
energy provided as ethanol or carbohydrate in fluids.<br />
Physiol Behav 59, 179–187.<br />
Matthews SB, Waud JP, Roberts AG, Campbell AK (2005). Systemic<br />
lactose intolerance: a new perspective on an old problem. Postgrad<br />
Med J 81, 167–173.<br />
European Journal of Clinical Nutrition<br />
Mayer J (1955). Regulation of energy intake and the body weight: the<br />
glucostatic theory and the lipostatic hypothesis. Ann N Y Acad Sci<br />
63, 15–43.<br />
Mazlam N (2001). Effect of Fat and Carbohydrate on Energy Intake and<br />
Macronutrient Selection in Humans. PhD thesis, University of<br />
Aberdeen.<br />
Merill AL, Watt BK (1973). Energy Value of Foods: Basis and Derivation.<br />
United States Department of Agriculture: Washington, DC.<br />
Miller JB, McVeagh P (1999). Human milk oligosaccharides: 130<br />
reasons to breast-feed. Br J Nutr 82, 333–335.<br />
Montalto M, Curigliano V, Santoro L, Vastola M, Cammarota G,<br />
Manna R et al. (2006). Management and treatment of lactose<br />
malabsorption. World J Gastroenterol 12, 187–191.<br />
Mowat F (1981). People of the Deer. Seal Books: Toronto.<br />
Nanda R, James R, Smith H, Dudley CR, Jewell DP (1989).<br />
Food intolerance and the irritable bowel syndrome. Gut 30,<br />
1099–1104.<br />
Nasrallah SM, Iber FL (1969). Mannitol absorption and metabolism<br />
in man. Am J Med Sci 258, 80–88.<br />
Nightingale JM, Kamm MA, van der Sijp JR, Ghatei MA, Bloom SR,<br />
Lennard-Jones JE (1996). Gastrointestinal hormones in short<br />
bowel syndrome. Peptide YY may be the ‘colonic brake’ to gastric<br />
emptying. Gut 39, 267–272.<br />
Nishida C, Uauy R, Kumanyika S, Shetty P (2004). The joint WHO/<br />
FAO expert consultation on diet, nutrition and the prevention of<br />
chronic diseases: process, product and policy implications. Public<br />
Health Nutr 7, 245–250.<br />
Painter NS, Almeida AZ, Colebourne KW (1972). Unprocessed<br />
bran in treatment of diverticular disease of the colon. BMJ 2,<br />
137–140.<br />
Paton NI, Angus B, Chaowagul W, Simpson AJ, Suputtamongkol Y,<br />
Elia M et al. (2001). Protein and energy metabolism in chronic<br />
bacterial infection: studies in melioidosis. Clin Sci (Lond) 100,<br />
101–110.<br />
Paton NI, Elia M, Jebb SA, Jennings G, Macallan DC, Griffin GE<br />
(1996). Total energy expenditure and physical activity measured<br />
with the bicarbonate-urea method in patients with human<br />
immunodeficiency virus infection. Clin Sci (Lond) 91, 241–245.<br />
Paul AA, Southgate DAT (1978). McCance and Widdowson’s The<br />
Composition of Foods, 4th edn. HMSO: London.<br />
Pawlak DB, Ebbeling CB, Ludwig DS (2002). Should obese patients be<br />
counselled to follow a low-glycaemic index diet? Yes. Obes Rev 3,<br />
235–243.<br />
Phillips J, Muir JG, Birkett A, Lu ZX, Jones GP, O’Dea K et al. (1995).<br />
Effect of resistant starch on fecal bulk and fermentation-dependent<br />
events in humans. Am J Clin Nutr 62, 121–130.<br />
Pool-Zobel BL (2005). Inulin-type fructans and reduction in colon<br />
cancer risk: review of experimental and human data. Br J Nutr 93<br />
(Suppl 1), S73–S90.<br />
Poppitt SD, Prentice AM (1996). Energy density and its role in the<br />
control of food intake: evidence from metabolic and community<br />
studies. Appetite 26, 153–174.<br />
Poppitt SD (1995). Energy density of diets and obesity. Int J Obes Relat<br />
Metab Disord 19 (Suppl 5), S20–S26.<br />
Poppitt SD, Livesey G, Faulks RM, Roe M, Prentice AM, Elia M (1996).<br />
Circadian patterns of total 24-h hydrogen and methane excretion<br />
in humans ingesting nonstarch polysaccharide (NSP) diets and the<br />
implications for indirect calorimetric and D2 18O methodologies.<br />
Eur J Clin Nutr 50, 524–534.<br />
Porikos KP, Booth G, Van Itallie TB (1977). Effect of covert nutritive<br />
dilution on the spontaneous food intake of obese individuals: a<br />
pilot study. Am J Clin Nutr 30, 1638–1644.<br />
Porikos KP, Hesser MF, van Itallie TB (1982). Caloric regulation in<br />
normal-weight men maintained on a palatable diet of conventional<br />
foods. Physiol Behav 29, 293–300.<br />
Prentice AM (1990). The doubly-labelled water method for measuring<br />
energy expenditure. Technical recommendations for use in<br />
humans: a consensus report by the IDECG Working Group<br />
International Atomic Energy Agency NAHRES-4.
Prentice AM, Poppitt SD (1996). Importance of energy density and<br />
macronutrients in the regulation of energy intake. Int J Obes Relat<br />
Metab Disord 20 (Suppl 2), S18–S23.<br />
Pullicino E, Elia M (1991). Intravenous carbohydrate over-feeding: a<br />
method for rapid nutritional repletion. Clin Nutr 10, 146–154.<br />
Raben A (2002). Should obese patients be counselled to follow a lowglycaemic<br />
index diet? No. Obes Rev 3, 245–256.<br />
Raben A, Agerholm-Larsen L, Flint A, Holst JJ, Astrup A (2003). Meals<br />
with similar energy densities but rich in protein, fat, carbohydrate,<br />
or alcohol have different effects on energy expenditure and<br />
substrate metabolism but not on appetite and energy intake. Am<br />
J Clin Nutr 77, 91–100.<br />
Raben A, Macdonald I, Astrup A (1997). Replacement of dietary fat by<br />
sucrose or starch: effects on 14 d ad libitum energy intake, energy<br />
expenditure and body weight in formerly obese and never-obese<br />
subjects. Int J Obes Relat Metab Disord 21, 846–859.<br />
Raben A, Tagliabue A, Christensen NJ, Madsen J, Holst JJ, Astrup A<br />
(1994). Resistant starch: the effect on postprandial glycemia,<br />
hormonal response, and satiety. Am J Clin Nutr 60, 544–551.<br />
Raben A, Vasilaras TH, Moller AC, Astrup A (2002). Sucrose compared<br />
with artificial sweeteners: different effects on ad libitum food<br />
intake and body weight after 10 wk of supplementation in<br />
overweight subjects. Am J Clin Nutr 76, 721–729.<br />
Rabinowitch IM, Fowler AF (1934). Dinitrophenol. Can Med Assoc J<br />
30, 128–133.<br />
Remesy C, Demigne C, Morand C (1995). Metabolism of short-chain<br />
fatty acids in the liver. In: Cummings JH, Rombeau JL, Sakata T<br />
(eds). Physiological and Clinical Aspects of Short-Chain Fatty Acids.<br />
Cambridge University Press: Cambridge, pp 171–190.<br />
Roberfroid M (2005). Inulin-Type Fructans. Functional Food Ingredients.<br />
CRC Press: Boca Raton, FL.<br />
Rodin J (1990). Comparative effects of fructose, aspartame, glucose,<br />
and water preloads on calorie and macronutrient intake. Am J Clin<br />
Nutr 51, 428–435.<br />
Rogers PJ, Carlyle JA, Hill AJ, Blundell JE (1988). Uncoupling sweet<br />
taste and calories: comparison of the effects of glucose and three<br />
intense sweeteners on hunger and food intake. Physiol Behav 43,<br />
547–552.<br />
Rolls BJ (1997). Fat and sugar substitutes and the control of food<br />
intake. In: Rolls BJ, Anderson, GH, Steffen DG (eds). Nutritional<br />
Implications of Macronutrient Substitutes. New York Academy of<br />
Sciences: New York, NY, pp 180–193.<br />
Rolls BJ, Bell EA (1999). Intake of fat and carbohydrate: role of energy<br />
density. Eur J Clin Nutr 53 (Suppl 1), S166–S173.<br />
Rumpler WV, Baer DJ, Rhodes DG (1998). Energy available from corn<br />
oil is not different than that from beef tallow in high- or low-fiber<br />
diets fed to humans. JNutr128, 2374–2382.<br />
Russek M (1963). Participation of hepatic glucoreceptors in the<br />
control of intake of food. Nature 197, 79–80.<br />
Russek M (1976). Hepatic glucoreceptors in the short-term control of<br />
feeding. Acta Physiol Pol 27, 147–156.<br />
Sanchez-Catillo C, Grubb D, Solano ML, Franklin F, James WPT<br />
(1997). Non-starch polysaccharide intakes in Mexican villagers<br />
and residents of Mexico City. Br J Nutr 77, 345–357.<br />
Saris WH, Astrup A, Prentice AM, Zunft HJ, Formiguera X,<br />
Verboeket-van de Venne WP et al. (2000). Randomized controlled<br />
trial of changes in dietary carbohydrate/fat ratio and simple vs<br />
complex carbohydrates on body weight and blood lipids:<br />
the CARMEN study. The Carbohydrate Ratio Management<br />
in European National diets. Int J Obes Relat Metab Disord 24,<br />
1310–1318.<br />
Schulz AR (1975). Computer-based method for calculation of the<br />
available energy of proteins. J Nutr 105, 200–207.<br />
Schulz AR (1978). Simulation of energy metabolism in the simplestomached<br />
animal. Br J Nutr 39, 235–254.<br />
Schulze MB, Manson JE, Ludwig DS, Colditz GA, Stampfer MJ, Willett<br />
WC et al. (2004). Sugar-sweetened beverages, weight gain, and<br />
incidence of type 2 diabetes in young and middle-aged women.<br />
JAMA 292, 927–934.<br />
Physiological aspects of energy metabolism<br />
M Elia and JH Cummings<br />
Sclafani A (1987). Carbohydrate-induced hyperphagia and obesity in<br />
the rat: effects of saccharide type, form, and taste. Neurosci<br />
Biobehav Rev 11, 155–162.<br />
Sclafani A (2001). Psychobiology of food preferences. Int J Obes Relat<br />
Metab Disord 25 (Suppl 5), S13–S16.<br />
Shetty PS, Prentice AM, Goldberg GR, Murgatroyd PR, McKenna AP,<br />
Stubbs RJ et al. (1994). Alterations in fuel selection and voluntary<br />
food intake in response to isoenergetic manipulation of glycogen<br />
stores in humans. Am J Clin Nutr 60, 534–543.<br />
Siavoshian S, Segain JP, Kornprobst M, Bonnet C, Cherbut C,<br />
Galmiche JP et al. (2000). Butyrate and trichostatin A effects on<br />
the proliferation/differentiation of human intestinal epithelial<br />
cells: induction of cyclin D3 and p21 expression. Gut 46, 507–514.<br />
Silvester KR, Bingham SA, Pollock JR, Cummings JH, O’Neill IK<br />
(1997). Effect of meat and resistant starch on fecal excretion of<br />
apparent N-nitroso compounds and ammonia from the human<br />
large bowel. Nutr Cancer 29, 13–23.<br />
Silvester KR, Englyst HN, Cummings JH (1995). Ileal recovery of<br />
starch from whole diets containing resistant starch measured in<br />
vitro and fermentation of ileal effluent. Am J Clin Nutr 62, 403–411.<br />
Snitker S, Larson DE, Tataranni PA, Ravussin E (1997). Ad libitum food<br />
intake in humans after manipulation of glycogen stores. Am J Clin<br />
Nutr 65, 941–946.<br />
Snook J, Shepherd HA (1994). Bran supplementation in the<br />
treatment of irritable bowel syndrome. Aliment Pharmacol Ther 8,<br />
511–514.<br />
Southgate DA (1969). Determination of carbohydrates in foods. II.<br />
Unavailable carbohydrates. J Sci Food Agric 20, 331–335.<br />
Spengler M, Boehme K (1984). Tolerance and Acceptance of Isomalt<br />
Study 26 report no. 13850, Wupperpal, Germany (Rn Study 26, editor:<br />
Bayer AG Pharmaceuticals Division).<br />
Spiegelman BM, Flier JS (2001). Obesity and the regulation of energy<br />
balance. Cell 104, 531–543.<br />
Stephen A (1993). Proprionate—sources and effect on lipid metabolism.<br />
In: Binder HJ, Cummings JH, Soergel KH (eds). Short-Chain<br />
Fatty Acids. Falk Symposium. Kluwer Academic Publishers, Dordrecht,<br />
pp 260–271.<br />
Stephen AM, Cummings JH (1980). Mechanism of action of dietary<br />
fibre in the human colon. Nature 284, 283–284.<br />
Stephen AM, Haddad AC, Phillips SF (1983). Passage of carbohydrate<br />
into the colon. Direct measurements in humans. Gastroenterology<br />
85, 589–595.<br />
Stephen AM, Sieber GM, Gerster YA, Morgan DR (1995). Intake of<br />
carbohydrate and its components—international comparisons,<br />
trends over time, and effects of changing to low-fat diets. Am J Clin<br />
Nutr 62, 851S–867S.<br />
Stevens J (1988). Does dietary fiber affect food intake and body<br />
weight? J Am Diet Assoc 88, 939–942; 945.<br />
Stock MJ (1999). Gluttony and thermogenesis revisited. Int J Obes<br />
Relat Metab Disord 23, 1105–1117.<br />
Stollman N, Raskin JB (2004). Diverticular disease of the colon.<br />
Lancet 363, 631–639.<br />
Stubbs J, Ferres S, Horgan G (2000). Energy density of foods: effects<br />
on energy intake. Crit Rev Food Sci Nutr 40, 481–515.<br />
Stubbs RJ, Harbron CG, Murgatroyd PR, Prentice AM (1995a). Covert<br />
manipulation of dietary fat and energy density: effect on substrate<br />
flux and food intake in men eating ad libitum. Am J Clin Nutr 62,<br />
316–329.<br />
Stubbs RJ, Harbron CG, Prentice AM (1996). Covert manipulation of<br />
the dietary fat to carbohydrate ratio of isoenergetically dense diets:<br />
effect on food intake in feeding men ad libitum. Int J Obes Relat<br />
Metab Disord 20, 651–660.<br />
Stubbs RJ, Hughes DA, Johnstone AM, Whybrow S, Horgan GW, King<br />
N et al. (2004). Rate and extent of compensatory changes in energy<br />
intake and expenditure in response to altered exercise and diet<br />
composition in humans. Am J Physiol Regul Integr Comp Physiol<br />
286, R350–R358.<br />
Stubbs RJ, Ritz P, Coward WA, Prentice AM (1995b). Covert<br />
manipulation of the ratio of dietary fat to carbohydrate and<br />
S73<br />
European Journal of Clinical Nutrition
S74<br />
Physiological aspects of energy metabolism<br />
M Elia and JH Cummings<br />
energy density: effect on food intake and energy balance in freeliving<br />
men eating ad libitum. Am J Clin Nutr 62, 330–337.<br />
Stubbs RJ, Whybrow S (2004). Energy density, diet composition and<br />
palatability: influences on overall food energy intake in humans.<br />
Physiol Behav 81, 755–764.<br />
Tainter ML, Stockton AB, Cutting WC (1935). Dinitrophenol in the<br />
treatment of obesity. Final report. JAMA 105, 332–337.<br />
Talley NJ, Spiller R (2002). Irritable bowel syndrome: a little<br />
understood organic bowel disease? Lancet 360, 555–564.<br />
Tang NL, Chung ML, Elia M, Hui E, Lum CM, Luk JK et al. (2002).<br />
Total daily energy expenditure in wasted chronic obstructive<br />
pulmonary disease patients. Eur J Clin Nutr 56, 282–287.<br />
Taylor R, Price TB, Rothman DL, Shulman RG, Shulman GI (1992).<br />
Validation of 13C NMR measurement of human skeletal muscle<br />
glycogen by direct biochemical assay of needle biopsy samples.<br />
Magn Reson Med 27, 13–20.<br />
Teuri U, Korpela R (1998). Galacto-oligosaccharides relieve constipation<br />
in elderly people. Ann Nutr Metab 42, 319–327.<br />
Thompson DA, Campbell RG (1977). Hunger in humans induced by<br />
2-deoxy-D-glucose: glucoprivic control of taste preference and<br />
food intake. Science 198, 1065–1068.<br />
Thompson DA, Welle SL, Lilavivat U, Penicaud L, Campbell RG<br />
(1982). Opiate receptor blockade in man reduces 2-deoxy-Dglucose-induced<br />
food intake but not hunger, thirst, and hypothermia.<br />
Life Sci 31, 847–852.<br />
Titter S, Calingasan NY (1994). Neural Substrates for Metabolic Control<br />
of Feeding. CRC Press: Boca Raton, FL.<br />
Todesco T, Rao AV, Bosello O, Jenkins DJ (1991). Propionate lowers<br />
blood glucose and alters lipid metabolism in healthy subjects. Am J<br />
Clin Nutr 54, 860–865.<br />
Tomlin J, Read NW (1990). The effect of resistant starch on colon<br />
function in humans. Br J Nutr 64, 589–595.<br />
Tordoff MG, Alleva AM (1990a). Effect of drinking soda sweetened<br />
with aspartame or high-fructose corn syrup on food intake and<br />
body weight. Am J Clin Nutr 51, 963–969.<br />
Tordoff MG, Alleva AM (1990b). Oral stimulation with aspartame<br />
increases hunger. Physiol Behav 47, 555–559.<br />
Tremblay A (1992). Human obesity: a defect in lipid oxidation or in<br />
thermogenesis? Int J Obes Relat Metab Disord 16, 953–957.<br />
Tremblay A, Lavallee N, Almeras N, Allard L, Despres JP, Bouchard C<br />
(1991). Nutritional determinants of the increase in energy intake<br />
associated with a high-fat diet. Am J Clin Nutr 53, 1134–1137.<br />
Truswell AS, Seach JM, Thorburn AW (1988). Incomplete absorption<br />
of pure fructose in healthy subjects and the facilitating effect of<br />
glucose. Am J Clin Nutr 48, 1424–1430.<br />
European Journal of Clinical Nutrition<br />
van Dokkum W, Wezendonk B, Srikumar TS, van den Heuvel EG<br />
(1999). Effect of nondigestible oligosaccharides on large-bowel<br />
functions, blood lipid concentrations and glucose absorption in<br />
young healthy male subjects. Eur J Clin Nutr 53, 1–7.<br />
van Loo J, Coussement P, de Leenheer L, Hoebregs H, Smits G<br />
(1995). On the presence of inulin and oligofructose as<br />
natural ingredients in the western diet. Crit Rev Food Sci Nutr 35,<br />
525–552.<br />
van Munster IP, Tangerman A, Nagengast FM (1994). Effect of<br />
resistant starch on colonic fermentation, bile acid metabolism,<br />
and mucosal proliferation. Dig Dis Sci 39, 834–842.<br />
van Stratum P, Lussenburg RN, van Wezel LA, Vergroesen AJ, Cremer<br />
HD (1978). The effect of dietary carbohydrate: fat ratio on energy<br />
intake by adult women. Am J Clin Nutr 31, 206–212.<br />
Warren JM, Henry CJ, Simonite V (2003). Low glycemic index<br />
breakfasts and reduced food intake in preadolescent children.<br />
Pediatrics 112, e414.<br />
Warwick PM, Baines J (2000). Point of view: energy factors for food<br />
labelling and other purposes should be derived in a consistent<br />
fashion for all food components. Br J Nutr 84, 897–902.<br />
Welle SL, Thompson DA, Campbell RG, Lilavivathana U (1980).<br />
Increased hunger and thirst during glucoprivation in humans.<br />
Physiol Behav 25, 397–403.<br />
Westerterp KR, Goris AH (2002). Validity of the assessment of dietary<br />
intake: problems of misreporting. Curr Opin Clin Nutr Metab Care 5,<br />
489–493.<br />
Westerterp-Plantenga MS (2001). Analysis of energy density of food<br />
in relation to energy intake regulation in human subjects. Br J Nutr<br />
85, 351–361.<br />
Weststrate JA (1992). Effect of Nutrients on the Regulation of Food Intake.<br />
Unilever Vlaardingen, The Netherlands.<br />
WHO (2003). Diet, nutrition and the prevention of chronic diseases.<br />
Report of a Joint WHO/FAO Expert Consultation. WHO Technical<br />
Report Series No. 916. World Health Organization: Geneva.<br />
Williams CM, Jackson KG (2002). Inulin and oligofructose: effects on<br />
lipid metabolism from human studies. Br J Nutr 87 (Suppl 2),<br />
S261–S264.<br />
Yu-Poth S, Zhao G, Etherton T, Naglak M, Jonnalagadda S, Kris-<br />
Etherton PM (1999). Effects of the national cholesterol education<br />
program’s step I and step II dietary intervention programs on<br />
cardiovascular disease risk factors: a meta-analysis. Am J Clin Nutr<br />
69, 632–646.<br />
Zittermann A, Bock P, Drummer C, Scheld K, Heer M, Stehle P (2000).<br />
Lactose does not enhance calcium bioavailability in lactosetolerant,<br />
healthy adults. Am J Clin Nutr 71, 931–936.
REVIEW<br />
Carbohydrate intake and obesity<br />
RM van Dam 1,2,3 and JC Seidell 3<br />
1 Department of Nutrition, Harvard School of Public Health, Boston, MA, USA; 2 Channing Laboratory, Department of Medicine,<br />
Brigham and Women’s Hospital, and Harvard Medical School, Boston, MA, USA and 3 Institute of Health Sciences, Vrije Universiteit<br />
Amsterdam, Amsterdam, The Netherlands<br />
The prevalence of obesity has increased rapidly worldwide and the importance of considering the role of diet in the prevention<br />
and treatment of obesity is widely acknowledged. This paper reviews data on the effects of dietary carbohydrates on body<br />
fatness. Does the composition of the diet as related to carbohydrates affect the likelihood of passive over-consumption and longterm<br />
weight change? In addition, methodological limitations of both observational and experimental studies of dietary<br />
composition and body weight are discussed. Carbohydrates are among the macronutrients that provide energy and can thus<br />
contribute to excess energy intake and subsequent weight gain. There is no clear evidence that altering the proportion of total<br />
carbohydrate in the diet is an important determinant of energy intake. However, there is evidence that sugar-sweetened<br />
beverages do not induce satiety to the same extent as solid forms of carbohydrate, and that increases in sugar-sweetened soft<br />
drink consumption are associated with weight gain. Findings from studies on the effect of the dietary glycemic index on body<br />
weight have not been consistent. Dietary fiber is associated with a lesser degree of weight gain in observational studies.<br />
Although it is difficult to establish with certainty that fiber rather than other dietary attributes are responsible, whole-grain<br />
cereals, vegetables, legumes and fruits seem to be the most appropriate sources of dietary carbohydrate.<br />
European Journal of Clinical Nutrition (2007) 61 (Suppl 1), S75–S99. doi:10.1038/sj.ejcn.1602939<br />
Keywords: obesity; diet; carbohydrate; fiber; sugar; glycemic index<br />
General introduction<br />
Background<br />
The prevalence of overweight and obesity has increased<br />
rapidly worldwide during recent decades, acquiring epidemic<br />
proportions in children and adults and in industrialized as<br />
well as transitional and developing countries (Popkin and<br />
Gordon-Larsen, 2004; Ogden et al., 2006). Excess adiposity<br />
increases risk of type 2 diabetes, arthritis, sleep apnea,<br />
hypertension, dyslipidemia, cardiovascular diseases, various<br />
types of cancer and premature death (Willett et al., 1999).<br />
Therefore, the importance of prevention and treatment of<br />
obesity is widely acknowledged. Changes in energy storage<br />
as body fat are affected by the balance of energy intake and<br />
energy expenditure, making diet and physical activity<br />
obvious targets for interventions. Effects of dietary composition<br />
on both energy intake and energy expenditure (dietary<br />
induced thermogenesis and resting energy metabolism) are<br />
plausible, based on results from animal experiments and<br />
metabolic studies in humans (Poppitt and Prentice, 1996;<br />
Correspondence: Dr RM van Dam, Department of Nutrition, Harvard School<br />
of Public Health, 665 Huntington Avenue, Boston, MA 02115, USA.<br />
E-mail: rvandam@hsph.harvard.edu<br />
European Journal of Clinical Nutrition (2007) 61 (Suppl 1), S75–S99<br />
& 2007 Nature Publishing Group All rights reserved 0954-3007/07 $30.00<br />
www.nature.com/ejcn<br />
Ludwig, 2002; Bray et al., 2004a, b; Halton and Hu, 2004;<br />
Slavin, 2005). Although substantial short-term weight loss can<br />
be achieved by many people, successful long-term maintenance<br />
of weight loss is much more difficult and compensatory<br />
physiological processes appear to stimulate weight regain<br />
(Hirsch et al., 1998). Effects on body weight found in shortterm<br />
metabolic studies can therefore not be readily extrapolated<br />
to long-term effects. This overview will present<br />
evidence for the effects of dietary composition related to<br />
carbohydrates on body fatness. Dietary factors that will be<br />
discussed include the proportion of total carbohydrates in<br />
the diet, free-sugars, sugar-sweetened beverages, the dietary<br />
glycemic index (GI) and dietary fiber. Studies have been<br />
identified through systematic and narrative reviews on these<br />
topics supplemented with searches in MEDLINE (PubMed)<br />
until July 2007. The emphasis is on longer-term studies, but<br />
shorter-term studies are also discussed depending on the<br />
availability of data for different exposures.<br />
Methodological considerations for studies relating diet to body<br />
weight<br />
Methodological limitations have to be considered in the<br />
interpretation of results on macronutrient composition in
S76<br />
relation to weight change or the incidence of obesity. We<br />
will discuss these methodological limitations separately for<br />
observational and experimental studies.<br />
Observational studies. In these studies, individuals typically<br />
report their food intakes by interviews or questionnaires, and<br />
the obtained estimates are related to their body mass index<br />
(BMI) or change in body weight. There are several methodological<br />
issues that make results from observational studies<br />
of diet and body weight difficult to interpret. First, the<br />
possibility of an effect of perceived body weight or changes<br />
in body weight on dietary habits (‘reverse causation’) should<br />
be considered. In contrast to various other health outcomes,<br />
people tend to be highly aware of their body weight and<br />
changes therein. In addition, many people hold strong<br />
beliefs about the relation between the composition of the<br />
diet and body weight and have control over two of the main<br />
determinants of body weight: energy intake and energy<br />
expenditure through physical activity. Cross-sectional studies<br />
where diet and measures of obesity are assessed<br />
simultaneously are therefore difficult to interpret: the<br />
perception that their body weight is high or increasing<br />
may lead persons to change their dietary habits (for example,<br />
dieting). For this reason, prospective observational studies<br />
relating dietary intakes to changes in body weight would be<br />
preferable. However, because changes in energy balance are<br />
likely to almost directly translate into changes in body<br />
weight, it seems biologically most relevant to study changes<br />
in dietary intakes in relation to changes in body weight over<br />
the same period. Because the exposure is not assessed before<br />
the outcome, such an analysis is not truly prospective and<br />
associations may still reflect an effect of perceived changes in<br />
body weight on changes in dietary habits over the same<br />
period.<br />
Second, selective underreporting of dietary intakes can be<br />
correlated with the degree of overweight (Heitmann and<br />
Lissner, 1995; Heerstrass et al., 1998). There are indications<br />
that intakes of carbohydrates and fat are more subject to<br />
underreporting than intakes of protein and this can bias<br />
results of studies of macronutrient composition and body<br />
weight.<br />
Third, dietary intakes and reporting thereof can be<br />
correlated to many other characteristics such as age, sex,<br />
socioeconomic status and other health-related habits that<br />
may affect energy balance (Braam et al., 1998). These<br />
characteristics can confound the association between dietary<br />
intakes and body weight. For example, individuals who are<br />
able to adhere to a generally recommended diet for weight<br />
management (for example, a low-fat diet) are also more<br />
likely to be able to adhere to limited total energy intake.<br />
Also, associations between (changes in) dietary intakes and<br />
energy balance have to be interpreted in the context of<br />
(changes in) energy expenditure. The latter is notoriously<br />
difficult to assess and is also subject to reporting bias. These<br />
methodological issues complicate the interpretation of data<br />
European Journal of Clinical Nutrition<br />
Carbohydrate intake and obesity<br />
RM van Dam and JC Seidell<br />
on macronutrient intakes and changes therein in relation to<br />
adiposity in observational studies.<br />
Experimental studies. In evidence-based medicine, a stronger<br />
weight is generally given to long-term randomized experimental<br />
studies than to observational studies. In the last<br />
several decades, many disputes have been published on the<br />
interpretation of experimental studies that have manipulated<br />
macronutrient composition of diets and evaluated<br />
changes in body weight. The same data can be interpreted in<br />
different ways. Some authors have argued that an increasing<br />
proportion of energy coming from fat leads to greater weight<br />
gain (Bray et al., 2004b), whereas others have concluded that<br />
the proportion of energy from fat does not substantially<br />
influence body weight (Willett, 2002). An important issue<br />
here is that the outcomes of experimental studies seem to<br />
be dependent on the choice of subjects (for example,<br />
overweight versus normal weight subjects), the duration of<br />
the experiment (short-term trials of days or weeks versus<br />
trials that last several years) and the choice of foods that have<br />
been used to manipulate macronutrient composition. With<br />
respect to the latter issue, a low-fat, high-carbohydrate diet<br />
can be a diet consisting mainly of highly refined grains and<br />
products with added sugar, or a diet that is close to being a<br />
traditional vegetarian diet (that is, with plenty of whole<br />
grains, legumes, fruits and vegetables). In addition, the effect<br />
of macronutrients on satiety and energy expenditure may<br />
depend on the way diets are administered. Energy intake is<br />
the outcome of the portion size energy density frequency<br />
of consumption, and all the three factors can be altered<br />
experimentally in relation to macronutrient composition.<br />
Furthermore, experimental studies in humans rely on the<br />
degree of successful (preferably double blinded) randomization<br />
and on the compliance of subjects with dietary<br />
regimens. Because both issues are problematic for long-term<br />
trials of macronutrient intakes and weight change, the<br />
strength of the evidence provided by randomized controlled<br />
trials can be limited. Finally, experimental studies can be<br />
performed by changing macronutrient intake with fixed or<br />
ad libitum energy intakes and only the latter will provide us<br />
with insights that are directly relevant for public health.<br />
Effects of dietary intakes in the context of weight management<br />
in obese persons may be different from the effects on<br />
prevention of weight gain in leaner persons. The transition<br />
from normal weight to obesity can result in changes in the<br />
levels of hormones such as insulin, leptin and adiponectin,<br />
which may alter relative substrate oxidation (fat versus<br />
carbohydrates) and appetite control (Blaak, 2004; Schwartz<br />
and Porte, 2005). In addition, the obese state alters basal and<br />
24-h energy requirements as well as the sensitivity to various<br />
hormones such as insulin and leptin. One should therefore<br />
be cautious in the extrapolation of findings from experimental<br />
studies on macronutrient composition and weight<br />
loss in obese persons, to the role of macronutrients in the<br />
prevention of weight gain.
Total carbohydrate intake<br />
Introduction<br />
Weight gain is the result of higher energy intake than energy<br />
expenditure. This is also known as a positive energy balance.<br />
The total amount of energy (expressed in units of kilocalories<br />
or kilojoules per day) ingested by food and drinks come from<br />
four major nutrients (macronutrients).<br />
Macronutrient kJ/g kcal/g<br />
Fat 37 9<br />
Alcohol 29 7<br />
Protein 17 4<br />
Carbohydrate 16 4<br />
As shown in the table above, fat contains more energy per<br />
gram than carbohydrates. Carbohydrates, however, also<br />
provide energy and therefore contribute to the total energy<br />
intake per day and thus potentially to a positive energy<br />
balance. One of the most controversial questions in human<br />
nutrition in recent decades has been whether it matters for<br />
energy balance what the relative contribution of macronutrients<br />
is to the total energy intake. Potentially, there<br />
could be the differences because of variations in effects on<br />
appetite and satiety or in effects on oxidation and energy<br />
expenditure for different macronutrients. Specifically, it has<br />
been suggested that a higher proportion of fat in the diet can<br />
lead to weight gain through excess energy intake, because it<br />
is less satiating than the same amount of energy from<br />
carbohydrates (Bray et al., 2004b). Others have suggested<br />
that proteins are particularly satiating (Halton and Hu,<br />
2004). The answer to this question is important because if<br />
energy intake in the form of one macronutrient is more<br />
likely to lead to a positive energy balance than energy intake<br />
from other macronutrients, this would provide the basis to<br />
emphasize the reduction of the intake of the former<br />
macronutrient in recommendations for prevention of weight<br />
gain or for achieving weight loss in overweight persons.<br />
Before discussing evidence on the relation between carbohydrate<br />
content of the diet and body weight, we will discuss<br />
research on energy density, because it is frequently considered<br />
to be an important mediator of effects of dietary<br />
composition on energy balance.<br />
Energy density<br />
Carbohydrates and energy density. The energy density is the<br />
amount of energy per unit of weight of foods, meals or diets<br />
(Prentice and Jebb, 2003; Stubbs and Whybrow, 2004).<br />
Carbohydrate provides less energy per gram than fat and is<br />
thus less energy dense. However, few foods only contain<br />
macronutrients, and the fiber and particularly the water<br />
content (or conversely, the dryness) has a major effect on the<br />
energy density of foods (Drewnowski et al., 2004). As a result,<br />
foods with a high energy percentage of carbohydrates can<br />
Carbohydrate intake and obesity<br />
RM van Dam and JC Seidell<br />
Lettuce<br />
Vegetable soup<br />
Skim milk<br />
Apple<br />
Black beans<br />
White fish<br />
Yogurt<br />
Vegetable lasagna<br />
Roast chicken<br />
White bread<br />
Pretzels<br />
Cheddar cheese<br />
Salad dressing<br />
Potato chips<br />
Bacon<br />
Butter<br />
0 1 2 3 4 5 6 7 8<br />
Energy Density (kcal/g)<br />
Figure 1 Energy density of selected commonly used foods.<br />
Reprinted from Klein et al. (2002) copyright 2002, with permission<br />
from Elsevier (figure provided courtesy of Liane Roe).<br />
range from a low (for example, raw vegetables and fruits) to a<br />
high (for example, sugary candy) energy density (Drewnowski<br />
et al., 2004). Figure 1 shows the energy density of commonly<br />
used foods, illustrating that a dry high-carbohydrate food<br />
such as pretzels can have similar energy density as high-fat<br />
foods such as cheese (Klein et al., 2002). The carbohydrate<br />
content of diets tend to have a modest inverse association<br />
with the energy density of diets, whereas a higher fat content<br />
is generally associated with a higher energy density of diets<br />
(Stookey, 2001; Drewnowski et al., 2004). However, whether<br />
a diet with a moderately high energy percentage of fat has a<br />
high or low energy density depends to a large extent on the<br />
amount of fruits and vegetables consumed (Ledikwe et al.,<br />
2006). Because of their high water content, beverages<br />
generally have a lower energy density than solid foods.<br />
However, in the interpretation of the energy density of diets<br />
and foods it seems appropriate to consider foods and<br />
beverages separately given indications that energy intake<br />
from beverages is regulated differently (Mattes, 1996; Rolls<br />
et al., 1999).<br />
Short-term studies of energy density. Laboratory studies testing<br />
covertly manipulated foods for a few days or less found that<br />
under these conditions, the weight or volume of foods is the<br />
major determinant of satiation and satiety with persons<br />
consuming a relatively constant weight of food regardless<br />
of energy density (Poppitt and Prentice, 1996; Stubbs and<br />
Whybrow, 2004). Results from intervention studies lasting<br />
up to 2 weeks suggest that the lower satiety and satiation for<br />
fat as compared with carbohydrate intake (per unit of<br />
energy) can be explained by the lower energy density of<br />
carbohydrate (Poppitt and Prentice, 1996). A randomized<br />
cross-over study in six men using covert manipulation of a<br />
mixed diet, tested effects of foods of three levels of energy<br />
density (low, 373 kJ/100 g; medium, 549 kJ/100 g; high,<br />
737 kJ/100 g), with virtually identical macronutrient composition<br />
for 14 days each (Stubbs et al., 1998). Participants<br />
S77<br />
European Journal of Clinical Nutrition
S78<br />
Figure 2 Mean (7standard error) change in body weight during<br />
three 14-day periods in which foods of different energy densities<br />
were provided. Reprinted by permission from Macmillan Publishers<br />
Ltd: International Journal of Obesity, (Stubbs et al., 1998) copyright<br />
1998.<br />
compensated for the energy density of diets (that is,<br />
consuming a lower weight of foods with higher energy<br />
density), but this compensation was incomplete resulting<br />
in statistically significant differences in changes in body<br />
weight: 1.20 kg for low, þ 0.02 kg for medium and<br />
þ 0.95 kg for high energy density (Figure 2). In a cross-over<br />
trial in 13 women, a contrast in the energy density of diets<br />
was obtained by offering participants foods that contained<br />
35–40 energy percent as fat (intervention diet) or 20–25<br />
energy percent as fat (control diet) (Kendall et al., 1991). A<br />
statistically significant 2.5 kg greater weight loss was found<br />
for the low-fat diet in the first cross-over period, but in the<br />
second cross-over period only a non-significant 0.4 kg<br />
difference was found. Furthermore, comparison of energy<br />
intakes for the intervention and control diet indicated that<br />
over time, participants compensated better for the higher<br />
energy density of the intervention diet. These observations<br />
suggest that it is uncertain whether the effect on weight<br />
change can be extrapolated to long-term effects on weight.<br />
Also, compensation would probably have been more complete<br />
if participants would have been able to change the type<br />
in addition to the amount of food eaten, because there is<br />
evidence that people compensate by choosing lower energy<br />
density foods after consumption of higher energy density<br />
foods (Poppitt and Prentice, 1996). In addition, when foods<br />
differ in taste, texture and appearance, instead of being<br />
covertly manipulated, as in many of the short-term trials<br />
(Stubbs et al., 1998), physiological consequences of foods can<br />
be paired to these characteristics, resulting in learning effects<br />
and more complete compensation for energy density (Stubbs<br />
and Whybrow, 2004; Yeomans et al., 2005). On the longerterm,<br />
people appear to acquire a greater degree of sensoryspecific<br />
satiety for foods of a higher energy density based on<br />
their post-ingestive effects (Stubbs and Whybrow, 2004).<br />
Compensation for high energy density through learning<br />
European Journal of Clinical Nutrition<br />
Carbohydrate intake and obesity<br />
RM van Dam and JC Seidell<br />
effects may, however, be less effective in an environment<br />
with a wide availability of novel unfamiliar foods (Stubbs<br />
and Whybrow, 2004) or in combination with large portion<br />
sizes (Ello-Martin et al., 2005). The considerations stated<br />
above and the difference in effects on body weight that tend<br />
to be found for long-term as compared with short-term interventions<br />
in general warrant caution with regard to the extrapolation<br />
of short-term effects of energy density in laboratory<br />
studies to long-term consequences for body weight.<br />
Longer-term studies of energy density and weight change. Few<br />
longer-term studies have directly examined the association<br />
between energy density and body weight. Results from crosssectional<br />
studies of energy density of the diet and adiposity<br />
have been inconsistent (Drewnowski et al., 2004) and<br />
prospective observational data are sparse. The association<br />
between energy density and weight change was examined in<br />
a cohort of middle-aged Danish men and women (Iqbal et al.,<br />
2006). In the overall cohort, energy density at baseline was<br />
not substantially associated with 5-year weight gain. In<br />
women, energy density was positively associated with 5-year<br />
weight gain among the obese and inversely associated with<br />
weight gain in normal-weight women, whereas no significant<br />
interaction with baseline weight was observed among<br />
men. In a 1-year trial, 200 overweight and obese participants<br />
were randomized to receive low-energy density soups or<br />
high-energy density snacks (Rolls et al., 2005). All participants<br />
received instructions from dietitians to follow an<br />
exchange-based energy restricted diet. Weight loss was 8.1 kg<br />
for the control group without provided foods, 7.2 kg for the<br />
two-soup per day group, 6.1 kg for the one-soup per day<br />
group and 4.8 kg for the two-snack per day group. Interpretation<br />
of these results is not straightforward, because the<br />
greatest weight loss was achieved in the control group and<br />
because the smaller weight loss for the snack group may have<br />
related to characteristics other than energy density such as<br />
detrimental effects of snacking in a non-hungry state (Rolls<br />
et al., 2005). Further long-term studies of energy density and<br />
body weight are needed.<br />
Weight loss trials comparing diets of different carbohydrate<br />
contents<br />
Below, studies on the effects of weight-loss diets with<br />
variable proportions of carbohydrate on body weight are<br />
reviewed. This includes studies comparing energy-restricted<br />
diets with low and high carbohydrate contents, very-lowcarbohydrate<br />
diets with low-fat energy-restricted diets, highprotein<br />
and high-carbohydrate diets, low-fat and energyrestricted<br />
diets and low-fat and control diets. Although all<br />
these diets may affect body weight through reductions of<br />
energy intake, ‘energy-restricted’ refers to explicit instructions<br />
to participants about energy restriction.<br />
Energy-restricted diets: high versus low carbohydrate. In trials<br />
with strictly controlled energy intakes, macronutrient
composition of the diet did not substantially affect body<br />
weight or fat mass. Golay et al. (1996) compared the effects of<br />
diets containing 4.2 MJ per day that contained 45% (26% fat)<br />
or 15% (53% fat) of energy as carbohydrates in 43 obese<br />
persons. After a 6-week hospital stay during which all foods<br />
were provided, loss of body weight and fat mass did not<br />
differ between the two diets. However, the important<br />
question remains whether a specific macronutrient composition<br />
of the diet can facilitate reduction of energy intake<br />
under realistic ad libitum conditions. Table 1 shows the<br />
characteristics and results of randomized trials that compared<br />
diets that had the same explicit energy intake target,<br />
but differed in carbohydrate content (Baron et al., 1986;<br />
Pascale et al., 1995; Lean et al., 1997; McManus et al., 2001).<br />
Although dietary advice included a specific target for energy<br />
intake, the long duration of these studies and ‘free living’<br />
conditions precluded strict control of the energy intake of<br />
the participants. Therefore, it is of interest what carbohydrate<br />
composition of the diet best facilitated participants to<br />
adhere to the advice to restrict energy intakes and to lose<br />
weight as a result. In the study by Baron et al. (1986), no<br />
difference in weight loss between the high- and the lowcarbohydrate<br />
diets was observed. However, the limited<br />
3-month duration of the intervention probably reduced the<br />
contrast in dietary composition at 12 months. The authors<br />
reported that weight loss differed much more by weight loss<br />
club than by macronutrient composition of the diet. Pascale<br />
et al. (1995) compared an energy-restricted diet with the<br />
recording of fat intake with an energy-restricted diet with<br />
less emphasis on fat. The low-fat dietary advice resulted in a<br />
greater weight loss in persons with type 2 diabetes, but not in<br />
persons with only a family history of diabetes. Lean et al.<br />
(1997) compared two diets with a 23 energy percent<br />
difference in targets for the carbohydrate content of the<br />
diet. No difference in weight loss between the high- and<br />
low-carbohydrate diet was observed after 6 months. In a<br />
subgroup of postmenopausal women who were followed for<br />
12 months, the low-carbohydrate diet was associated with<br />
greater weight loss than the low-fat diet. The ‘moderate-fat’<br />
diet in the trial by McManus et al. (2001) was not particularly<br />
low in carbohydrates, but was more liberal with regard to<br />
unsaturated fat intake than conventional low-fat diets, and<br />
included nuts, avocados and olive oil. The greater weight loss<br />
and substantially lower drop-out for the ‘moderate-fat’ diet<br />
as compared with the low-fat diet suggest that this more<br />
liberal approach may be beneficial for long-term adherence<br />
to diets aimed at weight loss. In summary, in trials where<br />
participants were explicitly instructed to restrict total energy<br />
intake, advice to consume a low-fat, high-carbohydrate<br />
diet did not consistently lead to more or less weight<br />
loss than advice to consume a lower-carbohydrate diet.<br />
Very low-carbohydrate diet versus low-fat, energy-restricted<br />
diet. Table 2 shows the characteristics and results of five<br />
12-month weight loss trials that randomized participants<br />
to very-low carbohydrate ‘Atkins’ type diets or low-fat diets<br />
Carbohydrate intake and obesity<br />
RM van Dam and JC Seidell<br />
(Foster et al., 2003; Samaha et al., 2003; Stern et al., 2004;<br />
Dansinger et al., 2005; McAuley et al., 2005, 2006; Gardner<br />
et al., 2007). In four of the five studies, a substantially larger<br />
weight loss was found after 6 months of the low-carbohydrate<br />
diet as compared with the low-fat diet (Foster et al.,<br />
2003; Samaha et al., 2003; McAuley et al., 2005; Gardner<br />
et al., 2007). This agrees with findings from two other (6<br />
month) trials (Brehm et al., 2003; Yancy et al., 2004), and<br />
results from a recent meta-analysis that reported a pooled<br />
3.3 kg (95% confidence intervals 1.4, 5.3) greater weight loss<br />
for the low-carbohydrate as compared with the low-fat diet<br />
after 6 months (Nordmann et al., 2006). However, during an<br />
additional 6 months, regain of weight diminished the<br />
differences between the diets, resulting in lack of substantial<br />
differences in weight after 12 months (Table 2). This was also<br />
found in the trial with the most intensive intervention that<br />
continued monthly meetings until the 12-month measurements<br />
(Stern et al., 2004). The ketogenic effect of very-low<br />
carbohydrate diets has been suggested to facilitate weight<br />
loss though urinary excretion of ketones or suppression of<br />
appetite by circulating ketones. However, the amount of<br />
energy lost through urinary excretion of ketones is minimal<br />
(Astrup et al., 2004). Furthermore, Foster et al. (2003) did not<br />
observe an association between urinary ketones and weight<br />
loss. The simplicity of the diet, the restriction of the variety<br />
of food choices and possibly a greater satiating effect of<br />
protein seem more plausible explanations for the greater<br />
initial weight loss on very-low carbohydrate diets (Astrup<br />
et al., 2004). In summary, in overweight individuals in the<br />
US and New Zealand, instructions to consume a very-low<br />
carbohydrate diet generally led to greater weight loss during<br />
the first 6 months than instructions to consume low-fat<br />
diets, but due to subsequent regain of weight this may not<br />
result in a greater long-term weight loss.<br />
High carbohydrate versus high protein. Effects of increasing<br />
the proportion of carbohydrates in the diet may depend on<br />
the macronutrient that is replaced: protein or fat. The verylow-carbohydrate<br />
diets discussed in the previous section also<br />
had a higher protein content than the low-fat diets: a 3–7<br />
energy percent higher protein intake was reported at 6<br />
months (Brehm et al., 2003; Samaha et al., 2003; Yancy et al.,<br />
2004; McAuley et al., 2005). Other trials however, have more<br />
specifically attempted to replace carbohydrates with protein.<br />
A Danish group compared the effects of two ad libitum<br />
reduced-fat (30 energy percent) diets: a diet high in<br />
carbohydrates and a diet high in protein (Skov et al., 1999).<br />
During the first 6 months, foods were supplied through a<br />
laboratory shop system, followed by 6 months of consultation<br />
with a dietitian once every 2 weeks. The energy<br />
percentage of protein in the high-protein diet (24.3%<br />
registered in the shop at 6 months; 21.2% reported at 12<br />
months) was substantially higher (12.5% at 6 months, 7.3%<br />
at 12 months) than in the high-carbohydrate diet. Furthermore,<br />
regular measurement of 24-h urinary nitrogen excretion<br />
agreed with these differences in protein intake. After 6<br />
S79<br />
European Journal of Clinical Nutrition
European Journal of Clinical Nutrition<br />
Table 1 Long-term randomized intervention studies of hypocaloric diets: high carbohydrate (low fat) versus lower carbohydrate<br />
Reference/country Participants a<br />
(Baron et al.,<br />
1986) UK<br />
(Pascale et al.,<br />
1995) US<br />
(Lean et al., 1997)<br />
UK<br />
(McManus et al.,<br />
2001) US<br />
M/F. High carb: n ¼ 61,<br />
age 40, BMI 28.5; low<br />
carb: n ¼ 59, age 40, BMI<br />
39.5. An additional n ¼ 8<br />
(high carb) and n ¼ 7<br />
(low carb) were lost to<br />
follow-up and not<br />
included in the analysis<br />
M/F Type 2 diabetes, age<br />
5778, BMI 36.374.7.<br />
Low fat: n ¼ 15; higher<br />
fat: n ¼ 16. An additional<br />
n ¼ 7 (low fat) and n ¼ 6<br />
(higher fat) were lost to<br />
follow-up and not<br />
included in the analysis<br />
M/F family history of<br />
diabetes, age 4378, BMI<br />
35.974.7. Low fat:<br />
n ¼ 16; higher fat: n ¼ 13.<br />
An additional n ¼ 7 (Low<br />
fat) and n ¼ 10 (higher<br />
fat) were lost to followup<br />
and not included in<br />
the analysis<br />
F. High carb: n ¼ 42, age<br />
51714, BMI 32.375.5.<br />
Low carb: n ¼ 40, age<br />
50.1714, BMI<br />
32.875.1. An additional<br />
n ¼ 15 (high carb) and<br />
n ¼ 13 (low carb) lost to<br />
follow-up at 6 months<br />
not included in the<br />
analysis<br />
M/F. Low fat: n ¼ 30, age<br />
44710, BMI 3373.<br />
Moderate fat: n ¼ 31, age<br />
44710, BMI 3475. In<br />
addition n ¼ 21 (high<br />
carb) and n ¼ 19 (low<br />
carb) lost to follow-up at<br />
18 months and included<br />
in ‘last value carried<br />
forward’ intention to<br />
treat analysis<br />
Duration Intervention ‘High carbohydrate’ ‘Low carbohydrate’ Compliance Results<br />
12 months 3 months: participation<br />
in weekly diet club<br />
meetings and written<br />
material. Target:<br />
1000–1200 kcal<br />
per day<br />
12 months 16 weekly group sessions<br />
and meetings at 5, 6, 8<br />
and 10 months. Target:<br />
1000–1500 kcal per day<br />
(depending on baseline<br />
weight)<br />
6 months;<br />
12 months<br />
follow-up<br />
for n ¼ 46<br />
6 months: counseling<br />
by dietitian and written<br />
material. Target:<br />
1200 kcal per day<br />
18 months Weekly group sessions<br />
with dietitian for whole<br />
period. Target: 1200 (F)<br />
or 1500 kcal per day (M)<br />
Fat o30 g per day Carbohydrate o50 g<br />
per day<br />
Target: 20 en% fat.<br />
Recording of both<br />
amount of calories<br />
and fat of foods used<br />
Target: 58 en% carb,<br />
21 en% fat, 21 en%<br />
protein<br />
Target: 60–65 en%<br />
carb, 20 en% fat,<br />
15–20 en% protein<br />
Emphasis on low energy<br />
intake. Recording of<br />
calories of foods used.<br />
Fat o30 en%<br />
encouraged<br />
Target: 35 en% carb, 35<br />
en% fat, 30 en% protein<br />
Target: 45–50 en%<br />
carb, 35 en% fat,<br />
15–20 en% protein.<br />
‘Moderate fat’<br />
Abbreviations: BMI, body mass index (kg/m 2 ); en%, energy percent; F, female; FFQ, food frequency questionnaire; M, male; s.d., standard deviation.<br />
All trials had a parallel design.<br />
None of the trials reported/conducted blinding of the assessors of outcomes or allocation concealment.<br />
a Values are means7s.d.<br />
FFQ: higher fiber intake<br />
(18.4 vs 15.1 g per day),<br />
bread and potato intake<br />
for high-carb vs<br />
low-carb diet<br />
Diet records (12<br />
months): low-fat 26<br />
en% fat, higher fat 34<br />
en% fat<br />
Diet records (12<br />
months): low-fat 26<br />
en% fat, higher fat 34<br />
en% fat<br />
High carb: 1.6 kg<br />
Low carb: 2.3 kg<br />
Difference: 0.7 kg<br />
(95% CI 1.2, 2.6)<br />
Low fat: 5.2 kg<br />
(s.d. 7.3)<br />
Higher fat: 1.0 kg<br />
(s.d. 3.9)<br />
(P ¼ 0.06)<br />
Low fat: 3.1 kg<br />
(s.d. 8.9)<br />
Higher fat: 3.2 kg<br />
(s.d. 7.2)<br />
Not assessed 6 months: High carb:<br />
4.2 kg.<br />
Low carb: 5.4 kg<br />
(P ¼ 0.22). 12 months<br />
(subgroup):<br />
High carb: 3.0 kg Low<br />
carb: 6.5 kg (Po0.05)<br />
Attendance of sessions Low fat: þ 1.1 kg<br />
(20% for low-fat vs 54% Moderate-fat:<br />
for moderate fat, 2.5 kg (P ¼ 0.005)<br />
Po0.01). FFQ at 18<br />
months: low-fat 50 en%<br />
carb, 35% fat; moderatefat<br />
47% carb and 35% fat<br />
S80<br />
Carbohydrate intake and obesity<br />
RM van Dam and JC Seidell
European Journal of Clinical Nutrition<br />
Table 2 Randomized intervention studies comparing very low carbohydrate diet and low-fat energy-restricted diets: results after 6 and 12 months<br />
Reference/<br />
country<br />
(Samaha<br />
et al., 2003;<br />
Stern et al.,<br />
2004) US<br />
(Foster<br />
et al.,<br />
2003) US<br />
(Dansinger<br />
et al., 2005)<br />
US<br />
(McAuley<br />
et al., 2005,<br />
2006)<br />
New<br />
Zealand<br />
Participants Intervention ‘Low-carb’ diet ‘Low-fat’ diet Follow-up Compliance Weight loss (kg)<br />
M/F. BMI X35,<br />
83% diabetes or<br />
metabolic<br />
syndrome. Low<br />
carb: n ¼ 64. Lowfat:<br />
n ¼ 68; lost to<br />
follow-up: n ¼ 14 at<br />
6 months, n ¼ 6at<br />
12 months<br />
M/F. Obese (mean<br />
BMI 34). Low carb:<br />
n ¼ 33. Low-fat:<br />
n ¼ 30; lost to<br />
follow-up: n ¼ 21 at<br />
6 months, n ¼ 26 at<br />
12 months<br />
M/F. BMI 27–42<br />
(mean 35) with<br />
metabolic risk<br />
factors. Low carb:<br />
n ¼ 40. Low-fat:<br />
n ¼ 40; lost to<br />
follow-up: n ¼ 19<br />
for low carb and<br />
n ¼ 20 for low-fat<br />
F. Insulin resistant,<br />
BMI427. Low carb:<br />
n ¼ 31. Low-fat:<br />
n ¼ 32; lost to<br />
follow-up: n ¼ 6at<br />
6 months, n ¼ 7at<br />
12 months<br />
Group counseling:<br />
weekly sessions for<br />
4 weeks and 11<br />
monthly session;<br />
written materials<br />
One consultation<br />
with dietitian; a<br />
book/manual<br />
Advice during four<br />
group sessions in<br />
first 2 months;<br />
written materials<br />
and diet book<br />
Weekly counseling<br />
for 16 weeks;<br />
written materials<br />
Carbohydrate<br />
intake o30 g per<br />
day<br />
Carbohydrate<br />
o20 g per day<br />
for 2 weeks,<br />
followed by a<br />
gradual increase<br />
Carbohydrate<br />
o20 g per day with<br />
gradual increase to<br />
50 g per day<br />
Carbohydrate<br />
o20 g per day<br />
for 2 weeks with<br />
gradual increase<br />
Fat o30 energy%<br />
and 500 kcal per<br />
day energy deficit<br />
Fat B25%,<br />
protein B15%,<br />
carbohydrate<br />
B60% of energy.<br />
Energy restricted<br />
Vegetarian ‘Ornish’<br />
diet with 10<br />
energy% fat<br />
Conventional<br />
high-fiber, low-fat,<br />
reduced sugar<br />
diet. No explicit<br />
energy-restriction<br />
6 months 24-h recall (energy<br />
%). Low carb: C 37,<br />
F 41, P 22 w .<br />
Low-fat: C 51,<br />
F 33, P 16<br />
12 months 24-h recall<br />
(g per day).<br />
Carbohydrate: low<br />
carb 120; low-fat<br />
230<br />
Low carb a<br />
Low fat a<br />
Difference<br />
5.8 (8.6) 1.9 (4.2) P ¼ 0.002 b<br />
5.1 (8.7) 3.1 (8.4) P ¼ 0.20 c<br />
6 months Testing of urinary<br />
ketone<br />
concentrations.<br />
Significant<br />
difference between<br />
groups up to 12<br />
weeks<br />
6.9 (6.4) 3.1 (5.5) P ¼ 0.02 d<br />
12 months 4.3 (6.6) 2.5 (6.2) P ¼ 0.26 d<br />
6 months Diet records<br />
(g per day):<br />
low carb: C 190 g,<br />
F 81 g; low-fat: C<br />
237 g, F 55 g<br />
3.2 (4.9) 3.6 (6.7) P ¼ 0.76 d<br />
12 months Diet records (g/d):<br />
low carb: C 190 g,<br />
F 81 g; low-fat: C<br />
218 g, F 64 g<br />
6 months Diet records<br />
(energy %): low<br />
carb: C 26, F 47,<br />
P 24; low fat: C 45,<br />
F 28, P 21<br />
12 months Diet records<br />
(energy %): low<br />
carb: C 33, F 41,<br />
P 21; Low fat: C 45,<br />
F 29, P 22<br />
2.1 (4.8) 3.3 (7.3) P ¼ 0.40 d<br />
7.1 4.7 Po0.05 c<br />
5.4 4.4 P40.05 c<br />
S81<br />
Carbohydrate intake and obesity<br />
RM van Dam and JC Seidell
S82<br />
Table 2 Continued<br />
Participants Intervention ‘Low-carb’ diet ‘Low-fat’ diet Follow-up Compliance Weight loss (kg)<br />
Reference/<br />
country<br />
Difference<br />
Low fat a<br />
Low carb a<br />
B 5.8 B 3.1 Po0.05 d<br />
6 months 24-h recalls (energy<br />
%): low carb: C 30,<br />
F 47, P 22; Low fat:<br />
C 48, F 31, P 18<br />
‘LEARN’ program:<br />
55–60%<br />
carbohydrate and<br />
o10 energy%<br />
saturated fat,<br />
caloric restriction,<br />
exercise<br />
Carbohydrate<br />
p20 g per day for<br />
B2–3 months<br />
followed by p50 g<br />
per day<br />
Weekly counseling<br />
for 2 months; diet<br />
books<br />
F. Premenopausal<br />
(25–50 years),<br />
BMI 27–40.<br />
Low carb: n ¼ 77.<br />
Low fat n ¼ 79;<br />
lost to follow-up:<br />
n ¼ 21 at 6<br />
months, n ¼ 27<br />
at 12 months<br />
(Gardner<br />
et al., 2007)<br />
US<br />
European Journal of Clinical Nutrition<br />
4.7 ( 6.3, 3.1) 2.2 ( 3.6, 0.8) P40.05 d<br />
Carbohydrate intake and obesity<br />
RM van Dam and JC Seidell<br />
12 months 24-h recalls (energy<br />
%): low carb: C 35,<br />
F 44, P 21; low-fat:<br />
C 47, F 33, P 19<br />
Abbreviations: BMI, body mass index (kg m 2 ); C, carbohydrates; F, fat; F, female; M, male; P, protein.<br />
All trials had a parallel design, allocation concealment was performed for all studies, and blinding of outcome assessors was not reported.<br />
a<br />
Values are means (s.d. or 95% CI).<br />
b<br />
Intention to treat: last value carried forward.<br />
c<br />
Random coefficient analysis.<br />
d<br />
Intention to treat: baseline value carried forward.<br />
months, weight loss was 9.4 kg in the high-protein group<br />
and 5.9 kg in the high-carbohydrate group (difference 3.5 kg,<br />
P ¼ 0.008; Skov et al., 1999). After 12 months, weight loss was<br />
6.2 kg for the high-protein group and 4.3 kg for the highcarbohydrate<br />
group (difference 1.9 kg, P40.05; Due et al.,<br />
2004). Thus, despite a remaining substantial difference in<br />
protein intake, some weight was regained and it was unclear<br />
whether a greater long-term weight loss could be maintained<br />
for the high-protein protein group. The reduction in waist<br />
circumference remained statistically significantly greater<br />
after 12 months for the high-protein as compared with the<br />
high-carbohydrate group (Due et al., 2004). An Australian<br />
intervention study also compared effects of a high-protein<br />
with a high-carbohydrate diet (McAuley et al., 2005). At 6<br />
months, the higher protein diet was associated with a 5<br />
energy percent higher protein intake (26 versus 21%) and a<br />
statistically significant 2.2 kg greater weight loss (6.9 versus<br />
4.7 kg). Regain of weight in the subsequent 6 months was<br />
0.5 kg for the high-carbohydrate and 0.9 kg for the highprotein<br />
group (McAuley et al., 2006). After 12 months, the<br />
energy percent of protein was identical for the two groups,<br />
whereas a non-statistically significant 2.3 kg lower body<br />
weight remained for the high-protein as compared with the<br />
high-carbohydrate group. In two intervention studies by<br />
Brinkworth and co-workers, a high-protein diet and a highcarbohydrate<br />
diet resulted in similar weight loss after 68<br />
weeks, but the intervention only lasted for 16 weeks and the<br />
urinary urea/creatinine ratio indicated no difference in<br />
protein content after the intervention (Brinkworth et al.,<br />
2004a, b). In summary, two trials suggest that exchanging<br />
protein for carbohydrates can facilitate weight loss over 6<br />
months, but more research is needed to clarify whether this<br />
beneficial effect can be maintained after 12 or more months.<br />
Low-fat (high carbohydrate) versus energy-restricted diet. Several<br />
long-term intervention studies compared dietary advice<br />
focused on reducing fat intake with dietary advice focused<br />
on restriction of total energy intake. These trials reported<br />
worse (Harvey-Berino, 1998), similar (Jeffery et al., 1995;<br />
Dansinger et al., 2005) and better (Toubro and Astrup, 1997)<br />
effects on body weight for the low-fat approach, as compared<br />
with the energy-restricted approach. These differences in the<br />
results probably reflect differences in the energy-restricted<br />
program (for example, a complicated color-coded system<br />
(Toubro and Astrup, 1997) versus a simpler method of calorie<br />
counting (Dansinger et al., 2005)) rather than effects of<br />
differences in macronutrient composition of the diet.<br />
Intervention studies of carbohydrate intake not primarily aimed at<br />
weight loss<br />
Effect of dietary advice to consume a low-fat diet on body<br />
weight. The Women’s Health Initiative Dietary Modification<br />
Trial tested the effect of advice to decrease fat intake and<br />
increase consumption of fruit, vegetables and grains on<br />
body weight for a mean follow-up of 7.5 years in 48 835
postmenopausal US women (Howard et al., 2006). The<br />
intervention included 18 group sessions during the first 12<br />
months, followed by four group sessions per year for the<br />
duration of the trial supplemented with individual sessions.<br />
The control group only received dietary educational materials.<br />
According to self-reported data from a food frequency<br />
questionnaire, the percentage of energy from fat decreased<br />
by 8.8%, the percentage of energy from carbohydrates<br />
increased by 8.2%, the number of servings of fruits and<br />
vegetables increased by 1.4 servings per day and fiber intake<br />
increased by 2.2 g per day in the intervention group, whereas<br />
no substantial changes were reported by the control group.<br />
Body weight decreased 1.9 kg after 1 year and 0.4 kg after an<br />
average of 7.5 years for the intervention as compared with<br />
the control group (both P-value 0.001). Trends in body<br />
weight for the intervention and control group were similar:<br />
an increase in women who were not overweight, little<br />
change in those who were moderately overweight and a<br />
decrease in those who were obese before the study (Figure 3).<br />
Weight loss was not an aim of this study and data on dietary<br />
change only relied on self-reports. However, the findings do<br />
not support a substantial long-term effect of an educational<br />
intervention aimed at reducing the proportion of fat (or<br />
increasing the proportion of carbohydrates) in the diet on<br />
body weight in US women. Even the small effect on body<br />
weight may reflect changes other than fat intake as a result of<br />
the more intensive dietary advice in the intervention as<br />
compared with the control group.<br />
Carbohydrate intake and obesity<br />
RM van Dam and JC Seidell<br />
The results of earlier smaller randomized interventions of<br />
at least 12 months duration that tested advice to consume<br />
low-fat diets and were not aimed at weight loss showed a<br />
similar lack of substantial effects on body weight (Willett,<br />
2002). A meta-analysis of intervention studies suggested a<br />
more substantial 3.2 kg greater weight loss as a result of an ad<br />
libitum low-fat diet as compared with the control group.<br />
(Astrup et al., 2004) However, interpretation of the results is<br />
limited by the inclusion of shorter term (duration was 2–12<br />
months) and non-randomized studies. Moreover, in most<br />
studies, only the low-fat intervention group received intensive<br />
dietary advice, making it unclear whether effects<br />
were due to changes in fat intake per se or other behavioral<br />
changes related to the greater awareness of diet. In summary,<br />
randomized intervention studies do not consistently show<br />
that educational efforts aimed at reducing the percentage of<br />
energy intake from fat (or increase the percentage of energy<br />
from carbohydrates) without additional efforts to reduce<br />
energy intakes have important long-term effects on body<br />
weight.<br />
Effect of provision of reduced fat foods on body weight. In the<br />
double-blinded multicenter ‘First Study’ of National Diet-<br />
Heart Study, foods of variable fat contents were provided to<br />
approximately 1000 middle-aged US men (Anonymous,<br />
1968). The participants were provided low-fat foods resulting<br />
in 29.7% of energy from fat (based on diet records), high-fat/<br />
high-polyunsaturated fat foods resulting in 34.4% of energy<br />
Figure 3 Effects of advice to consume a low-fat diet high in fruits and vegetables on body weight: differences (from baseline) in body weight by<br />
intervention group and BMI at screening in the Women’s Health Initiative. Error bars indicate 95% confidence intervals. *Pp0.05 and 40.01<br />
w Pp0.01 and 40.001 z Pp0.001 for the difference between the intervention and control group. Reprinted from Howard et al. (2006) copyright<br />
(2006), American Medical Association. All rights reserved. BMI, body mass index.<br />
S83<br />
European Journal of Clinical Nutrition
S84<br />
from fat or high-fat/low-polyunsaturated fat foods resulting<br />
in 34.9% of energy from fat. Over 44 weeks, men in all<br />
groups lost weight (2.3, 1.4 and 1.8 kg respectively), with a<br />
0.5–0.9 kg greater weight loss for the low-fat group. In a<br />
randomized trial of 241 Dutch non-obese individuals with<br />
no intention to lose weight, free access was provided to B45<br />
different foods either in reduced fat or full fat version,<br />
covering between 30 and 40% of energy intake. The group<br />
that consumed the reduced-fat products had on average a 7<br />
energy percent lower fat intake and a 0.7 kg (95% confidence<br />
interval 0.1, 1.4) decrease in body fat over 6 months as<br />
compared with those that consumed the full-fat products<br />
(Westerterp et al., 1996; Weststrate et al., 1998). In the<br />
randomized CARMEN trial (Carbohydrate Ratio Management<br />
in European National Diets), diets high in carbohydrates<br />
were compared with a control diet that had a<br />
macronutrient composition that was typical for each<br />
country (Saris et al., 2000). The intervention was ad libitum<br />
and consisted of providing foods through a laboratory shop<br />
system in 398 men and women with a BMI between 26 and<br />
35 kg/m 2 . Allocation concealment and blinding procedures<br />
were not described and no intention-to-treat analysis was<br />
conducted. According to diet records intake of fat, protein,<br />
and carbohydrates changed significantly by 8.7, þ 2.7 and<br />
þ 6.3 energy percent for the low-fat high-starch group<br />
relative to the control group. Weight loss over 6 months<br />
was 2.6 kg for the low-fat high-starch group as compared<br />
with the control group. This weight loss was substantially<br />
larger than for the National Diet-Heart-Study, possibly due to<br />
the greater contrast in fat intake, the higher protein intake<br />
for the high-starch diet relative to the control diet or to all<br />
the CARMEN participants being overweight. Furthermore, in<br />
the CARMEN study participants were not blinded and the<br />
high-starch diet required a substantial change and reconsideration<br />
of dietary habits, whereas the control diet was<br />
similar to the usual dietary intake.<br />
In all trials discussed above, full-fat foods were replaced by<br />
reduced-fat versions of the foods. One could argue that the<br />
observed small effects of this product change on body<br />
weight may be worthwhile on a population level. However,<br />
exchange of reduced-fat foods for full-fat versions may<br />
reflect the effect of reducing the amount of energy per<br />
portion without substantially changing the participants’<br />
perception of the satiety value of the food. Thus, findings<br />
do not necessarily apply to exchanging carbohydrates for fat<br />
and replacement of full-calorie carbohydrate foods with<br />
reduced-calorie versions may have similar effects.<br />
Observational studies of carbohydrate intake and body weight<br />
Cohort studies of fat intake and long-term weight change. As<br />
reported in section 1.2, observational studies of dietary<br />
intakes and body weight are prone to various biases. People<br />
tend to hold particularly strong ideas about the effects of the<br />
proportion of fat or carbohydrate on body weight favoring<br />
for example commonly recommended low-fat diets or<br />
European Journal of Clinical Nutrition<br />
Carbohydrate intake and obesity<br />
RM van Dam and JC Seidell<br />
popular low-carbohydrate diets. A person’s ability to adhere<br />
to the macronutrient composition of such a diet is likely to<br />
be associated with a person’s ability to control total energy<br />
intake. Therefore, an association between the proportion of<br />
carbohydrates in the diet with lower weight or less weight<br />
gain may well be confounded by the ability to control energy<br />
intake. Other methodological issues include selective underreporting<br />
of fat intake that is related to weight and residual<br />
confounding by other dietary factors (Seidell, 1998). Results<br />
from prospective cohort studies that study the proportion of<br />
energy from fat in the diet (and thus indirectly the<br />
proportion of energy from carbohydrate in the content)<br />
have been inconsistent (Seidell, 1998). In addition to the<br />
aforementioned methodological limitations, differences in<br />
results may relate to differences in genetic susceptibility. In<br />
two cross-sectional studies, the association between fat<br />
intakes and adiposity differed by peroxisome proliferatoractivated<br />
receptor-a Pro12Ala genotype (Memisoglu et al.,<br />
2003; Franks et al., 2004). This variant also modified the<br />
weight loss as result of a lifestyle intervention (Lindi et al.,<br />
2002), but not the response to an energy restricted high or<br />
low-fat diet (Sorensen et al., 2006).<br />
Weight control registry. The National Weight Control Registry<br />
is a registry of persons in the US that maintained a weight<br />
loss of 13.6 kg or more for at least 1 year (Phelan et al., 2006).<br />
The majority of these successful weight losers consumed a<br />
low-fat, high-carbohydrate diet, but the average percentage<br />
of energy from carbohydrates had decreased from 56% in<br />
1995 to 49% in 2003, and the proportion of persons on a<br />
low-carbohydrate diet (o90 g/d carbohydrate) increased<br />
from 5.9 to 17.1% during that period (Phelan et al., 2006).<br />
These results indicate that the diet associated with weight<br />
loss at a certain point in time is to some degree dependent on<br />
the types of diet that are generally believed to be beneficial<br />
for weight. Still, these registry data support the findings from<br />
intervention studies that substantial weight loss is possible<br />
over a wide range of macronutrient compositions of the diet.<br />
Conclusions on the carbohydrate content of the diet<br />
Findings from the dietary intervention studies discussed<br />
above suggest that similar weight loss can be achieved over<br />
the course of a year with diets of substantially different<br />
carbohydrate contents. Positive energy balance and weight<br />
gain can be achieved with a wide range of energy percentage<br />
of carbohydrates in the diet; thus, neither a diet with a high<br />
nor a low energy percentage of carbohydrates will necessarily<br />
protect a person from weight gain on the long term.<br />
In trials in which dietary advice for weight loss was<br />
provided in overweight persons in the US and New Zealand,<br />
weight loss was greater after 6 months for low-carbohydrate<br />
diets as compared with low-fat diets, although this difference<br />
greatly attenuated after longer follow-up (Nordmann et al.,<br />
2006; Gardner et al., 2007). Interestingly, in the European<br />
CARMEN trial in which macronutrient intake was manipulated<br />
by providing foods through a laboratory shop system,
weight loss was greater after 6 months with a low-fat highcarbohydrate<br />
diet as compared with a higher fat control diet<br />
(Saris et al., 2000). There are several possible explanations for<br />
this difference in results. First, in the trials with dietary<br />
advice, protein intake was substantially higher for the lowcarbohydrate<br />
relative to the low-fat diet, whereas the<br />
opposite was true for the CARMEN trial. The promising<br />
hypothesis that a higher protein content of the diet may<br />
contribute to weight management requires further research.<br />
Second, the nature of the foods included in the low-fat diet<br />
may have differed: in the CARMEN trial the low-fat diet<br />
included many reduced-calorie versions of otherwise similar<br />
full-fat foods, whereas diverse self-chosen high-carbohydrate<br />
foods may have been included in the low-fat diets in the<br />
trials with dietary advice. Third, the characteristics of the<br />
interventions unrelated to physiological effects of macronutrient<br />
composition may have played an important role. In<br />
the trials with dietary advice, the low-carbohydrate diet was<br />
probably the most novel, simple and restrictive diet, whereas<br />
in the CARMEN trial the lower carbohydrate diet was a<br />
control diet that required little change in food choice.<br />
Long-term dietary and lifestyle interventions (X2 years)<br />
show that consumption of a relatively high-carbohydrate<br />
diet (B55% of energy) that includes high amounts of fiberrich<br />
foods can be compatible with clinically relevant weight<br />
loss (Tuomilehto et al., 2001; Knowler et al., 2002; Esposito<br />
et al., 2004; Mayer-Davis et al., 2004). A Mediterranean-style<br />
moderate-fat diet with a lower carbohydrate content (B50% of<br />
energy) was also associated with substantial weight loss after<br />
18 months (McManus et al., 2001). Taken together, the<br />
available data do not provide strong evidence that either<br />
increasing or decreasing the energy percentage of carbohydrate<br />
in the diet by itself has an important effect on body weight.<br />
Free sugars<br />
Introduction<br />
Free sugars are defined as added sugars plus concentrated<br />
sugars in honey, syrups and fruit juices. Because glucose chains<br />
in starches can be rapidly broken down in the gastrointestinal<br />
tract, many starchy foods induce a more rapid increase of<br />
blood glucose concentrations than many foods high in free<br />
sugars (Foster-Powell et al., 2002). However, other characteristics<br />
of free sugars can be relevant for energy balance. Foods<br />
high in free sugars have been proposed to contribute to weight<br />
gain as compared with starchy foods because of lack of dietary<br />
fiber and high energy density (Poppitt and Prentice, 1996),<br />
higher palatability because they are sweeter (Raben et al.,<br />
1997), unique effects of fructose (Elliott et al., 2002) and<br />
because these are often consumed in the form of high-caloric<br />
liquids instead of solid foods (Mattes, 1996).<br />
Micronutrient dilution<br />
‘Micronutrient dilution’ refers to a reduction of the micronutrient<br />
content of the diet as a result of the displacement of<br />
Carbohydrate intake and obesity<br />
RM van Dam and JC Seidell<br />
micronutrient-rich foods by foods high in free sugars. Studies<br />
in children, adolescents and adults have reported that a high<br />
energy percentage of the diet as free sugars is associated with<br />
lower intakes of various micronutrients (Alexy et al., 2003;<br />
Charlton et al., 2005; Kranz et al., 2005). In addition, a high<br />
free-sugar content of the diet has been associated with lower<br />
intakes of fiber (Kranz et al., 2005) and fruit and vegetables<br />
(Charlton et al., 2005). Regular consumption of foods high in<br />
free sugars does not have to be associated with micronutrient<br />
deficiencies (Ruxton, 2003). However, given that the energy<br />
intake that is compatible with avoiding weight gain in<br />
modern societies with little occupational physical activity is<br />
limited, it should be considered that a high intake of energy<br />
as free sugars will generally make it more difficult to achieve<br />
optimal intakes of micronutrients, phytochemicals, fiber and<br />
fruit and vegetables.<br />
Postprandial insulin secretion and body weight<br />
The effect of postprandial insulin secretion on energy<br />
balance is controversial. On the one hand, it has been<br />
postulated that a high postprandial insulin response may<br />
lead to weight gain through various mechanisms. First, a<br />
high postprandial insulin response may rapidly lower blood<br />
glucose and free fatty acid concentrations, which might in<br />
turn induce the secretion of counter-regulatory hormones.<br />
These hormones may stimulate hunger and energy intake<br />
and may also lower resting energy expenditure through a<br />
proteolytic effect that reduces lean body mass over time<br />
(Ludwig, 2002; McMillan-Price and Brand-Miller, 2006).<br />
Second, it has been suggested that high postprandial insulin<br />
responses may reduce fat oxidation and increase fat synthesis<br />
and storage (McMillan-Price and Brand-Miller, 2006). However,<br />
hyperinsulinemia has been associated with reduced<br />
weight gain in several longitudinal studies (Valdez et al.,<br />
1994; Hoag et al., 1995; Schwartz et al., 1995), and the<br />
quantitative significance of the effect of higher insulin levels<br />
on de novo fatty acid synthesis in adipose tissue in humans<br />
has been questioned (Wolever, 2006).<br />
On the other hand, it has been postulated that low<br />
postprandial insulin responses may lead to reduced satiety<br />
(Elliott et al., 2002). Lack of insulin response can lead to<br />
reduced leptin production by adipose tissue and both leptin<br />
and insulin can play a role in inducing satiety (de Graaf et al.,<br />
2004; Schwartz and Porte, 2005); however, in short-term<br />
experiments, the effect of insulin infusion on appetite and<br />
food intake has not been consistent (Wolever, 2006). Taken<br />
together, it has not been established whether variation in<br />
postprandial insulin responses has substantial effects on<br />
body weight regulation in humans.<br />
Fructose intake, satiety and body weight<br />
In contrast to glucose, fructose ingestion elicits little<br />
response in blood glucose and insulin concentrations. It<br />
has been suggested that high intake of fructose intake may<br />
S85<br />
European Journal of Clinical Nutrition
S86<br />
lead to excess energy intake because of this lack of insulin<br />
response as well as failure to suppress secretion of the<br />
‘hunger hormone’ ghrelin (Elliott et al., 2002; Teff et al.,<br />
2004). The effect of fructose intake on body weight has not<br />
been examined in randomized trials. A diet supplemented<br />
with 50–60 g fructose resulted in weight gain in 14 persons<br />
with type 2 diabetes during 23 weeks, but this study did not<br />
include a control group (Anderson et al., 1989).<br />
Studies of mostly solid sugary foods<br />
A cross-over study in 20 non-overweight women (mean BMI<br />
23 kg/m 2 ) in which all foods were provided compared 14<br />
days of ad libitum consumption of a high-starch/high-fiber<br />
diet with a high-sucrose diet (Raben et al., 1997). The highstarch/high-fiber<br />
diet resulted in a 0.7 kg reduction in body<br />
weight, whereas the sucrose diet resulted in a non-significant<br />
0.2 kg increase in weight (Po0.05 for difference between<br />
diets). Possibly, this difference in weight change is related to<br />
the participants’ higher palatability ratings for the highsucrose<br />
diet or to the sugar-sweetened beverages in the highsucrose<br />
diet. In the 6-month randomized CARMEN trial, a<br />
diet higher in mono-and disaccharides was compared with a<br />
diet higher in starch in men and women with BMI 26–35<br />
kg/m 2 (Saris et al., 2000). The intervention was ad libitum and<br />
consisted of providing foods through a laboratory shop<br />
system. The diet high in mono-/disaccharides was associated<br />
with a non-significant 0.9 kg smaller weight loss than the<br />
high-starch diet. The same intervention in persons with the<br />
metabolic syndrome resulted in a 4 kg greater reduction in<br />
weight for the high-starch as compared with the high monoand<br />
disaccharide diet (Poppitt et al., 2002). These two diets<br />
did not only differ in the solid foods consumed, but also in<br />
the types of beverages used: beverages high in free sugars in<br />
the high-mono-and disaccharide diet versus artificially<br />
sweetened beverages in the high-starch diet (Poppitt et al.,<br />
2002). Middle-aged male office workers who were asked to<br />
cut out sucrose from their diet and replace it with other<br />
foods, reduced their sucrose intake from 85 to 12 g per day<br />
according to diet records and were reported to have lost<br />
weight after 22 weeks (Mann et al., 1970). Similar interventions<br />
showed a non-significant tendency for greater weight<br />
loss as compared with the control group in hypertriglyceridemic<br />
individuals (Smith et al., 1996), whereas no difference<br />
in weight loss was found in non-obese women (Gatenby<br />
et al., 1997).<br />
Sugar-sweetened beverages and body weight<br />
Intervention studies of sugar-sweetened beverages. Several trials<br />
have specifically examined the effects of sweetened beverages<br />
on body weight (Table 3). Energy consumed as<br />
liquids may induce less satiety as compared with the same<br />
foods in a solid form because of the rapid transit of liquids<br />
through the stomach and intestines that may lead to reduced<br />
stimulation of satiety signals, differences in the regulation of<br />
European Journal of Clinical Nutrition<br />
Carbohydrate intake and obesity<br />
RM van Dam and JC Seidell<br />
thirst and hunger, and lower cognitively perceived energy<br />
content (Mattes, 1996; DiMeglio and Mattes, 2000). Reported<br />
energy intake in intervention studies of sugarsweetened<br />
beverages suggested a lack of compensation for<br />
the energy provided through these liquids by reduced<br />
subsequent energy intake (Tordoff and Alleva, 1990; DiMeglio<br />
and Mattes, 2000). Trials of sugar-sweetened beverage<br />
consumption and body weight varied from blinded interventions<br />
of several weeks (Tordoff and Alleva, 1990; Raben<br />
et al., 2002) to an education program on carbonated<br />
beverages of 1 year (James et al., 2004; Table 3). Findings in<br />
all trials were consistent with a detrimental effect of<br />
consumption of sugar-sweetened beverages on body weight.<br />
Both trials in which participants were blinded with regard to<br />
both the aim of the study and the sweeteners in the<br />
beverages they received found a statistically significant effect<br />
the sugar-sweetened intervention on body weight (Tordoff<br />
and Alleva, 1990; Raben et al., 2002). Figure 4 shows the<br />
results of one of these blinded trials conducted by Raben<br />
et al. (2002). A 1-year dietary educational program at schools<br />
mainly aimed at reducing use of carbonated beverages was<br />
associated with a reduced incidence of overweight (James<br />
et al., 2004). However, given the very limited effect on sugarsweetened<br />
soft drink consumption, it is uncertain whether<br />
the effect of the program on obesity are due to reduced<br />
consumption of these beverages, to the apparently greater<br />
reduction in consumption of artificially sweetened soft<br />
drinks or to other behavioral changes. In a 25-week<br />
intervention that mainly consisted of the free delivery of<br />
non-caloric beverages, consumption of non-caloric beverages<br />
instead of sugar-sweetened beverages was associated<br />
with weight loss among participants with a higher baseline<br />
BMI (Ebbeling et al., 2006). The result of this trial are also of<br />
interest because the changed availability of beverages<br />
resulted in a marked decrease in consumption of sugarsweetened<br />
beverages over 25 weeks (reported 82% decrease<br />
in the intervention group) (Ebbeling et al., 2006). Drewnowski<br />
and Bellisle (2007) have pointed out that liquid meal<br />
replacement shakes containing amounts of sugars that are<br />
similar to the amount in sugar-sweetened beverages are<br />
commonly used for weight loss treatment. However, in<br />
contrast to sugar-sweetened soft drinks, liquid meal replacement<br />
shakes contain substantial amounts of protein and<br />
fiber and are used instead of meals rather than in addition to<br />
meals (Drewnowski and Bellisle, 2007).<br />
Cohort studies of sugar-sweetened beverages and long-term weight<br />
change. In a real-life setting, as compared with the<br />
described trials, additional factors may link the consumption<br />
of sugar-sweetened beverages to excess energy intake. These<br />
factors include huge serving sizes, free refills, massive<br />
advertising campaigns for soft drinks and the ubiquitous<br />
availability of soft drinks including vending machines at<br />
schools (Bray et al., 2004a). Recently, the literature on intake<br />
of sugar-sweetened beverages and weight gain has been<br />
systematically reviewed and 10 prospective cohort studies
European Journal of Clinical Nutrition<br />
Table 3 Intervention studies of sugar-sweetened soft drinks and body weight<br />
Reference/country Participants a<br />
(Tordoff and Alleva,<br />
1990) US<br />
(DiMeglio and<br />
Mattes, 2000) US<br />
(Raben et al., 2002)<br />
Denmark<br />
(James et al., 2004)<br />
UK<br />
(Ebbeling et al.,<br />
2006) US<br />
n ¼ 30. 9 F: age<br />
28.772.7, BMI<br />
25.471.4; 21 M:<br />
age 22.970.8, BMI<br />
25.170.5; 11 others<br />
dropped out and<br />
were not included<br />
in the analysis<br />
n ¼ 15 M/F: age<br />
22.872.7, BMI<br />
21.972.2. All<br />
participants included<br />
in the analysis<br />
n ¼ 41 overweight<br />
M/F. Sucrose group:<br />
n ¼ 21, age<br />
33.372.0, BMI<br />
28.070.5. Sweetener<br />
group: n ¼ 20, age<br />
37.172.2, BMI 27.6.<br />
One drop-out was<br />
not included in the<br />
analysis<br />
n ¼ 644 M/F, children<br />
age 7–11 year from<br />
six schools. 20% were<br />
overweight or obese<br />
n ¼ 103 M/F, age<br />
13–18 year. No loss<br />
to follow-up<br />
Trial design b<br />
Cross-over,<br />
participants were<br />
blinded<br />
Cross-over 2 4 week and<br />
4-week washout<br />
Randomized parallel;<br />
participants were<br />
blinded<br />
Cluster randomized<br />
(29 clusters ¼ classes)<br />
Randomized, parallel,<br />
allocation<br />
concealment<br />
Duration Intervention Control Compliance Results<br />
3 3 weeks 1135 g per day<br />
of supplied<br />
HFCS-sweetened<br />
soft drinks<br />
1880 kJ per day of<br />
sugar-sweetened soft<br />
drinks (‘liquid’)<br />
10 week Sucrose supplements<br />
(B70% as drinks)<br />
1 year Educational nutrition<br />
program mainly<br />
discouraging<br />
carbonated beverage<br />
use<br />
25 weeks Home delivery of<br />
non-caloric<br />
beverages (four<br />
servings per day)<br />
and instructions<br />
Two control<br />
interventions: 1135 g<br />
per day aspartamesweetened<br />
drinks or<br />
no specific<br />
instructions<br />
1880 kJ per day of<br />
jelly beans (‘solid’)<br />
Artificial sweetener<br />
supplements<br />
None Drink diaries<br />
completed by 36%:<br />
0.7 glass per day<br />
reduction of mainly<br />
diet carbonated<br />
beverages<br />
Instruction to<br />
continue usual<br />
beverage<br />
consumption<br />
Abbreviations: BMI, body mass index (kg/m 2 ); F, female; HFCS, high fructose corn syrup; M, male.<br />
a Values are means7s.d.<br />
b None of the trials reported on blinding of the assessors of outcomes, except for Ebbeling and co-workers allocation concealment was not reported.<br />
Diet records HFCS drinks vs no<br />
instructions:<br />
F þ 0.97 kg,<br />
M þ 0.72 kg. HFCS<br />
drinks vs aspartame<br />
drinks: F þ 0.72 kg,<br />
M þ 0.99 kg<br />
(P overall o0.01 for<br />
both F and M)<br />
Diet records Po0.05 for weight<br />
change during liquid<br />
period ( þ 0.5 kg),<br />
but not significantly<br />
different from change<br />
in the solid period<br />
( þ 0.3 kg)<br />
Diet records 2.6 (95% CI 1.3–3.8,<br />
Po0.001) kg increase<br />
in weight and 1.6<br />
(95% CI 0.4–2.8,<br />
Po0.01) increase in<br />
fat mass for the<br />
sucrose as compared<br />
with the artificial<br />
sweetener group<br />
24-h recalls: 82%<br />
reduction of sugarsweetened<br />
beverages<br />
in intervention group<br />
No substantial<br />
decrease in mean<br />
BMI (0.1 kg/m 2 , 95%<br />
CI 0.1–0.3), but a<br />
7.7% (95% CI<br />
2.2–13.1) decrease<br />
in prevalence of<br />
overweight/obesity<br />
as compared with<br />
control<br />
BMI: 0.14 (SE 0.21,<br />
P40.05) for the total<br />
group and 0.75<br />
(SE 0.34, P ¼ 0.03)<br />
for the upper<br />
baseline-BMI tertile<br />
as compared with<br />
the control group<br />
S87<br />
Carbohydrate intake and obesity<br />
RM van Dam and JC Seidell
S88<br />
Figure 4 Mean (7standard error) changes in body weight and fat<br />
mass during an intervention in which overweight subjects consumed<br />
supplements containing either sucrose (K; n ¼ 21) or artificial<br />
sweeteners (n; n ¼ 20) daily for 10 weeks. In the sucrose group,<br />
sucrose was mostly consumed as beverages (B70%). At specific<br />
time points for changes in body weight and fat mass, there were<br />
significant differences between the sucrose and sweetener groups:<br />
*Po0.05, **Po0.001 and ***Po0.0001. Reprinted from Raben et al.<br />
(2002) copyright 2002, with permission from the American Society<br />
for Nutrition.<br />
were identified (Malik et al., 2006). In most of these studies,<br />
increases in sugar-sweetened soft drink consumption were<br />
associated with weight gain. The lack of significant association<br />
in some of the studies may have been due to small<br />
sample sizes, short periods of follow-up and limited variation<br />
in soft drink consumption. In the largest study in children<br />
(n ¼ 11 654, age 9–14 years), an increase of two or more<br />
servings of sugar-sweetened soft drinks per day over a year<br />
was associated with an increase in BMI in both boys (0.14<br />
kg/m 2 , P ¼ 0.01) and girls (0.10 kg/m 2 , Po0.05; Berkey et al.,<br />
2004). In the largest study of adults, 51 603 women were<br />
followed for two 4-year periods (Schulze et al., 2004). Women<br />
who increased their sugar-sweetened soft drink consumption<br />
from less than weekly to daily had the largest weight gain<br />
(4.7 kg for the first and 4.2 kg for the second period), whereas<br />
women who reduced their consumption from daily to less<br />
than weekly had the smallest weight gain (1.3 kg for the first<br />
and 0.2 kg for the second period; P-value differences between<br />
groups 0.001). The finding of an association between sugarsweetened<br />
beverage consumption and weight gain has not<br />
been limited to US populations (Bes-Rastrollo et al., 2006b).<br />
Although these prospective studies considered confounding<br />
in detail, remaining confounding by other dietary and<br />
lifestyle factors cannot be excluded. However, the results of<br />
cohort studies are consistent with the findings from intervention<br />
studies and suggest that consumption of sugarsweetened<br />
soft drinks is relevant for long-term weight<br />
management. It is plausible that findings for sugarsweetened<br />
soft drinks also apply to juices high in free sugars<br />
European Journal of Clinical Nutrition<br />
Carbohydrate intake and obesity<br />
RM van Dam and JC Seidell<br />
such as apple juice, but effects of juices on body weight have<br />
not been tested experimentally and results from observational<br />
studies have been mixed (Malik et al., 2006).<br />
High-fructose corn syrup versus sucrose-sweetened beverages. It<br />
has been suggested that the use of high-fructose corn syrup<br />
to sweeten soft drinks has contributed to the increased<br />
prevalence of obesity in the US (Bray et al., 2004a). The most<br />
commonly used type of high-fructose corn syrup contains<br />
55% fructose and 45% glucose, which is similar to sucrose.<br />
Theoretically, the separated glucose and fructose (as in highfructose<br />
corn syrup) may have different effects than<br />
conjoined molecule (as in sucrose before it is broken down<br />
in the intestine) related to slightly higher sweetness and<br />
higher osmolarity (Bray et al., 2004a). It should be noted,<br />
however, that the Danish trial found effects of sucrosesweetened<br />
foods on weight gain (Raben et al., 2002).<br />
Therefore, reduction of the consumption of both sucrosesweetened<br />
and high-fructose corn syrup sweetened soft<br />
drinks is warranted.<br />
Conclusion on free sugars and sugar-sweetened beverages<br />
Short-term experiments suggest that satiety and satiation<br />
may be lower for carbohydrates consumed as beverages as<br />
compared with carbohydrates consumed as solid foods.<br />
Although long-term randomized controlled trials of sugarsweetened<br />
beverages are lacking, evidence from short-term<br />
blinded randomized controlled trials, medium-term nonblinded<br />
randomized trials, and long-term prospective cohort<br />
studies indicates that reduction of consumption of sugarsweetened<br />
beverages is beneficial for weight management.<br />
Some data also support that reduction of solid foods high in<br />
free sugars can contribute to weight loss, but findings have<br />
been less consistent than for sugar-sweetened beverages. The<br />
high energy density and low content of micronutrients and<br />
fiber of many foods high in free sugars such as sugary candy,<br />
table sugar, cookies and cakes should be considered.<br />
Dietary GI and glycemic load<br />
Introduction<br />
The GI of a food quantifies the strength of the blood glucose<br />
response after consumption of a fixed amount of available<br />
carbohydrates from that food as compared with the response<br />
after consumption of the same amount of available carbohydrate<br />
from a reference food (glucose or white bread) (Foster-<br />
Powell et al., 2002). The glycemic load (GL) is the product of<br />
the GI of a food and the amount of carbohydrate that it<br />
contains (Foster-Powell et al., 2002). The GL was conceived<br />
to reflect the total blood glucose-raising potential of the diet.<br />
The GL of a diet can thus be reduced by reducing the GI of<br />
the diet and/or by reducing the amount of carbohydrate<br />
consumed. It is important to clearly distinguish between the<br />
GI and the GL. First, the GL of a diet is strongly influenced by
its carbohydrate content, whereas a low-GI diet can be either<br />
high or low in carbohydrates. Second, physiological effects<br />
can be different for low-GI diets as compared with low-GL<br />
diets (Wolever et al., 1995). For example, in a study that<br />
evaluated four meals with different combinations of the GI<br />
(low or high) and carbohydrate content (low or high), the<br />
greatest contrast in effects on free fatty acid levels was found<br />
between the low-GI/high-carbohydrate meal and the low-GI/<br />
low-carbohydrate (that is, lowest GL) meal (Wolever et al.,<br />
1995).<br />
Mechanistic studies of the GI and GL and energy balance<br />
It has been postulated that consumption of high-GI foods<br />
can lead to excess energy intake through rapid rises and<br />
rapid subsequent declines in blood glucose concentrations<br />
and associated increases in levels of counter-regulatory<br />
hormones (Ludwig, 2002). This is supported by the observation<br />
that declines in blood glucose concentrations acutely<br />
increased voluntary food intake in time-blinded volunteers<br />
(Melanson et al., 1999). Several studies have reported<br />
beneficial effects of low-GI meals on self-reported hunger<br />
and short-term energy intake (Raben, 2002; Pereira et al.,<br />
2004), but overall findings have been mixed (Raben, 2002).<br />
In addition, a greater reduction in resting energy expenditure<br />
has been observed in 39 overweight adults after a 10%<br />
weight reduction as result of a high-GL hypocaloric diet than<br />
after the same weight reduction as a result of a hypocaloric<br />
diet with a lower GL (Pereira et al., 2004). No differences in<br />
lean or fat mass were detected and the authors suggested that<br />
low postprandial circulating concentrations of metabolic<br />
substrates may have caused this difference possibly through<br />
neuroendocrinological adaptations to conserve energy<br />
(Pereira et al., 2004). It cannot be fully excluded that other<br />
differences between the diets including substantial differences<br />
in protein, fiber and micronutrients may have<br />
contributed to the observed effects.<br />
It is plausible that the effects on energy balance differ for<br />
different types of low-GI foods. For example, it has been<br />
reported that having some low-GI foods (for example,<br />
spaghetti) for breakfast reduced the glycemic response to a<br />
subsequent lunch as compared with high-GI white wheat<br />
bread, whereas having other low-GI foods for breakfast (for<br />
example, white wheat bread with added vinegar) did not<br />
(Liljeberg et al., 1999). The authors suggested that the<br />
‘second-meal effect’ for the former foods might have resulted<br />
from the prolonged elevation of postprandial glucose<br />
concentrations and avoidance of a between-meal fasting.<br />
Furthermore, the effect of foods with a low-GI as a result<br />
of slow absorption of starches in the intestines may be<br />
different from that of foods with a low GI as a result of high<br />
fructose content. For example, slowly absorbed starches may<br />
reach the lower part of the ileum and stimulate the secretion<br />
of gut satiety hormones such as glucagon-like peptide-1<br />
(McMillan-Price and Brand-Miller, 2006).<br />
Carbohydrate intake and obesity<br />
RM van Dam and JC Seidell<br />
Cohort studies of the GI and GL<br />
The association between the dietary GI or GL and changes in<br />
body weight has been examined in two cohort studies, and<br />
lower values were associated reductions in body weights<br />
(Spieth et al., 2000; Ma et al., 2005). However, the limited<br />
control for other dietary factors (Spieth et al., 2000; Ma et al.,<br />
2005) and substantial loss to follow-up (Spieth et al., 2000)<br />
complicate the interpretation of these results.<br />
Intervention studies of the GI and weight change<br />
Table 4 presents data on intervention studies that examined<br />
the dietary GI in relation to body weight and body fatness<br />
(Slabber et al., 1994; Tsihlias et al., 2000; Bouche et al., 2002;<br />
Wolever and Mehling, 2003; Sloth et al., 2004; Carels et al.,<br />
2005; Raatz et al., 2005). These trials had a duration ranging<br />
from 5 weeks (Bouche et al., 2002) to 12 months (Carels et al.,<br />
2005), and included only dietary advice (Slabber et al., 1994;<br />
Bouche et al., 2002; Carels et al., 2005; Raatz et al., 2005),<br />
provision of key foods (Tsihlias et al., 2000; Wolever and<br />
Mehling, 2003) or provision of foods that provided much of<br />
the total energy intake (Sloth et al., 2004; Raatz et al., 2005).<br />
The presented intervention studies tested effects of slowly<br />
absorbed carbohydrates rather than fructose-rich low-GI<br />
foods. Effects of the dietary GI on body weight may be<br />
mediated by effects on satiety/satiation and energy intake.<br />
Therefore, we did not include studies in which energy<br />
intakes were fixed. In the study by Raatz et al. (2005) the<br />
energy intake was fixed in the first phase of the study, but<br />
not in the second ‘free-living’ phase. Although the dietary<br />
advice in the Slabber et al. (1994) intervention had a specific<br />
deficit in energy intake as a target, the characteristics of the<br />
trial (no foods provided 12-week duration) implied that the<br />
energy intake of the participants could still vary widely.<br />
In one of the studies, the low-GI intervention resulted in a<br />
statistically significant reduction in weight as compared with<br />
the control intervention (Slabber et al., 1994). This study<br />
consisted of a randomized parallel trial comparing a low-GI<br />
diet (‘low insulin response’ diet) with a control diet<br />
(‘balanced diet’), where about half of the participants<br />
volunteered to subsequently switch the other diet resulting<br />
in a cross-over study (Slabber et al., 1994). Although the same<br />
trend was observed in the parallel study and the cross-over<br />
study, differences in weight loss were only statistically<br />
significant in the latter. The used cross-over study approach<br />
may result in selection bias, because volunteering to switch<br />
to the other diet may depend on the experience with the<br />
previous diet. Another limitation of this study is that it is not<br />
reported how the diets changed as a result of the provided<br />
advice. Differences in diets other than the GI may have<br />
occurred, for example the ‘low-insulin response’ advice also<br />
included the instruction not to use any snacks. In a French<br />
study, dietary advice to consume low-GI foods did not lead<br />
to a lower body weight but resulted in a 0.5 kg lower fat mass<br />
as compared with dietary advice to eat high-GI foods<br />
(Bouche et al., 2002). Fiber intake also differed substantially<br />
S89<br />
European Journal of Clinical Nutrition
European Journal of Clinical Nutrition<br />
Table 4 Intervention studies of low GI diets and body weight<br />
Reference/country Participants a<br />
(Slabber et al., 1994)<br />
South Africa<br />
(Tsihlias et al., 2000)<br />
Canada<br />
(Bouché et al., 2002)<br />
France<br />
(Wolever and Mehling,<br />
2003) Canada<br />
(Sloth et al., 2004)<br />
Denmark<br />
(Carels et al., 2005)<br />
US<br />
n ¼ 30 F age 3576<br />
years, BMI 3574.<br />
No loss to follow-up.<br />
n ¼ 16 participants<br />
volunteered to switch<br />
to the other diet after<br />
completion<br />
M/F type 2 diabetes<br />
High GI: n ¼ 22, age<br />
63, BMI 28. Low GI:<br />
n ¼ 26 age 62, BMI 28.<br />
An additional n ¼ 7<br />
(high GI) and n ¼ 4<br />
(low GI) were lost to<br />
follow up and not<br />
included in analyses<br />
n ¼ 11 months, age<br />
46, BMI 28. No loss<br />
to follow-up<br />
M/F impaired glucose<br />
tolerance; low GI:<br />
n ¼ 13 age 55, BMI 30;<br />
high GI: n ¼ 11 age 59,<br />
BMI 29<br />
Trial design a<br />
Parallel design with<br />
minimization and<br />
cross-over study<br />
Duration Intervention Control Compliance Results<br />
12 week (2 12 weeks<br />
for cross-over study):<br />
counseling<br />
Randomized parallel 6 months: breakfast<br />
cereals (10–15% total<br />
energy intake)<br />
provided and meal<br />
plans<br />
Randomized crossover<br />
study<br />
2 5weekand5week<br />
washout: counseling<br />
Randomized parallel 4 months: monthly<br />
counseling and key<br />
foods provided<br />
F low GI: n ¼ 23, age Randomized parallel,<br />
29, BMI 27.6; high GI: participants blinded<br />
n ¼ 22, age 31, BMI with regard to study<br />
27.6; another n ¼ 6 aim<br />
(low GI) and n ¼ 4<br />
(high GI) lost to<br />
follow-up not included<br />
in primary analysis<br />
n ¼ 40 F/M. Low GI,<br />
age 43.4, BMI 38.0;<br />
high GI, age 43.5,<br />
BMI 37.2. An<br />
additional n ¼ 13 was<br />
lost to follow up and<br />
not included in the<br />
analysis<br />
10 weeks: test foods<br />
provided (B49% of<br />
total energy)<br />
Randomized parallel 20 week with weekly<br />
group sessions and<br />
12 months follow-up<br />
Only carbohydrate<br />
foods with low insulin<br />
response,<br />
carbohydrate foods in<br />
separate meals, no<br />
snacks<br />
Low-GI cereals<br />
provided<br />
Foods with GI o45<br />
recommended<br />
Instructed X1 low-GI<br />
food at each meal<br />
Low-GI test foods (GI<br />
103)<br />
‘Balanced diet’. Both<br />
advised intervention<br />
and control diet<br />
were hypocaloric<br />
(4200–5000 kJ<br />
per day)<br />
High-GI cereals<br />
provided<br />
Foods with GI 460<br />
recommended<br />
Instructed X1<br />
high-GI food at<br />
each meal<br />
High-GI test foods<br />
(GI 79)<br />
Behavioral weight loss Behavioral weight<br />
program þ GI loss program only<br />
education and popular<br />
book on GI<br />
Diet records.<br />
Difference in GI not<br />
reported<br />
Diet records: low GI<br />
reported 10 point<br />
lower GI and<br />
27 g per day higher<br />
fiber intake as<br />
compared with high<br />
GI<br />
Diet records: Low GI<br />
30 point lower GI<br />
and 12 g per day<br />
higher fiber intake<br />
Diet records: Low GI<br />
decreased GI 4.3<br />
points and increased<br />
fiber 12 g per day.<br />
No significant<br />
changes for high GI<br />
Test food diaries<br />
(495% used),<br />
urinary lithium<br />
recovery from the<br />
provided bread<br />
(low GI 74%, high<br />
GI 82%, P40.05),<br />
diet records<br />
Test of difference in<br />
GI knowledge,<br />
session attendance,<br />
diet records: fivepoint<br />
GI difference<br />
achieved<br />
Parallel: intervention<br />
diet 9.3 kg, control<br />
7.4 kg, difference<br />
1.9 kg (95% CI 0.7,<br />
4.6; P ¼ 0.14). Crossover:<br />
intervention diet<br />
7.4 kg, control<br />
4.5 kg, difference<br />
2.9 kg (95% CI 0.1,<br />
5.8; P ¼ 0.04)<br />
No statistically<br />
significant differences<br />
in body weight (high<br />
GI B1 kg more weight<br />
loss than low GI)<br />
No statistically<br />
significant difference<br />
in body weight. Low<br />
GI lost 0.52 kg body<br />
fat, high GI 0.02<br />
(difference 0.50 kg<br />
Po0.05)<br />
High GI: 0.49 kg, low<br />
GI 0.19 kg<br />
(difference 0.30 kg,<br />
Po0.05)<br />
Low GI: 1.9 (SE 0.5)<br />
kg, high GI 1.3<br />
(SE 0.3) kg (difference<br />
0.6 kg, P ¼ 0.31) body<br />
weight (intention to<br />
treat: difference<br />
0.4 kg, P ¼ 0.57). Fat<br />
mass: low GI 1.0<br />
(0.4) kg, high GI 0.4<br />
(0.3) kg (P difference<br />
0.20)<br />
After 20 weeks: low<br />
GI 7.1 kg weight loss,<br />
controls: 8.2 kg weight<br />
loss. Difference not<br />
statistically significant,<br />
also not after 12<br />
months follow-up<br />
S90<br />
Carbohydrate intake and obesity<br />
RM van Dam and JC Seidell
Table 4 Continued<br />
Duration Intervention Control Compliance Results<br />
Trial design a<br />
Reference/country Participants a<br />
Feeding phase: low GI<br />
9.95 kg, 6.9 kg fat<br />
mass. High GI 9.3 kg,<br />
4.5 kg fat mass.<br />
Additional weight<br />
change in free-living<br />
phase: 1.8 kg for low<br />
GI and 1.6 kg for<br />
high GI. No significant<br />
differences between<br />
groups<br />
Diet records: no<br />
significant difference<br />
in GI between<br />
groups after<br />
free-living phase<br />
Feeding phase:<br />
hypocaloric (3128 kJ<br />
per day deficit), high<br />
GI. Free living: advised<br />
to continue this diet<br />
Feeding phase:<br />
hypocaloric (3138 kJ<br />
per dcay deficit), low<br />
GI. Free living: advised<br />
to continue this diet<br />
F/M adults. Low GI, Randomized parallel 12-week feeding<br />
n ¼ 10, BMI 37.7. High<br />
phase (all foods<br />
GI, n ¼ 9, BMI 34.6.<br />
provided) þ 24-week<br />
31% lost to follow-up<br />
free-living phase with<br />
in feeding phase.<br />
counseling<br />
During the free living<br />
phase n ¼ 4 of the low<br />
GI and n ¼ 1ofthe<br />
high-GI group lost.<br />
No intention to treat<br />
analysis<br />
(Raatz et al., 2005)<br />
US<br />
Abbreviations: BMI, body mass index (kg/m); F, female; GI, glycemic index; M, male.<br />
Values are means (s.d.) unless reported otherwise.<br />
a<br />
None of the studies reported on blinding of outcome assessors or allocation concealment.<br />
Carbohydrate intake and obesity<br />
RM van Dam and JC Seidell<br />
between the diets, and given the magnitude of the effect<br />
other modest differences between the intervention diets may<br />
also have been responsible. In a Danish study, almost half of<br />
the foods were provided, allowing better control of differences<br />
between the diets, and recovery of lithium from the<br />
provided breads was used to monitor compliance (Sloth<br />
et al., 2004). Despite the substantial differences in the GI of<br />
the diets, no statistically significant effects on body weight<br />
or fat mass were observed although a small beneficial effect<br />
could not be excluded either. In the studies by Raatz et al.<br />
(2005) (‘free living phase’ of the study) and Carels et al.<br />
(2005) low-GI dietary advice did not have effects on body<br />
weight as compared with the control interventions, but<br />
achieved differences in dietary GI were small. In two<br />
Canadian studies, provision of key low-glycemic foods<br />
resulted in modest differences in dietary GI, but did not<br />
result in a lower body weight over 4 or 6 months as<br />
compared with the provision of high-GI foods (Tsihlias<br />
et al., 2000; Wolever and Mehling, 2003). In contrast, weight<br />
loss tended to be somewhat larger for the high-GI as<br />
compared with the low-GI diet. A larger randomized<br />
intervention study that evaluates substantial differences in<br />
the dietary GI in the absence of other dietary differences<br />
with the control group would be of interest. In addition, it<br />
may be warranted to distinguish further between different<br />
types of low-GI foods. However, the currently available data<br />
provides little support for an important role of the dietary GI<br />
in weight management.<br />
Intervention studies of the GL and weight change<br />
Four studies aimed to test the effects of low-GL diets on body<br />
weight (Table 5). The effect of low-GL dietary advice on body<br />
weight was tested in 16 obese adolescents (Ebbeling et al.,<br />
2003). The low-GL advice resulted in a substantially larger<br />
reduction in fat mass as compared with the conventional<br />
control diet. Given the very small resulting differences in<br />
dietary GI and carbohydrate intake between the intervention<br />
and control diet, effects on body fat may also have resulted<br />
from other beneficial characteristics of the recommended<br />
foods (non-starchy vegetables, fruits, legumes, nuts, dairy) or<br />
a greater acceptation of the ad libitum approach by the<br />
adolescents (Ebbeling et al., 2003). The same low-GL advice<br />
resulted in greater changes in GI, carbohydrate intake, and<br />
GL in a trial in young adults, but did not result in a<br />
statistically significant greater reduction in body fat or fat<br />
mass (Ebbeling et al., 2005). In a substantially larger 12-week<br />
Australian trial, four diets were compared: (A) a high-GI/<br />
high-carbohydrate diet (highest GL), (B) a low-GI/highcarbohydrate<br />
diet, (C) a high-GI/high-protein diet and (D)<br />
a low-GI/high-protein diet (lowest GL) (McMillan-Price et al.,<br />
2006). No significant differences in weight loss or decrease in<br />
fat mass were found, although the percentage with at least<br />
5% weight loss was greater for diets B and C than for the<br />
other diets. Also, in a subgroup analysis in women, more fat<br />
mass was lost for diets B and C than for the other diets.<br />
S91<br />
European Journal of Clinical Nutrition
European Journal of Clinical Nutrition<br />
Table 5 Randomized intervention studies of low GL diets and body weight (all parallel design) a<br />
Reference/<br />
country<br />
(Ebbeling et al.,<br />
2003) US<br />
(Ebbeling et al.,<br />
2005) US<br />
(McMillan-Price<br />
et al., 2006) US<br />
(Maki et al.,<br />
2007) US<br />
(Das et al. 2007)<br />
US<br />
Participants a<br />
Obese adolescents M/F.<br />
Low glycemic load (GL):<br />
n ¼ 8, age 17, BMI 35, fat<br />
mass 39 kg; high GL: n ¼ 8,<br />
age 15, BMI 37, fat mass<br />
49 kg (P ¼ 0.03 vs low GL);<br />
n ¼ 2 lost to follow-up but<br />
included in intention to<br />
treat<br />
F/M. Low GL: n ¼ 11, age<br />
30, BMI 34.0. High GL:<br />
n ¼ 12, age 27, BMI 27.2.<br />
An additional n ¼ 6 (low<br />
GL) and n ¼ 5 (high GL)<br />
lost to follow up<br />
F/M, age 18–40 BMI<br />
X25 kg/m 2 A. High GI/<br />
high carb: n¼ 32, B. Low<br />
GI/high carb: n¼ 32, C.<br />
High GI/high protein:<br />
n ¼ 32, D. Low GI/high<br />
protein: n ¼ 33. n ¼ 5, 2, 1<br />
and 5 withdrew, but<br />
included in intention to<br />
treat<br />
F/M, age 18–65 waist<br />
X87 cm for women and<br />
X90 cm for men. Low GL:<br />
n ¼ 43, control diet:<br />
n ¼ 43. n ¼ 10 and 7 lost to<br />
follow-up, but all except 1<br />
for both groups included in<br />
intention to treat for<br />
weight (last observation<br />
carried forward)<br />
F/M, age 24–42 BMI 25–<br />
30 kg m 2 . Low GL: n ¼ 17.<br />
High GL: n ¼ 17. n ¼ 3and<br />
2 lost to follow-up<br />
Duration Intervention Control Compliance Results<br />
12 months: 12<br />
counseling<br />
sessions during<br />
0–6 months and<br />
2 during 6–12<br />
months<br />
Ebbeling et al.<br />
(2003)<br />
12 weeks:<br />
counseling and<br />
provision of key<br />
foods each week<br />
36 weeks starting<br />
with 12–24 weeks<br />
weigh loss phase<br />
followed by<br />
weight<br />
maintenance.<br />
Counseling at 14<br />
visits and written<br />
information<br />
1 year: 6 months,<br />
where foods were<br />
provided followed<br />
by 6 months with<br />
counseling and<br />
self-selected foods<br />
Low to moderate GI foods,<br />
balanced consumption of<br />
carbohydrates with fat and<br />
protein at each meal/<br />
snack; ad libitum<br />
Low glycemic load: see<br />
Ebbeling et al.(2003)<br />
All eating plans were<br />
hypocaloric (B1400 kcal<br />
for women and 1900 kcal<br />
for men), but participants<br />
were told to ‘eat to<br />
appetite’ and accordingly<br />
eat more or less than<br />
eating plan. Diet A had the<br />
highest GL (diet records:<br />
129 g) and diet D the<br />
lowest GL (59 g)<br />
‘Ad libitum reduced GL’.<br />
first phase: 2 weeks with<br />
elimination of high<br />
carbohydrate foods.<br />
Second phase: addition of<br />
low-GI foods<br />
Low GL with 30% caloric<br />
restriction. Lower GI foods<br />
and 40 en% carb, 30 en%<br />
fat, 30 en% protein<br />
Reduced fat and<br />
hypocaloric (250–<br />
500 kcal per day<br />
deficit)<br />
Reduced fat and<br />
hypocaloric (250–<br />
500 kcal per day<br />
deficit)<br />
‘Portioncontrolled<br />
low-fat<br />
diet’. Reduction<br />
of high-fat foods,<br />
portion sizes, and<br />
energy density<br />
aiming at deficit<br />
of 500–800 kcal<br />
per day<br />
High GL with<br />
30% caloric<br />
restriction. Higher<br />
GI foods and 60<br />
en% carb, 20<br />
en% fat, 20 en%<br />
protein and<br />
higher GI foods<br />
Diet records (follow-up):<br />
low GL 10 g per<br />
1000 kcal lower GL, 3<br />
en% lower carbohydrate<br />
and 3 point lower GI<br />
than control group<br />
Diet records. Low vs high<br />
GL: 24 g per 1000 kcal<br />
lower GL, 7 point lower<br />
GI, 12 en% lower<br />
carbohydrate<br />
Diet records and<br />
monitoring of 10 h<br />
glucose and insulin<br />
responses indicated that<br />
substantial contrasts in GI<br />
and GL existed between<br />
the diets. Fiber intake<br />
was substantially higher<br />
for diet B than for the<br />
other diets<br />
FFQ (for GI and GL) and<br />
diet records. Low GL vs<br />
control (week 36): 55 g<br />
lower carbohydrate, 23 g<br />
lower sucrose/fructose, 3<br />
point lower GI, 33%<br />
lower GL<br />
Provided foods for high<br />
GL vs low GL had a 63%<br />
higher GI 161% higher<br />
GL. Caloric restriction<br />
(doubly labeled water) at<br />
3 months, 6 months and<br />
12 months were 21%,<br />
16%, and 17% for high<br />
GL and 28%, 18% and<br />
10% for low GL<br />
Abbreviations: BMI, body mass index (kg m 2 ); en%, energy percent; F, female; FFQ, food frequency questionnaire; GI, glycemic index; GL, glycemic load; M, male. Values are means.<br />
a Das et al. reported the blinding of outcome assessors. None of the other studies reported on blinding of outcome assessors or allocation concealment.<br />
BMI decreased 1.8<br />
(P ¼ 0.02) and fat mass<br />
4.2 kg (P ¼ 0.01) for low<br />
GL as compared with<br />
control diet<br />
Low GL: weight 7.8 kg,<br />
fat mass 16.5%. High<br />
GL: weight 6.1 kg<br />
(P ¼ 0.89 vs low GL), fat<br />
mass 15.7% (P ¼ 0.97).<br />
Similar for intention to<br />
treat analysis<br />
Diet A: weight 3.7, fat<br />
2.8 kg; diet B: weight<br />
4.8, fat 4.5 kg; diet C:<br />
weight 5.3, fat 4.3 kg;<br />
diet D: weight 4.4, fat<br />
3.7 kg P ¼ 0.17 for<br />
differences in weight and<br />
P ¼ 0.08 for differences in<br />
fat mass<br />
Low GL: weight 4.9, fat<br />
2.2, fat-free mass<br />
2.1 kg. Control: weight<br />
2.5, fat 1.3, fat-free<br />
mass 0.9 kg P ¼ 0.09 for<br />
difference in weight,<br />
P ¼ 0.33 for difference in<br />
fat, P ¼ 0.004 for<br />
difference in fat-free mass<br />
Low GL: weight 10.4%<br />
(6 months) and 7.8%<br />
(12 months). High GL:<br />
weight 9.1% (6<br />
months) and 8.0% (12<br />
months). No significant<br />
differences between diet<br />
groups (also not in body<br />
fat %)<br />
S92<br />
Carbohydrate intake and obesity<br />
RM van Dam and JC Seidell
Despite a substantially lower GL for diet D as compared with<br />
diet A, according to diet records ( 54%) and 10-h incremental<br />
area under the glucose ( 38%) and insulin ( 45%)<br />
curve on profile days, no substantial or significant difference<br />
in loss of fat mass was observed. Thus, although results from<br />
this study could be seen as supportive for a low-GI /highcarbohydrate/high-fiber<br />
diet and a high-protein diet for<br />
weight loss, the unexpected results for the diet that<br />
combined a low-GI and high protein intake, the sex<br />
differences in results and the limited duration warrant a<br />
cautious interpretation. In a US study, a reduced GL diet was<br />
compared with a portion-controlled low-fat diet (Maki et al.,<br />
2007). Weight loss and loss of fat mass was greater for the<br />
low-GL diet as compared with the control diet after 12 weeks<br />
(‘weight loss phase’), but these differences did not remain<br />
significant after 36 weeks (‘weight maintenance phase’).<br />
Finally, another US study in 34 participants combined a goal<br />
of 30% caloric restriction with a low or high-GL diet (Das<br />
et al., 2007). No significant differences in weight loss or<br />
energy intake measured with the doubly labeled water<br />
method were found after either the 6-month phase in which<br />
all foods were provided or the subsequent 6-month phase<br />
where the participants selected the foods themselves. In<br />
summary, studies that have directly compared low- and<br />
high-GL diets do not consistently support this hypothesis<br />
that a low-GL diet supports weight loss.<br />
Conclusion on GI and GL<br />
Current evidence from studies on low-GI and low-GL diets is<br />
too limited to warrant specific recommendation with regard<br />
to these concepts for the prevention of obesity. Caution<br />
with regard to the health effects of high fructose intake is<br />
warranted, whereas other low-GI foods such as legumes that<br />
also have other beneficial nutritional properties could be<br />
recommended as part of a diet for weight control.<br />
Dietary fiber<br />
Introduction<br />
A higher fiber content contributes to a lower energy density<br />
of foods (Slavin, 2005). In addition, viscous fibers form a<br />
viscous gel in contact with water and have been suggested to<br />
reduce energy intake through increased feelings of fullness<br />
(Pasman et al., 1997). These types of fiber may also increase<br />
gastrointestinal transit time, slow glucose absorption and<br />
lead to a more gradual increase in blood glucose levels (see<br />
glycemic index section) (Slavin, 2005).<br />
Intervention studies of ‘fiber’ supplements and body weight<br />
Guar gum is a viscous galactomannan fiber that is<br />
commonly used in the form of supplements in attempts to<br />
lose weight (Pittler and Ernst, 2001). In a meta-analysis<br />
published in 2001, the results of 11 randomized double-blind<br />
Carbohydrate intake and obesity<br />
RM van Dam and JC Seidell<br />
trials of guar gum intake and body weight were pooled<br />
(Pittler and Ernst, 2001). The results did not suggest a<br />
difference in effect on body weight as compared with<br />
placebo treatment (weighted mean difference 0.04 kg;<br />
95% confidence interval 2.2 to 2.1). In a 14-month<br />
randomized intervention study with 11 obese women,<br />
adding 20 g of guar gum supplements per day to an ad<br />
libitum diet after completion of a very low-calorie diet did<br />
not reduce weight as compared with controls (Pasman et al.,<br />
1997). Timing of the intake of fiber supplements in relation<br />
to meals may be relevant (Pasman et al., 1997). Also, fiber<br />
supplements may not have appreciable effects in isolation,<br />
but rather improve adherence to hypocaloric diets. Ryttig<br />
et al. (1989) examined the effects of a fiber supplement in<br />
combination with a hypocaloric diet in a series of doubleblind,<br />
randomized trials of 3- to 12-month duration in<br />
overweight persons (Rossner et al., 1987; Rigaud et al., 1990).<br />
The addition of the fiber supplements to a hypocaloric diet<br />
led to a statistically significant 1–2 kg greater weight loss as<br />
compared with a placebo in combination with the hypocaloric<br />
diet. An effect of similar magnitude was observed for<br />
adding viscous glucomannan fiber supplement to a hypocaloric<br />
diet in 5-week placebo-controlled double-blind<br />
randomized study (Birketvedt et al., 2005). In summary,<br />
although results for ‘fiber’ supplements on body weight have<br />
been mixed there is some evidence that these supplements<br />
may increase adherence to hypocaloric diets and thus lead to<br />
a small additional weight loss. The role of different types of<br />
fiber as well as the timing of fiber intake requires further<br />
study in this context.<br />
Weight loss interventions with high-fiber foods<br />
In a randomized trial in obese men and women that received<br />
an energy-restricted diet (target 500 kcal per day deficit) for<br />
48 weeks additional advice to increase consumption of<br />
vegetables, fruit and whole grains was associated with a<br />
B10 g per day reported higher fiber intake, but not with<br />
greater weight loss (Thompson et al., 2005). In a 2-year<br />
randomized trial, the effect of a ‘Mediterranean-style’ diet<br />
high in fiber-rich foods was tested in 180 persons with the<br />
metabolic syndrome (Esposito et al., 2004). The intervention<br />
group received individualized dietary advice from a dietician<br />
(monthly session in the 1st year, bimonthly in the second<br />
year) and participated in group sessions with education on<br />
reducing calories, personal goal setting and self-monitoring.<br />
Aims included increasing consumption of fruits, vegetables,<br />
legumes, nuts, whole grains and olive oil combined with less<br />
than 30% of energy from fat and 50–60% from carbohydrates.<br />
The control group did not receive individualized<br />
advice, but only general recommendations based on the<br />
same goals for macronutrient intakes. Weight loss after 2<br />
years was 4.0 kg for the intervention and 1.2 kg for the<br />
control group (difference 2.8 kg, 95% confidence interval<br />
0.5–5.1). The 16 g per day greater increase in fiber intake as<br />
well as other characteristics of the recommended foods or<br />
S93<br />
European Journal of Clinical Nutrition
S94<br />
the educational program may have contributed to this<br />
greater weight loss.<br />
Intervention studies of high-fiber foods not primarily aimed at<br />
weight loss<br />
In the Women’s Health Initiative, a modest self-reported<br />
increase in fruit, vegetable and fiber intake was observed in<br />
the intervention group and this was not associated with a<br />
substantial long-term effect on body weight (Howard et al.,<br />
2006). Other trials that were not aimed at weight loss<br />
generally did not find an effect of increased consumption of<br />
fruits and vegetables on body weight (Rolls et al., 2004). For<br />
example, in a 1-year trial in 201 men and women specifically<br />
aimed at fruit and vegetable consumption, fruit (diet records<br />
þ 2.8 serving per day), vegetable ( þ 1.4 serving per day),<br />
juice ( þ 2.5 serving per day) and fiber intake ( þ 5.5 g per<br />
day) increased substantially more in the intervention as<br />
compared with the control group (Smith-Warner et al.,<br />
2000). These changes were supported by increased plasma<br />
carotenoid concentrations, but no appreciable difference in<br />
weight change was found between the intervention<br />
( þ 0.3 kg) and control group ( þ 0.4 kg). It has been suggested<br />
that concomitant increases in juice consumption, a highcaloric<br />
beverage, may have reduced possible beneficial effects<br />
of the fruits and vegetable interventions on body weight<br />
(Rolls et al., 2004). An alternative explanation that is<br />
consistent with the results from prospective cohort studies<br />
is that effects of higher consumption of fiber-rich foods on<br />
body weight are modest and only apparent after several<br />
years.<br />
Cohort studies of high-fiber foods and long-term weight change<br />
The association between fiber intake and weight change has<br />
been examined in several large prospective cohort studies<br />
with detailed adjustment for potential confounders. In a<br />
study of men, a 10 g per day increase in fiber intake was<br />
associated with a 2.25 kg lower weight gain over 8 years after<br />
correction for measurement error in the assessment of fiber<br />
intake (Koh-Banerjee et al., 2004). Similar results have been<br />
obtained in women, younger adults, and a Mediterranean<br />
population (Ludwig et al., 1999; Liu et al., 2003; Bes-Rastrollo<br />
et al., 2006a). Higher consumption of whole grains (Liu et al.,<br />
2003; Koh-Banerjee et al., 2004) and fruits and vegetables (He<br />
et al., 2004; Bes-Rastrollo et al., 2006a) was also associated<br />
with a modestly lower long-term weight gain. These findings<br />
may reflect a dietary pattern rather than fiber intake per se,<br />
and the possibility that confounding by unmeasured or<br />
imprecisely measured factors contributed to these associations<br />
cannot be excluded.<br />
Conclusion on dietary fiber<br />
The currently available evidence does not support a major<br />
effect of fiber intake on weight loss, but evidence is<br />
European Journal of Clinical Nutrition<br />
Carbohydrate intake and obesity<br />
RM van Dam and JC Seidell<br />
consistent with modest long-term effects of higher consumption<br />
of fiber-rich foods on body weight gain. An<br />
important reason to attempt weight loss is the prevention<br />
of morbidity associated with excess adiposity including type<br />
2 diabetes, coronary heart disease and stroke (Willett et al.,<br />
1999). Consumption of a diet high in fruits, vegetables and<br />
whole grains is associated with reduced risk of these diseases<br />
(Appel et al., 1997; de Lorgeril et al., 1999; Jacobs and<br />
Gallaher, 2004) and should therefore be included in diets for<br />
long-term weight management. Ad libitum intervention<br />
studies that specifically examine the effects of whole grain<br />
consumption on body weight appear to be lacking and this<br />
topic warrants further research.<br />
General discussion<br />
Although weight gain is due to an imbalance between energy<br />
intake and energy expenditure, this equation is deceivingly<br />
simple in the context of obesity prevention and treatment<br />
under realistic conditions. Complex feedback mechanisms<br />
appear to stimulate regaining lost weight (Hirsch et al., 1998)<br />
and potent environmental influences stimulate over-consumption<br />
of ubiquitously available foods and a sedentary<br />
lifestyle (Egger and Swinburn, 1997). The optimal macronutrient<br />
composition of diet for weight management may<br />
also differ by individual characteristics. First, the response to<br />
diets may differ by genetic susceptibility of individuals<br />
(Memisoglu et al., 2003), although a recent study of 26<br />
candidate genes did not identify important modifiers of the<br />
effects of a high or low carbohydrate weight loss diet<br />
(Sorensen et al., 2006). Second, findings from two recent<br />
randomized intervention studies suggest that insulin sensitivity<br />
or glucose-induced insulin secretion can modify the<br />
weight loss in response to low-carbohydrate or low-GL diets<br />
(Cornier et al., 2005; Pittas et al., 2005). Larger studies are<br />
needed to test the hypothesis that characteristics related to a<br />
person’s glucose homeostasis may affect the optimal macronutrient<br />
composition for weight management. Finally, the<br />
carbohydrate content of a diet that allows long-term<br />
adherence may to a large extent depend on individual<br />
preferences. For prevention of weight gain, individuals<br />
should be able to maintain a dietary pattern that prevents<br />
excess energy intake for decades and the degree of adherence<br />
to weight loss interventions is a strong predictor of weight<br />
loss (Heshka et al., 2003; Dansinger et al., 2005).<br />
This overview is limited to dietary carbohydrates in<br />
relation to obesity. However, many other factors should be<br />
considered in the design of weight loss interventions. Selfmonitoring<br />
of diet and activity, structural approaches<br />
providing foods, meal replacements or menus and recipes,<br />
increased physical activity, and longer length of treatment<br />
have been shown to contribute to greater weight loss (Perri<br />
et al., 1989; Foster et al., 2005). Although, the achieved<br />
weight loss of long-term interventions may appear small,<br />
B5% loss of body weight as a result of dietary changes and
increased physical activity has been associated with a major<br />
decrease in incidence of type 2 diabetes and other metabolic<br />
disturbances (Tuomilehto et al., 2001; Knowler et al., 2002).<br />
The high prevalence of overweight and obesity indicates that<br />
energy imbalance is a population-wide phenomenon in<br />
many societies across the world. In addition to interventions<br />
aimed at individuals, rigorous changes in the social and<br />
physical environment including the food supply that reduce<br />
stimuli to overeat and facilitate greater physical activity will<br />
be needed to target the epidemic of obesity.<br />
Although more randomized longer-term trials of diet and<br />
body weight have been conducted in recent years, many<br />
caveats exist in the current evidence and further research<br />
efforts to address this topic that is of pivotal importance for<br />
public health is strongly recommended.<br />
Conclusions and recommendations<br />
Carbohydrates are among the macronutrients that provide<br />
energy and can thus contribute to excess energy intake and<br />
subsequent weight gain. If energy intake is strictly controlled,<br />
macronutrient composition of the diet (energy<br />
percentages of fat and carbohydrates) does not substantially<br />
affect body weight or fat mass (Golay et al., 1996). However,<br />
an important issue is whether among free-living individuals,<br />
macronutrient composition of the diet increases the likelihood<br />
of passive over-consumption. There is no clear<br />
evidence that altering the proportion of total carbohydrate<br />
in the diet is an important determinant of energy intake.<br />
However, there is evidence that sugar-sweetened beverages<br />
do not induce satiety to the same extent as solid forms of<br />
carbohydrate and that increases in sugar sweetened soft<br />
drink consumption are associated with weight gain. Thus,<br />
there is a justification for the recommendation to restrict the<br />
use of beverages high in free sugars in order to reduce the risk<br />
of excessive weight gain and to treat obesity. Solid foods high<br />
in free sugars tend to be energy dense, and there is some<br />
evidence from intervention studies that reduction of solid<br />
foods high in free sugars can contribute to weight loss. Thus,<br />
the current recommendation to restrict free sugars to no<br />
more than 10 percent of total energy is consistent with<br />
appropriate diets for the prevention of obesity. A high<br />
content of dietary fiber in whole-grain cereals, vegetables,<br />
legumes and fruits is associated with relatively low energy<br />
density, promotion of satiety, and in observational studies a<br />
lesser degree of weight gain than among those with lower<br />
intakes. Although it is difficult to establish with certainty<br />
that dietary fiber rather than other dietary attributes are<br />
responsible, it is considered appropriate to recommend that<br />
whole grain cereals, vegetables, legumes and fruits are the<br />
most appropriate sources of dietary carbohydrate. The<br />
currently available evidence is considered to be insufficient<br />
to recommend carbohydrate-containing foods likely to<br />
reduce the risk of obesity or promote weight loss on the<br />
basis of their GI.<br />
Carbohydrate intake and obesity<br />
RM van Dam and JC Seidell<br />
Acknowledgements<br />
We thank Dr Ahmad R Dorosty, Dr Cara Ebbeling, Professor<br />
Philip James, Professor Simin Liu, Professor Jim Mann,<br />
Professor Boyd Swinburn, Professor Carolyn Summerbell<br />
and Dr Ricardo Uauy for their valuable comments on the<br />
earlier manuscript.<br />
Conflict of interest<br />
During preparation and peer-review of this paper in 2006, the<br />
authors and peer-reviewers declared the following interests.<br />
Authors<br />
Dr Rob M van Dam: None declared.<br />
Professor Jaap C Seidell: None declared.<br />
Peer-reviewers<br />
Dr Ahmad R Dorosty: None declared.<br />
Dr Cara Ebbeling: None declared.<br />
Professor Philip James: None declared.<br />
Professor Simin Liu: None declared.<br />
Professor Jim Mann: None declared.<br />
Professor Boyd Swinburn: None declared.<br />
Professor Carolyn Summerbell: None declared.<br />
Dr Ricardo Uauy: Scientific Adviser on a temporary basis<br />
for Unilever and Wyeth; Scientific Editorial/Award Adviser<br />
for Danone, DSM, Kelloggs, and Knowles and Bolton on an<br />
ad hoc basis.<br />
References<br />
Alexy U, Sichert-Hellert W, Kersting M (2003). Associations between<br />
intake of added sugars and intakes of nutrients and food groups in<br />
the diets of German children and adolescents. Br J Nutr 90, 441–447.<br />
Anderson JW, Story LJ, Zettwoch NC, Gustafson NJ, Jefferson BS<br />
(1989). Metabolic effects of fructose supplementation in diabetic<br />
individuals. Diabetes Care 12, 337–344.<br />
Anonymous (1968). The National Diet-Heart Study Final Report.<br />
Circulation 37, I1–I428.<br />
Appel LJ, Moore TJ, Obarzanek E, Vollmer WM, Svetkey LP, Sacks FM<br />
et al. (1997). A clinical trial of the effects of dietary patterns on<br />
blood pressure. DASH Collaborative Research Group. N Engl J Med<br />
336, 1117–1124.<br />
Astrup A, Meinert Larsen T, Harper A (2004). Atkins and other lowcarbohydrate<br />
diets: hoax or an effective tool for weight loss?<br />
Lancet 364, 897–899.<br />
Baron JA, Schori A, Crow B, Carter R, Mann JI (1986). A randomized<br />
controlled trial of low carbohydrate and low fat/high fiber diets for<br />
weight loss. Am J Public Health 76, 1293–1296.<br />
Berkey CS, Rockett HR, Field AE, Gillman MW, Colditz GA (2004). Sugaradded<br />
beverages and adolescent weight change. Obes Res 12, 778–788.<br />
Bes-Rastrollo M, Martinez-Gonzalez MA, Sanchez-Villegas A, de la<br />
Fuente Arrillaga C, Martinez JA (2006a). Association of fiber intake<br />
and fruit/vegetable consumption with weight gain in a Mediterranean<br />
population. Nutrition 22, 504–511.<br />
Bes-Rastrollo M, Sanchez-Villegas A, Gomez-Gracia E, Martinez JA,<br />
Pajares RM, Martinez-Gonzalez MA (2006b). Predictors of weight<br />
gain in a Mediterranean cohort: the Seguimiento Universidad de<br />
Navarra Study 1. Am J Clin Nutr 83, 362–370;quiz 394–395.<br />
Birketvedt GS, Shimshi M, Erling T, Florholmen J (2005). Experiences<br />
with three different fiber supplements in weight reduction. Med Sci<br />
Monit 11, PI5–PI8.<br />
S95<br />
European Journal of Clinical Nutrition
S96<br />
Carbohydrate intake and obesity<br />
RM van Dam and JC Seidell<br />
Blaak EE (2004). Basic disturbances in skeletal muscle fatty acid<br />
metabolism in obesity and type 2 diabetes mellitus. Proc Nutr Soc<br />
63, 323–330.<br />
Bouche C, Rizkalla SW, Luo J, Vidal H, Veronese A, Pacher N et al.<br />
(2002). Five-week, low-glycemic index diet decreases total fat mass<br />
and improves plasma lipid profile in moderately overweight<br />
nondiabetic men. Diabetes Care 25, 822–828.<br />
Braam LA, Ocke MC, Bueno-de-Mesquita HB, Seidell JC (1998).<br />
Determinants of obesity-related underreporting of energy intake.<br />
Am J Epidemiol 147, 1081–1086.<br />
Bray GA, Nielsen SJ, Popkin BM (2004a). Consumption of highfructose<br />
corn syrup in beverages may play a role in the epidemic of<br />
obesity. Am J Clin Nutr 79, 537–543.<br />
Bray GA, Paeratakul S, Popkin BM (2004b). Dietary fat and obesity: a<br />
review of animal, clinical and epidemiological studies. Physiol<br />
Behav 83, 549–555.<br />
Brehm BJ, Seeley RJ, Daniels SR, D’Alessio DA (2003). A randomized<br />
trial comparing a very low carbohydrate diet and a calorierestricted<br />
low fat diet on body weight and cardiovascular risk<br />
factors in healthy women. J Clin Endocrinol Metab 88, 1617–1623.<br />
Brinkworth GD, Noakes M, Keogh JB, Luscombe ND, Wittert GA,<br />
Clifton PM (2004a). Long-term effects of a high-protein, lowcarbohydrate<br />
diet on weight control and cardiovascular risk<br />
markers in obese hyperinsulinemic subjects. Int J Obes Relat Metab<br />
Disord 28, 661–670.<br />
Brinkworth GD, Noakes M, Parker B, Foster P, Clifton PM (2004b).<br />
Long-term effects of advice to consume a high-protein, low-fat<br />
diet, rather than a conventional weight-loss diet, in obese adults<br />
with type 2 diabetes: one-year follow-up of a randomised trial.<br />
Diabetologia 47, 1677–1686.<br />
Carels RA, Darby LA, Douglass OM, Cacciapaglia HM, Rydin S (2005).<br />
Education on the glycemic index of foods fails to improve<br />
treatment outcomes in a behavioral weight loss program. Eat<br />
Behav 6, 145–150.<br />
Charlton KE, Kolbe-Alexander TL, Nel JH (2005). Micronutrient<br />
dilution associated with added sugar intake in elderly black South<br />
African women. Eur J Clin Nutr 59, 1030–1042.<br />
Cornier MA, Donahoo WT, Pereira R, Gurevich I, Westergren R,<br />
Enerback S et al. (2005). Insulin sensitivity determines the<br />
effectiveness of dietary macronutrient composition on weight<br />
loss in obese women. Obes Res 13, 703–709.<br />
Dansinger ML, Gleason JA, Griffith JL, Selker HP, Schaefer EJ (2005).<br />
Comparison of the Atkins, Ornish, Weight Watchers, and Zone<br />
diets for weight loss and heart disease risk reduction: a randomized<br />
trial. JAMA 293, 43–53.<br />
Das SK, Gilhooly CH, Golden JK, Pittas AG, Fuss PJ, Cheatham RA<br />
et al. (2007). Long-term effects of 2 energy-restricted diets differing<br />
in glycemic load on dietary adherence, body composition, and<br />
metabolism in CALERIE: a 1-y randomized controlled trial. Am J<br />
Clin Nutr 85, 1023–1030.<br />
de Graaf C, Blom WA, Smeets PA, Stafleu A, Hendriks HF<br />
(2004). Biomarkers of satiation and satiety. Am J Clin Nutr 79,<br />
946–961.<br />
de Lorgeril M, Salen P, Martin JL, Monjaud I, Delaye J, Mamelle N<br />
(1999). Mediterranean diet, traditional risk factors, and the rate of<br />
cardiovascular complications after myocardial infarction: final<br />
report of the Lyon Diet Heart Study. Circulation 99, 779–785.<br />
DiMeglio DP, Mattes RD (2000). Liquid versus solid carbohydrate:<br />
effects on food intake and body weight. Int J Obes Relat Metab<br />
Disord 24, 794–800.<br />
Drewnowski A, Bellisle F (2007). Liquid calories, sugar, and body<br />
weight. Am J Clin Nutr 85, 651–661.<br />
Drewnowski A, Almiron-Roig E, Marmonier C, Lluch A (2004).<br />
Dietary energy density and body weight: is there a relationship?<br />
Nutr Rev 62, 403–413.<br />
Due A, Toubro S, Skov AR, Astrup A (2004). Effect of normal-fat diets,<br />
either medium or high in protein, on body weight in overweight<br />
subjects: a randomised 1-year trial. Int J Obes Relat Metab Disord 28,<br />
1283–1290.<br />
European Journal of Clinical Nutrition<br />
Ebbeling CB, Feldman HA, Osganian SK, Chomitz VR, Ellenbogen SJ,<br />
Ludwig DS (2006). Effects of decreasing sugar-sweetened beverage<br />
consumption on body weight in adolescents: a randomized,<br />
controlled pilot study. Pediatrics 117, 673–680.<br />
Ebbeling CB, Leidig MM, Sinclair KB, Hangen JP, Ludwig DS (2003). A<br />
reduced-glycemic load diet in the treatment of adolescent obesity.<br />
Arch Pediatr Adolesc Med 157, 773–779.<br />
Ebbeling CB, Leidig MM, Sinclair KB, Seger-Shippee LG, Feldman HA,<br />
Ludwig DS (2005). Effects of an ad libitum low-glycemic load diet<br />
on cardiovascular disease risk factors in obese young adults. Am J<br />
Clin Nutr 81, 976–982.<br />
Egger G, Swinburn B (1997). An ‘ecological’ approach to the obesity<br />
pandemic. BMJ 315, 477–480.<br />
Elliott SS, Keim NL, Stern JS, Teff K, Havel PJ (2002). Fructose, weight<br />
gain, and the insulin resistance syndrome. Am J Clin Nutr 76, 911–922.<br />
Ello-Martin JA, Ledikwe JH, Rolls BJ (2005). The influence of food<br />
portion size and energy density on energy intake: implications for<br />
weight management. Am J Clin Nutr 82, 236S–241S.<br />
Esposito K, Marfella R, Ciotola M, Di Palo C, Giugliano F, Giugliano<br />
G et al. (2004). Effect of a mediterranean-style diet on endothelial<br />
dysfunction and markers of vascular inflammation in the metabolic<br />
syndrome: a randomized trial. JAMA 292, 1440–1446.<br />
Foster GD, Makris AP, Bailer BA (2005). Behavioral treatment of<br />
obesity. Am J Clin Nutr 82, 230S–235S.<br />
Foster GD, Wyatt HR, Hill JO, McGuckin BG, Brill C, Mohammed BS<br />
et al. (2003). A randomized trial of a low-carbohydrate diet for<br />
obesity. N Engl J Med 348, 2082–2090.<br />
Foster-Powell K, Holt SH, Brand-Miller JC (2002). International table<br />
of glycemic index and glycemic load values: 2002. Am J Clin Nutr<br />
76, 5–56.<br />
Franks PW, Luan J, Browne PO, Harding AH, O’Rahilly S, Chatterjee<br />
VK et al. (2004). Does peroxisome proliferator-activated receptor<br />
gamma genotype (Pro12ala) modify the association of physical<br />
activity and dietary fat with fasting insulin level? Metabolism 53,<br />
11–16.<br />
Gardner CD, Kiazand A, Alhassan S, Kim S, Stafford RS, Balise RR et al.<br />
(2007). Comparison of the Atkins, Zone, Ornish, and LEARN diets<br />
for change in weight and related risk factors among overweight<br />
premenopausal women: the A TO Z Weight Loss Study: a<br />
randomized trial. JAMA 297, 969–977.<br />
Gatenby SJ, Aaron JI, Jack VA, Mela DJ (1997). Extended use of foods<br />
modified in fat and sugar content: nutritional implications in a<br />
free-living female population. Am J Clin Nutr 65, 1867–1873.<br />
Golay A, Allaz AF, Morel Y, de Tonnac N, Tankova S, Reaven G (1996).<br />
Similar weight loss with low- or high-carbohydrate diets. Am J Clin<br />
Nutr 63, 174–178.<br />
Halton TL, Hu FB (2004). The effects of high protein diets on<br />
thermogenesis, satiety and weight loss: a critical review. J Am Coll<br />
Nutr 23, 373–385.<br />
Harvey-Berino J (1998). The efficacy of dietary fat vs total energy<br />
restriction for weight loss. Obes Res 6, 202–207.<br />
He K, Hu FB, Colditz GA, Manson JE, Willett WC, Liu S (2004).<br />
Changes in intake of fruits and vegetables in relation to risk of<br />
obesity and weight gain among middle-aged women. Int J Obes<br />
Relat Metab Disord 28, 1569–1574.<br />
Heerstrass DW, Ocke MC, Bueno-de-Mesquita HB, Peeters PH, Seidell<br />
JC (1998). Underreporting of energy, protein and potassium intake<br />
in relation to body mass index. Int J Epidemiol 27, 186–193.<br />
Heitmann BL, Lissner L (1995). Dietary underreporting by obese<br />
individuals—is it specific or non-specific? BMJ 311, 986–989.<br />
Heshka S, Anderson JW, Atkinson RL, Greenway FL, Hill JO, Phinney<br />
SD et al. (2003). Weight loss with self-help compared with a<br />
structured commercial program: a randomized trial. JAMA 289,<br />
1792–1798.<br />
Hirsch J, Hudgins LC, Leibel RL, Rosenbaum M (1998). Diet<br />
composition and energy balance in humans. Am J Clin Nutr 67,<br />
551S–555S.<br />
Hoag S, Marshall JA, Jones RH, Hamman RF (1995). High fasting<br />
insulin levels associated with lower rates of weight gain in persons
with normal glucose tolerance: the San Luis Valley Diabetes Study.<br />
Int J Obes Relat Metab Disord 19, 175–180.<br />
Howard BV, Manson JE, Stefanick ML, Beresford SA, Frank G, Jones B<br />
et al. (2006). Low-fat dietary pattern and weight change over 7<br />
years: the Women’s Health Initiative Dietary Modification Trial.<br />
JAMA 295, 39–49.<br />
Iqbal SI, Helge JW, Heitmann BL (2006). Do energy density and<br />
dietary fiber influence subsequent 5-year weight changes in adult<br />
men and women? Obesity (Silver Spring) 14, 106–114.<br />
Jacobs Jr DR, Gallaher DD (2004). Whole grain intake and<br />
cardiovascular disease: a review. Curr Atheroscler Rep 6, 415–423.<br />
James J, Thomas P, Cavan D, Kerr D (2004). Preventing childhood<br />
obesity by reducing consumption of carbonated drinks: cluster<br />
randomised controlled trial. BMJ 328, 1237.<br />
Jeffery RW, Hellerstedt WL, French SA, Baxter JE (1995). A<br />
randomized trial of counseling for fat restriction versus calorie<br />
restriction in the treatment of obesity. Int J Obes Relat Metab Disord<br />
19, 132–137.<br />
Kendall A, Levitsky DA, Strupp BJ, Lissner L (1991). Weight loss on a<br />
low-fat diet: consequence of the imprecision of the control of food<br />
intake in humans. Am J Clin Nutr 53, 1124–1129.<br />
Klein S, Wadden T, Sugerman HJ (2002). AGA technical review on<br />
obesity. Gastroenterology 123, 882–932.<br />
Knowler WC, Barrett-Connor E, Fowler SE, Hamman RF, Lachin JM,<br />
Walker EA et al. (2002). Reduction in the incidence of type 2<br />
diabetes with lifestyle intervention or metformin. N Engl J Med<br />
346, 393–403.<br />
Koh-Banerjee P, Franz M, Sampson L, Liu S, Jacobs Jr DR, Spiegelman<br />
D et al. (2004). Changes in whole-grain, bran, and cereal fiber<br />
consumption in relation to 8-y weight gain among men. Am J Clin<br />
Nutr 80, 1237–1245.<br />
Kranz S, Smiciklas-Wright H, Siega-Riz AM, Mitchell D (2005).<br />
Adverse effect of high added sugar consumption on dietary intake<br />
in American preschoolers. J Pediatr 146, 105–111.<br />
Lean ME, Han TS, Prvan T, Richmond PR, Avenell A (1997). Weight<br />
loss with high and low carbohydrate 1200 kcal diets in free living<br />
women. Eur J Clin Nutr 51, 243–248.<br />
Ledikwe JH, Blanck HM, Kettel Khan L, Serdula MK, Seymour JD,<br />
Tohill BC et al. (2006). Dietary energy density is associated with<br />
energy intake and weight status in US adults. Am J Clin Nutr 83,<br />
1362–1368.<br />
Liljeberg HG, Akerberg AK, Bjorck IM (1999). Effect of the glycemic<br />
index and content of indigestible carbohydrates of cereal-based<br />
breakfast meals on glucose tolerance at lunch in healthy subjects.<br />
Am J Clin Nutr 69, 647–655.<br />
Lindi VI, Uusitupa MI, Lindstrom J, Louheranta A, Eriksson JG, Valle<br />
TT et al. (2002). Association of the Pro12Ala polymorphism in the<br />
PPAR-gamma2 gene with 3-year incidence of type 2 diabetes and<br />
body weight change in the Finnish Diabetes Prevention Study.<br />
Diabetes 51, 2581–2586.<br />
Liu S, Willett WC, Manson JE, Hu FB, Rosner B, Colditz G (2003).<br />
Relation between changes in intakes of dietary fiber and grain<br />
products and changes in weight and development of obesity<br />
among middle-aged women. Am J Clin Nutr 78, 920–927.<br />
Ludwig DS (2002). The glycemic index: physiological mechanisms<br />
relating to obesity, diabetes, and cardiovascular disease. JAMA 287,<br />
2414–2423.<br />
Ludwig DS, Pereira MA, Kroenke CH, Hilner JE, Van Horn L, Slattery<br />
ML et al. (1999). Dietary fiber, weight gain, and cardiovascular<br />
disease risk factors in young adults. JAMA 282, 1539–1546.<br />
Ma Y, Olendzki B, Chiriboga D, Hebert JR, Li Y, Li W et al. (2005).<br />
Association between dietary carbohydrates and body weight. Am J<br />
Epidemiol 161, 359–367.<br />
Maki KC, Rains TM, Kaden VN, Raneri KR, Davidson MH (2007).<br />
Effects of a reduced-glycemic-load diet on body weight, body<br />
composition, and cardiovascular disease risk markers in overweight<br />
and obese adults. Am J Clin Nutr 85, 724–734.<br />
Malik VS, Schulze MB, Hu FB (2006). Intake of sugar-sweetened beverages<br />
and weight gain: a systematic review. Am J Clin Nutr 84, 274–288.<br />
Carbohydrate intake and obesity<br />
RM van Dam and JC Seidell<br />
Mann JI, Hendricks DA, Truswell AS, Manning E (1970). Effects on<br />
serum-lipids in normal men of reducing dietary sucrose or starch<br />
for five months. Lancet 1, 870–872.<br />
Mattes RD (1996). Dietary compensation by humans for supplemental<br />
energy provided as ethanol or carbohydrate in fluids.<br />
Physiol Behav 59, 179–187.<br />
Mayer-Davis EJ, Sparks KC, Hirst K, Costacou T, Lovejoy JC,<br />
Regensteiner JG et al. (2004). Dietary intake in the diabetes<br />
prevention program cohort: baseline and 1-year post randomization.<br />
Ann Epidemiol 14, 763–772.<br />
McAuley KA, Hopkins CM, Smith KJ, McLay RT, Williams SM, Taylor<br />
RW et al. (2005). Comparison of high-fat and high-protein diets<br />
with a high-carbohydrate diet in insulin-resistant obese women.<br />
Diabetologia 48, 8–16.<br />
McAuley KA, Smith KJ, Taylor RW, McLay RT, Williams SM, Mann JI<br />
(2006). Long-term effects of popular dietary approaches on weight<br />
loss and features of insulin resistance. Int J Obes (London) 30,<br />
342–349.<br />
McManus K, Antinoro L, Sacks F (2001). A randomized controlled<br />
trial of a moderate-fat, low-energy diet compared with a low fat,<br />
low-energy diet for weight loss in overweight adults. Int J Obes<br />
Relat Metab Disord 25, 1503–1511.<br />
McMillan-Price J, Brand-Miller J (2006). Low-glycaemic index diets<br />
and body weight regulation. Int J Obes (London) 30 (Suppl 3),<br />
S40–S46.<br />
McMillan-Price J, Petocz P, Atkinson F, O’Neill K, Samman S,<br />
Steinbeck K et al. (2006). Comparison of 4 diets of varying<br />
glycemic load on weight loss and cardiovascular risk reduction in<br />
overweight and obese young adults: a randomized controlled trial.<br />
Arch Intern Med 166, 1466–1475.<br />
Melanson KJ, Westerterp-Plantenga MS, Saris WH, Smith FJ,<br />
Campfield LA (1999). Blood glucose patterns and appetite in<br />
time-blinded humans: carbohydrate versus fat. Am J Physiol 277,<br />
R337–R345.<br />
Memisoglu A, Hu FB, Hankinson SE, Manson JE, De Vivo I, Willett<br />
WC et al. (2003). Interaction between a peroxisome proliferatoractivated<br />
receptor gamma gene polymorphism and dietary fat<br />
intake in relation to body mass. Hum Mol Genet 12, 2923–2929.<br />
Nordmann AJ, Nordmann A, Briel M, Keller U, Yancy Jr WS, Brehm BJ<br />
et al. (2006). Effects of low-carbohydrate vs low-fat diets on weight<br />
loss and cardiovascular risk factors: a meta-analysis of randomized<br />
controlled trials. Arch Intern Med 166, 285–293.<br />
Ogden CL, Carroll MD, Curtin LR, McDowell MA, Tabak CJ, Flegal<br />
KM (2006). Prevalence of overweight and obesity in the United<br />
States, 1999–2004. JAMA 295, 1549–1555.<br />
Pascale RW, Wing RR, Butler BA, Mullen M, Bononi P (1995). Effects<br />
of a behavioral weight loss program stressing calorie restriction<br />
versus calorie plus fat restriction in obese individuals with NIDDM<br />
or a family history of diabetes. Diabetes Care 18, 1241–1248.<br />
Pasman WJ, Westerterp-Plantenga MS, Muls E, Vansant G, van Ree J,<br />
Saris WH (1997). The effectiveness of long-term fibre supplementation<br />
on weight maintenance in weight-reduced women. Int J<br />
Obes Relat Metab Disord 21, 548–555.<br />
Pereira MA, Swain J, Goldfine AB, Rifai N, Ludwig DS (2004). Effects<br />
of a low-glycemic load diet on resting energy expenditure<br />
and heart disease risk factors during weight loss. JAMA 292,<br />
2482–2490.<br />
Perri MG, Nezu AM, Patti ET, McCann KL (1989). Effect of length of<br />
treatment on weight loss. J Consult Clin Psychol 57, 450–452.<br />
Phelan S, Wyatt HR, Hill JO, Wing RR (2006). Are the eating and<br />
exercise habits of successful weight losers changing? Obesity (Silver<br />
Spring) 14, 710–716.<br />
Pittas AG, Das SK, Hajduk CL, Golden J, Saltzman E, Stark PC et al.<br />
(2005). A low-glycemic load diet facilitates greater weight loss in<br />
overweight adults with high insulin secretion but not in overweight<br />
adults with low insulin secretion in the CALERIE Trial.<br />
Diabetes Care 28, 2939–2941.<br />
Pittler MH, Ernst E (2001). Guar gum for body weight reduction:<br />
meta-analysis of randomized trials. Am J Med 110, 724–730.<br />
S97<br />
European Journal of Clinical Nutrition
S98<br />
Carbohydrate intake and obesity<br />
RM van Dam and JC Seidell<br />
Popkin BM, Gordon-Larsen P (2004). The nutrition transition:<br />
worldwide obesity dynamics and their determinants. Int J Obes<br />
Relat Metab Disord 28 (Suppl 3), S2–S9.<br />
Poppitt SD, Prentice AM (1996). Energy density and its role in the<br />
control of food intake: evidence from metabolic and community<br />
studies. Appetite 26, 153–174.<br />
Poppitt SD, Keogh GF, Prentice AM, Williams DE, Sonnemans HM,<br />
Valk EE et al. (2002). Long-term effects of ad libitum low-fat, highcarbohydrate<br />
diets on body weight and serum lipids in overweight<br />
subjects with metabolic syndrome. Am J Clin Nutr 75, 11–20.<br />
Prentice AM, Jebb SA (2003). Fast foods, energy density and obesity: a<br />
possible mechanistic link. Obes Rev 4, 187–194.<br />
Raatz SK, Torkelson CJ, Redmon JB, Reck KP, Kwong CA, Swanson JE<br />
et al. (2005). Reduced glycemic index and glycemic load diets<br />
do not increase the effects of energy restriction on weight loss<br />
and insulin sensitivity in obese men and women. J Nutr 135,<br />
2387–2391.<br />
Raben A (2002). Should obese patients be counselled to follow a lowglycaemic<br />
index diet? No. Obes Rev 3, 245–256.<br />
Raben A, Macdonald I, Astrup A (1997). Replacement of dietary fat by<br />
sucrose or starch: effects on 14 d ad libitum energy intake, energy<br />
expenditure and body weight in formerly obese and never-obese<br />
subjects. Int J Obes Relat Metab Disord 21, 846–859.<br />
Raben A, Vasilaras TH, Moller AC, Astrup A (2002). Sucrose compared<br />
with artificial sweeteners: different effects on ad libitum food<br />
intake and body weight after 10 wk of supplementation in<br />
overweight subjects. Am J Clin Nutr 76, 721–729.<br />
Rigaud D, Ryttig KR, Angel LA, Apfelbaum M (1990). Overweight<br />
treated with energy restriction and a dietary fibre supplement: a<br />
6-month randomized, double-blind, placebo-controlled trial. Int J<br />
Obes 14, 763–769.<br />
Rolls BJ, Bell EA, Thorwart ML (1999). Water incorporated into a food<br />
but not served with a food decreases energy intake in lean women.<br />
Am J Clin Nutr 70, 448–455.<br />
Rolls BJ, Ello-Martin JA, Tohill BC (2004). What can intervention<br />
studies tell us about the relationship between fruit and vegetable<br />
consumption and weight management? Nutr Rev 62, 1–17.<br />
Rolls BJ, Roe LS, Beach AM, Kris-Etherton PM (2005). Provision of<br />
foods differing in energy density affects long-term weight loss.<br />
Obes Res 13, 1052–1060.<br />
Rossner S, von Zweigbergk D, Ohlin A, Ryttig K (1987). Weight<br />
reduction with dietary fibre supplements. Results of two doubleblind<br />
randomized studies.. Acta Med Scand 222, 83–88.<br />
Ruxton CH (2003). Dietary guidelines for sugar: the need for<br />
evidence. Br J Nutr 90, 245–247.<br />
Ryttig KR, Tellnes G, Haegh L, Boe E, Fagerthun H (1989). A dietary<br />
fibre supplement and weight maintenance after weight reduction:<br />
a randomized, double-blind, placebo-controlled long-term trial.<br />
Int J Obes 13, 165–171.<br />
Samaha FF, Iqbal N, Seshadri P, Chicano KL, Daily DA, McGrory J<br />
et al. (2003). A low-carbohydrate as compared with a low-fat diet<br />
in severe obesity. N Engl J Med 348, 2074–2081.<br />
Saris WH, Astrup A, Prentice AM, Zunft HJ, Formiguera X, Verboeketvan<br />
de Venne WP et al. (2000). Randomized controlled trial of<br />
changes in dietary carbohydrate/fat ratio and simple vs complex<br />
carbohydrates on body weight and blood lipids: the CARMEN<br />
study. The Carbohydrate Ratio Management in European National<br />
diets. Int J Obes Relat Metab Disord 24, 1310–1318.<br />
Schulze MB, Manson JE, Ludwig DS, Colditz GA, Stampfer MJ, Willett<br />
WC et al. (2004). Sugar-sweetened beverages, weight gain, and<br />
incidence of type 2 diabetes in young and middle-aged women.<br />
JAMA 292, 927–934.<br />
Schwartz MW, Porte Jr D (2005). Diabetes, obesity, and the brain.<br />
Science 307, 375–379.<br />
Schwartz MW, Boyko EJ, Kahn SE, Ravussin E, Bogardus C (1995).<br />
Reduced insulin secretion: an independent predictor of body<br />
weight gain. J Clin Endocrinol Metab 80, 1571–1576.<br />
Seidell JC (1998). Dietary fat and obesity: an epidemiologic<br />
perspective. Am J Clin Nutr 67, 546S–550S.<br />
European Journal of Clinical Nutrition<br />
Skov AR, Toubro S, Ronn B, Holm L, Astrup A (1999). Randomized<br />
trial on protein vs carbohydrate in ad libitum fat reduced diet for<br />
the treatment of obesity. Int J Obes Relat Metab Disord 23, 528–536.<br />
Slabber M, Barnard HC, Kuyl JM, Dannhauser A, Schall R (1994).<br />
Effects of a low-insulin-response, energy-restricted diet on weight<br />
loss and plasma insulin concentrations in hyperinsulinemic obese<br />
females. Am J Clin Nutr 60, 48–53.<br />
Slavin JL (2005). Dietary fiber and body weight. Nutrition 21,<br />
411–418.<br />
Sloth B, Krog-Mikkelsen I, Flint A, Tetens I, Bjorck I, Vinoy S et al.<br />
(2004). No difference in body weight decrease between a lowglycemic-index<br />
and a high-glycemic-index diet but reduced LDL<br />
cholesterol after 10-wk ad libitum intake of the low-glycemic-index<br />
diet. Am J Clin Nutr 80, 337–347.<br />
Smith JB, Niven BE, Mann JI (1996). The effect of reduced extrinsic<br />
sucrose intake on plasma triglyceride levels. Eur J Clin Nutr 50,<br />
498–504.<br />
Smith-Warner SA, Elmer PJ, Tharp TM, Fosdick L, Randall B, Gross M<br />
et al. (2000). Increasing vegetable and fruit intake: randomized<br />
intervention and monitoring in an at-risk population. Cancer<br />
Epidemiol Biomarkers Prev 9, 307–317.<br />
Sorensen TI, Boutin P, Taylor MA, Larsen LH, Verdich C, Petersen L<br />
et al. (2006). Genetic polymorphisms and weight loss in obesity: a<br />
randomised trial of hypo-energetic high- versus low-fat diets. PLoS<br />
Clin Trials 1, e12.<br />
Spieth LE, Harnish JD, Lenders CM, Raezer LB, Pereira MA, Hangen SJ<br />
et al. (2000). A low-glycemic index diet in the treatment of<br />
pediatric obesity. Arch Pediatr Adolesc Med 154, 947–951.<br />
Stern L, Iqbal N, Seshadri P, Chicano KL, Daily DA, McGrory J et al.<br />
(2004). The effects of low-carbohydrate versus conventional<br />
weight loss diets in severely obese adults: one-year follow-up of<br />
a randomized trial. Ann Intern Med 140, 778–785.<br />
Stookey JD (2001). Energy density, energy intake and weight status in<br />
a large free-living sample of Chinese adults: exploring the<br />
underlying roles of fat, protein, carbohydrate, fiber and water<br />
intakes. Eur J Clin Nutr 55, 349–359.<br />
Stubbs RJ, Whybrow S (2004). Energy density, diet composition and<br />
palatability: influences on overall food energy intake in humans.<br />
Physiol Behav 81, 755–764.<br />
Stubbs RJ, Johnstone AM, O’Reilly LM, Barton K, Reid C (1998). The<br />
effect of covertly manipulating the energy density of mixed diets<br />
on ad libitum food intake in ‘pseudo free-living’ humans. Int J Obes<br />
Relat Metab Disord 22, 980–987.<br />
Teff KL, Elliott SS, Tschop M, Kieffer TJ, Rader D, Heiman M et al.<br />
(2004). Dietary fructose reduces circulating insulin and leptin,<br />
attenuates postprandial suppression of ghrelin, and increases<br />
triglycerides in women. J Clin Endocrinol Metab 89, 2963–2972.<br />
Thompson WG, Rostad Holdman N, Janzow DJ, Slezak JM, Morris<br />
KL, Zemel MB (2005). Effect of energy-reduced diets high in dairy<br />
products and fiber on weight loss in obese adults. Obes Res 13,<br />
1344–1353.<br />
Tordoff MG, Alleva AM (1990). Effect of drinking soda sweetened<br />
with aspartame or high-fructose corn syrup on food intake and<br />
body weight. Am J Clin Nutr 51, 963–969.<br />
Toubro S, Astrup A (1997). Randomised comparison of diets for<br />
maintaining obese subjects’ weight after major weight loss: ad lib,<br />
low fat, high carbohydrate diet v fixed energy intake. BMJ 314, 29–34.<br />
Tsihlias EB, Gibbs AL, McBurney MI, Wolever TM (2000). Comparison<br />
of high- and low-glycemic-index breakfast cereals with<br />
monounsaturated fat in the long-term dietary management of<br />
type 2 diabetes. Am J Clin Nutr 72, 439–449.<br />
Tuomilehto J, Lindstrom J, Eriksson JG, Valle TT, Hamalainen H,<br />
Ilanne-Parikka P et al. (2001). Prevention of type 2 diabetes<br />
mellitus by changes in lifestyle among subjects with impaired<br />
glucose tolerance. N Engl J Med 344, 1343–1350.<br />
Valdez R, Mitchell BD, Haffner SM, Hazuda HP, Morales PA,<br />
Monterrosa A et al. (1994). Predictors of weight change in a biethnic<br />
population. The San Antonio Heart Study. Int J Obes Relat<br />
Metab Disord 18, 85–91.
Westerterp KR, Verboeket-van de Venne WP, Westerterp-Plantenga<br />
MS, Velthuis-te Wierik EJ, de Graaf C, Weststrate JA (1996). Dietary<br />
fat and body fat: an intervention study. Int J Obes Relat Metab<br />
Disord 20, 1022–1026.<br />
Weststrate JA, van het Hof KH, van den Berg H, Velthuis-te-Wierik EJ, de<br />
Graaf C, Zimmermanns NJ et al. (1998). A comparison of the effect of<br />
free access to reduced fat products or their full fat equivalents on<br />
food intake, body weight, blood lipids and fat-soluble antioxidants<br />
levels and haemostasis variables. Eur J Clin Nutr 52, 389–395.<br />
Willett WC (2002). Dietary fat plays a major role in obesity: no. Obes<br />
Rev 3, 59–68.<br />
Willett WC, Dietz WH, Colditz GA (1999). Guidelines for healthy<br />
weight. N Engl J Med 341, 427–434.<br />
Wolever TM (2006). Physiological mechanisms and observed health<br />
impacts related to the glycaemic index: some observations. Int J<br />
Obes (London) 30 (Suppl 3), S72–S78.<br />
Carbohydrate intake and obesity<br />
RM van Dam and JC Seidell<br />
Wolever TM, Mehling C (2003). Long-term effect of varying the<br />
source or amount of dietary carbohydrate on postprandial plasma<br />
glucose, insulin, triacylglycerol, and free fatty acid concentrations<br />
in subjects with impaired glucose tolerance. Am J Clin Nutr 77,<br />
612–621.<br />
Wolever TM, Bentum-Williams A, Jenkins DJ (1995). Physiological<br />
modulation of plasma free fatty acid concentrations by diet.<br />
Metabolic implications in nondiabetic subjects. Diabetes Care 18,<br />
962–970.<br />
Yancy Jr WS, Olsen MK, Guyton JR, Bakst RP, Westman EC (2004). A<br />
low-carbohydrate, ketogenic diet versus a low-fat diet to treat<br />
obesity and hyperlipidemia: a randomized, controlled trial. Ann<br />
Intern Med 140, 769–777.<br />
Yeomans MR, Weinberg L, James S (2005). Effects of palatability and<br />
learned satiety on energy density influences on breakfast intake in<br />
humans. Physiol Behav 86, 487–499.<br />
S99<br />
European Journal of Clinical Nutrition
REVIEW<br />
Dietary carbohydrate: relationship to cardiovascular<br />
disease and disorders of carbohydrate metabolism<br />
J Mann<br />
European Journal of Clinical Nutrition (2007) 61 (Suppl 1), S100–S111<br />
& 2007 Nature Publishing Group All rights reserved 0954-3007/07 $30.00<br />
www.nature.com/ejcn<br />
Department of Human Nutrition, Edgar National Centre for Diabetes Research, University of Otago, Dunedin, New Zealand<br />
The nature of carbohydrate is of considerable importance when recommending diets intended to reduce the risk of type II<br />
diabetes and cardiovascular disease and in the treatment of patients who already have established diseases. Intact fruits,<br />
vegetables, legumes and wholegrains are the most appropriate sources of carbohydrate. Most are rich in nonstarch<br />
polysaccharides (NSPs) (dietary fibre) and other potentially cardioprotective components. Many of these foods, especially those<br />
that are high in dietary fibre, will reduce total and low-density lipoprotein cholesterol and help to improve glycaemic control in<br />
those with diabetes. There is no good long-term evidence of benefit when NSPs or other components of wholegrains, fruits,<br />
vegetables and legumes are added to functional and manufactured foods. Frequent consumption of low glycaemic index foods<br />
has been reported to confer similar benefits, but it is not clear whether such benefits are independent of the dietary fibre content<br />
of these foods or the fact that low glycaemic index foods tend to have intact plant cell walls. Furthermore, it is uncertain whether<br />
functional and manufactured foods with a low glycaemic index confer the same long-term benefits as low glycaemic index<br />
plant-based foods. A wide range of carbohydrate intake is acceptable, provided the nature of carbohydrate is appropriate.<br />
Failure to emphasize the need for carbohydrate to be derived principally from wholegrain cereals, fruits, vegetables and legumes<br />
may result in increased lipoprotein-mediated risk of cardiovascular disease, especially in overweight and obese individuals who<br />
are insulin resistant.<br />
European Journal of Clinical Nutrition (2007) 61 (Suppl 1), S100–S111; doi:10.1038/sj.ejcn.1602940<br />
Keywords: cardiovascular disease; impaired carbohydrate metabolism<br />
Dietary carbohydrate and cardiovascular disease<br />
Traditional dietary patterns, which are high in carbohydrate,<br />
are associated with low rates of coronary heart disease<br />
(CHD). This appears to be the case regardless of the<br />
carbohydrate containing primary staple, for example rice in<br />
most Asian countries and a range of cereals, root crops and<br />
pulses in different parts of Africa. However, cross-cultural<br />
comparisons provide no indication as to whether the<br />
percentage of energy intake derived from total carbohydrate<br />
intake, total quantity of carbohydrate, particular classes of<br />
carbohydrate and other nutrients, which are found in<br />
carbohydrate-containing foods or method of food preparation,<br />
account for the cardioprotection afforded by such<br />
traditional carbohydrate-containing diets. Furthermore, it is<br />
possible that cardiovascular risk is reduced simply because<br />
Correspondence: Professor J Mann, Department of Human Nutrition, Edgar<br />
National Centre for Diabetes Research, University of Otago, Dunedin, New<br />
Zealand.<br />
E-mail: jim.mann@stonebow.otago.ac.nz<br />
traditional high carbohydrate diets are low in fat, especially<br />
saturated fat, or because they promote satiety and thus<br />
protect against overweight and obesity. Indeed, it is<br />
conceivable that high carbohydrate diets simply act as a<br />
marker for some other protective factor. Prospective epidemiological<br />
studies and a range of experimental approaches<br />
examining the effects of carbohydrates on cardiovascular risk<br />
factors have attempted to clarify the role of total carbohydrate<br />
and carbohydrate classes (sugars, oligosaccharides<br />
and polysaccharides) and subgroups (for example starch,<br />
nonstarch polysaccharide (NSP)) in CHD and stroke.<br />
Prospective epidemiological studies<br />
Several limitations are common to all prospective studies<br />
examining the relationship between foods and nutrients and<br />
disease risk. However, there are issues that are of particular<br />
relevance when considering the role of carbohydrates. The<br />
lack of consistency in the methods used for the measurement<br />
of different classes and subgroups of carbohydrate,
especially the NSP, complicates comparisons between the<br />
results of studies and their extrapolation into nutritional<br />
recommendations. The term ‘dietary fibre’ is often incorrectly<br />
regarded as being synonymous with NSP. However, in<br />
this paper, the terms will be used as they occur in the<br />
relevant literature, dietary fibre having been measured and<br />
reported in most of the epidemiological studies and much of<br />
the experimental research. In some countries, total carbohydrate<br />
is measured ‘by difference’, after water fat, protein<br />
and ash have all been measured. This is a less reliable<br />
measure than that derived from adding the various classes of<br />
carbohydrate measured individually (see accompanying<br />
papers on ‘definition’ and ‘measurement’).<br />
Of equal, or arguably greater, importance is the extent to<br />
which sources of dietary carbohydrate have changed over<br />
time or differ throughout the world. In some developing<br />
countries, a high proportion of total sugars may be derived<br />
from intact fruits and vegetables. The same may have been<br />
true in the past for societies that are now relatively affluent.<br />
However, nowadays, in most countries, sucrose, high<br />
fructose corn syrup and other free sugars contribute a<br />
substantial proportion of total sugars. Foods rich in free<br />
sugars are usually energy dense and are often poor sources of<br />
essential micronutrients (Baghurst et al., 1991), and are thus<br />
likely to be associated with different physiological effects<br />
and clinical consequences when compared with fruits and<br />
vegetables. Thus, knowledge of total sugar content provides<br />
little information relating to physiology. Similarly, until<br />
relatively recently, dietary fibre was likely to be derived<br />
principally from minimally processed cereals, vegetables,<br />
fruits, legumes and ‘wholegrain’ cereal foods likely to<br />
contain at least a reasonable proportion of intact or lightly<br />
processed grains. Now, dietary fibre is often an added<br />
ingredient and the definition of ‘wholegrain’ permits foods<br />
to be described as such if they contain the constituents of the<br />
grain without requiring the structure to be intact. Again,<br />
the physiological effects of dietary fibre, when derived from<br />
intact fruits, vegetables and grains, may differ from that<br />
added to manufactured products. Thus, it may not be<br />
appropriate to extrapolate the findings of epidemiological<br />
studies involving the consumption of conventional foods to<br />
carbohydrate-containing manufactured and functional<br />
foods, which provide a substantial proportion of total energy<br />
in most affluent and many developing counties.<br />
Early prospective studies reporting the cardioprotective<br />
effect of total carbohydrate intakes and intake of dietary fibre<br />
were published in the 1970s and early 1980s (Morris et al.,<br />
1977; Garcia-Palmieri et al., 1980; McGee et al., 1984). They<br />
were relatively underpowered and confounding of results by<br />
a range of factors certainly could not be excluded. During the<br />
past 20 years, results have been published from a substantial<br />
number of prospective studies involving cohorts of sufficient<br />
size to enable examination of potentially confounding<br />
factors. There has been particular emphasis on the cardioprotective<br />
role of cereal grains and dietary fibre. Most studies<br />
define wholegrain as either intact or milled grain with bran,<br />
Cardiovascular disease and diabetes<br />
J Mann<br />
germ and endosperm in the same proportion as the unmilled<br />
grain. Wholegrain foods have generally been arbitrarily<br />
defined as those foods with more than 25% wholegrain or<br />
bran content by weight (Flight and Clifton, 2006). The<br />
studies have been systematically reviewed (for example Liu,<br />
2002; Truswell, 2002; Hu, 2003; Slavin, 2003; Flight and<br />
Clifton, 2006) and meta-analysed (Anderson, 2002, 2003).<br />
Despite the use of different instruments for assessing dietary<br />
intake, the results of the studies show a remarkably<br />
consistent trend. Meta-analysis, involving four of the largest<br />
published studies, suggested a 28% reduction in risk of CHD<br />
when comparing individuals in the highest and lowest<br />
quintiles of intake of wholegrains (relative risk 0.72, 95%<br />
confidence intervals: 0.48, 0.94) (Anderson 2003). The size of<br />
the most recent cohort studies has enabled analyses to<br />
examine the extent to which these findings might be<br />
confounded by other cardioprotective factors. While residual<br />
confounding cannot be excluded with absolute certainty,<br />
such analyses provide reasonable evidence that wholegrains<br />
protect against CHD regardless of the degree of adiposity and<br />
other measured variables associated with healthy lifestyles<br />
and eating habits. However, it is acknowledged that people<br />
who consistently eat wholegrain breads do indeed have<br />
different lifestyles from those who do not, and it may not be<br />
possible in epidemiological studies to measure all attributes<br />
of lifestyle.<br />
The possibility that an association is truly causal is<br />
strengthened by the existence of a dose response effect.<br />
Such an effect has been demonstrated in the Iowa Women’s<br />
Health Study. After adjustment for cardiovascular risk<br />
factors, relative risks for cardiovascular disease were 1.0,<br />
0.96, 0.71, 0.64 and 0.70 in ascending quintiles of wholegrain<br />
intake, P for trend ¼ 0.02 (Jacobs et al., 1998). However,<br />
the epidemiological studies do not provide an indication of<br />
whether all grains are equal in this respect. There is no clear<br />
evidence as to which constituent of the grain provides<br />
cardioprotection or as to whether the structure of the grain<br />
needs to be wholly or partially intact.<br />
Relatively few groups have examined the extent to which<br />
wholegrain intakes influence the risk of stroke. Reporting on<br />
the largest of the prospective studies, the Nurses’ Health<br />
Study, Liu et al. (2000a) observed risk reductions of<br />
magnitude similar to those observed for CHD (relative risk<br />
0.69, 95% confidence intervals: 0.50, 0.98 when comparing<br />
highest relative to lowest quintile of intake of wholegrains).<br />
Similar risk reductions have been observed in three other<br />
somewhat smaller cohorts.<br />
Wholegrains differ in a number of respects from highly<br />
refined cereals, and several of the constituents may explain<br />
their cardioprotective effects (Table 1). Dietary fibre has been<br />
studied more than the other constituents. Several groups of<br />
researchers have pooled the results from a number of studies.<br />
For example, Pereira et al. (2004) reported a relative risk of<br />
0.90 (95% confidence intervals: 0.77, 1.07 that is not<br />
statistically significant) for total CHD events for each<br />
10 g/day increase in cereal fibre. When considering CHD<br />
S101<br />
European Journal of Clinical Nutrition
S102<br />
Cardiovascular disease and diabetes<br />
J Mann<br />
Table 1 Constituents of wholegrains which may confer cardioprotection<br />
deaths, the relative risk, 0.75 (95% confidence intervals:<br />
0.63, 0.91) was statistically significant, the association being<br />
independent of a number of dietary factors and other<br />
cardiovascular risk factors.<br />
However, other analyses suggest that while cereal fibre is<br />
inversely associated with CHD rates, the relationship is not<br />
as strong as the inverse relationship between CHD and<br />
wholegrain bread (Anderson et al., 2000). Furthermore, the<br />
effect of dietary fibre may be largely explained by fibre<br />
derived from wholewheat, rye or pumpernickel breads<br />
(Mozaffarian et al., 2003). A single study suggested risk<br />
reduction among those with the highest intake of added<br />
bran compared with those who consumed no added bran<br />
(Jensen et al., 2004). The suggestion that reduced cardiovascular<br />
risk principally results from consumption of the<br />
wholegrain rather than dietary fibre is supported by findings<br />
from the Iowa Women’s Health Study. CHD rates were<br />
compared in women consuming similar amounts of cereal<br />
fibre from either predominantly refined grain sources or<br />
predominantly wholegrains. After adjustments, all cause<br />
mortality was significantly lower, and CHD appreciably<br />
(though not statistically significantly) reduced among the<br />
latter group (Jacobs et al., 2000). The absence of a universally<br />
adopted definition of ‘wholegrain’, and the even more<br />
inconsistent use of the terms ‘wholemeal’ and ‘wholewheat’<br />
preclude more definitive conclusions and complicate extrapolation<br />
into guidelines.<br />
Fruits and vegetables are important sources of carbohydrate<br />
and also contain a range of potentially cardioprotective<br />
components, including dietary fibre, folate,<br />
potassium, flavonoids and antioxidant vitamins. Pooled<br />
analyses of the Nurses’ Health Study and the Health<br />
Professionals’ Follow-up Study suggested risk reductions of<br />
20 and 30% for CHD and ischaemic stroke, respectively,<br />
when comparing extreme quintiles of fruit and vegetable<br />
intake (Joshipura et al., 2001). Similar findings were reported<br />
in a recent meta-analysis (He et al., 2006). A dose–response<br />
effect was reported with lowest risk for CHD being associated<br />
with eight servings or more per day and for stroke, four or<br />
more servings daily. It is noteworthy that in this, the largest<br />
study reported to date, individual items relatively low in<br />
total carbohydrate appear to have the most striking protective<br />
effect—green leafy vegetables in the case of CHD and<br />
cruciferous vegetables, citrus fruits and juices and vitamin C-rich<br />
Antioxidant Lipid-lowering Enzyme modulator<br />
Dietary fibre (nonstarch polysaccharide) O<br />
Unsaturated cis: n–3 and n–6 O<br />
Folate O<br />
Vitamin E O<br />
Selenium O<br />
Flavenoids O<br />
Phytooestrogens O<br />
European Journal of Clinical Nutrition<br />
fruits and vegetables in the case of stroke. In the Physicians’<br />
Health Study, Liu et al. (2001) reported an inverse association<br />
between carotenoid rich vegetables and CHD risk, and<br />
Finnish data suggested that flavonoid-rich foods (for example<br />
berries, onions, apples) were especially beneficial in this<br />
regard (Knekt et al., 1994). Legume consumption four or<br />
more times per week compared with less than once per week<br />
has also been associated with cardiovascular risk reduction<br />
(Bazzano et al., 2001).<br />
During the 1960s, Yudkin (1964) and co-workers reported<br />
strong associations between high sugar intakes and CHD.<br />
The data were cross-sectional and flawed (Keys, 1971;<br />
Truswell, 1987). The Iowa Women’s Health Study found no<br />
relationship between intake of sweets and desserts and CHD<br />
in over 30 000 women followed for 9 years (Jacobs et al.,<br />
1998). The glycaemic index (GI; and more recently the<br />
glycaemic load, GL) has provided a means of determining<br />
the extent to which carbohydrate-containing foods may<br />
determine cardiovascular risk through their potential to raise<br />
blood glucose. Liu et al. (2000b) reported from the Nurses’<br />
Health Study that women who consumed diets with a highglycaemic<br />
load (that is high in rapidly digested starches)<br />
were at increased risk of CHD compared with those with a<br />
lower consumption; a twofold increase in risk over a 10-year<br />
follow-up was observed when comparing those in the<br />
highest and lowest quintiles of intake. The effect appeared<br />
to be independent of total energy intake and other<br />
cardiovascular risk factors.<br />
The potential of dietary patterns, rather than the effect of<br />
individual foods and nutrients on human health, have been<br />
examined in two of the largest cohort studies—the Nurses’<br />
Health Study and the Health Professionals’ Study (Hu et al.,<br />
2000; Fung et al., 2001b). Factor analysis was used to<br />
examine the association between CHD and two major<br />
dietary patterns identified: ‘western’ and ‘prudent’. The<br />
prudent pattern was characterized by higher intakes of<br />
fruits, vegetables, legumes, fish, poultry and wholegrains<br />
and the western pattern, by higher intakes of red and<br />
processed meats, sweets and desserts, French fries<br />
and refined grains. After adjustment for cardiovascular risk<br />
factors, the prudent diet score was associated with relative<br />
risks of 1.0, 0.87, 0.79, 0.75 and 0.70 from the lowest to the<br />
highest quintiles. Conversely, the relative risks across<br />
increasing quintiles of the western pattern score were 1.0,
1.21, 1.35, 1.40 and 1.64. The patterns were also related to<br />
biochemical markers of CHD. Positive correlations were<br />
noted between the western pattern score and plasminogen<br />
activator antigen, fasting insulin, C-peptide, leptin, C-reactive<br />
protein and homocysteine after adjustment for confounders.<br />
A significant inverse correlation was observed between<br />
plasma folate and the western dietary pattern score. Inverse<br />
correlations were observed between the prudent pattern<br />
score and fasting insulin and homocysteine, and a positive<br />
correlation was observed with folate (Fung et al., 2001a).<br />
In summary, prospective epidemiological studies provide<br />
strong evidence for a protective role of wholegrain cereals,<br />
fruits and vegetables and dietary patterns characterized by<br />
relatively high intakes of such foods. While a high<br />
consumption of dietary fibre derived from cereals is also<br />
associated with a reduced risk of cardiovascular disease, it is<br />
not clear whether the cardioprotection can entirely be<br />
attributed to the polysaccharides per se. The effect seems to<br />
stem largely from dietary fibre in dark breads and may<br />
therefore be at least partially attributable to other constituents<br />
of wholegrains. It is not possible to determine the extent<br />
to which other potentially protective constituents of wholegrains<br />
are relevant. Epidemiological studies do not permit<br />
separating the effects of different wholegrains. Even the best<br />
prospective studies cannot conclusively eliminate the possibility<br />
of residual confounding, so recommendations regarding<br />
the intake of carbohydrates in relation to cardiovascular<br />
disease also depend on the intervention studies described<br />
below.<br />
Carbohydrates and cardiovascular risk factors<br />
Lipids and lipoproteins<br />
The effect of carbohydrates on lipids and lipoproteins has<br />
dominated discussions regarding the amounts and classes of<br />
carbohydrate likely to reduce cardiovascular risk. While<br />
there is no doubt that increasing total carbohydrate at the<br />
expense of fat, especially saturated and trans fatty acids in<br />
the Western diet, will result in reduction of total and lowdensity<br />
lipoprotein (LDL) cholesterol, concern has been<br />
expressed that other predictors of lipoprotein-mediated<br />
cardiovascular risk may be adversely affected by substantial<br />
increases in total carbohydrate. The potential of<br />
high carbohydrates to increase fasting triglycerides was first<br />
demonstrated in the 1960s (Ahrens et al., 1961) but later<br />
considered to be a transient phenomenon, the hypertriglyceridaemia<br />
diminishing with prolonged exposure to a high<br />
carbohydrate intake (Antonis and Bersohn, 1961; Stone and<br />
Connor, 1963). However, more recent and more sophisticated<br />
studies suggest that, at least in certain circumstances, a<br />
low-fat, high carbohydrate diet may be associated with<br />
slightly elevated triglyceride levels for as long as 2 years<br />
(Retzlaff et al., 1995). Furthermore, such a diet may result in<br />
the appearance of small dense LDL particles that are<br />
particularly atherogenic and in an adverse ratio of total to<br />
Cardiovascular disease and diabetes<br />
J Mann<br />
high-density lipoprotein (HDL) cholesterol considered to be<br />
a more specific marker of CHD than total LDL cholesterol<br />
(Kinosian et al., 1995).<br />
The effect of carbohydrate as replacement energy for fatty<br />
acids has been examined in a fairly recent meta-analysis<br />
involving 60 mostly short-term controlled trials (Mensink<br />
et al., 2003). The results appeared to offer a strong message:<br />
regardless of the source of the fat displaced, an increase in<br />
total carbohydrate was associated with an increased ratio of<br />
total to HDL cholesterol. However, although these studies<br />
paid careful attention to ensure that the comparisons were<br />
carried out under isoenergetic conditions and food intake<br />
was thoroughly controlled, there was less consistency with<br />
regard to the source and class of carbohydrate that was used<br />
as fat replacement. A fairly substantial body of evidence<br />
suggests that the type of carbohydrate influences lipid and<br />
lipoprotein levels. The effect of sugars on triglyceride levels<br />
differs from that of polysaccharides. Compared with starches<br />
and NSPs, sugars, especially sucrose and fructose, may be<br />
associated with appreciable increases in triglyceride levels,<br />
especially when the sugars are consumed in the context of a<br />
diet high in total carbohydrate or when dietary fat comprises<br />
principally of saturated fatty acids (Truswell, 1994). The<br />
effect appears to be more marked in insulin resistant<br />
individuals with abdominal obesity (Fried and Rao, 2003).<br />
Unfortunately, few long-term data are available. However,<br />
the CARMEN study suggested that after 6 months, a very<br />
modest weight loss could mitigate the hypertriglyceridaemic<br />
effect of a moderate increase in sucrose (Saris et al., 2000).<br />
This has also been observed for diets high in total<br />
carbohydrate and starches, which might otherwise have<br />
been associated with hypertriglyceridaemia when compared<br />
with diets lower in total carbohydrates (Kasim-Karakas et al.,<br />
2000).<br />
Dietary fibre has a potentially important effect on lipids<br />
and lipoproteins when consumed in plant foods or as<br />
supplements Viscous subgroups, including pectins, b-glucans,<br />
glucomannans, guar and psyllium, which are generally water<br />
soluble, all lower total and LDL cholesterol between 5 and<br />
10 g/day, lowering LDL by about 5% (Truswell, 2002). The<br />
mechanism appears to be by reducing ileal bile acid<br />
absorption (Morgan et al., 1993). These soluble forms of<br />
dietary fibre appear to have a negligible effect on triglyceride<br />
or HDL levels. Insoluble dietary fibre subgroups are derived<br />
largely from cereal sources and have little or no effect on<br />
lipids and lipoproteins (Jenkins et al., 2000). A Cochrane<br />
Review has been undertaken of randomized controlled trials<br />
(RCTs) investigating the effects of wholegrain cereals on<br />
CHD and cardiovascular risk factors. Only 10 studies were<br />
identified that met the strict criteria required for such a<br />
review. None had clinical end points. They compared<br />
wholegrain foods or diets high in wholegrain foods with<br />
other foods or diets with lower levels or no wholegrains.<br />
Eight of the ten studies evaluated wholegrain oats and<br />
clearly demonstrated the potential of such foods to reduce<br />
total LDL cholesterol. Levels were about 0.2 mmol/l lower<br />
S103<br />
European Journal of Clinical Nutrition
S104<br />
on the diet rich in oats compared with the control diet.<br />
No changes were observed in triglyceride or HDL cholesterol<br />
levels. Lack of appropriate studies precluded conclusions<br />
on wholegrains other than oats (Brunner et al., 2005).<br />
A Cochrane Review has also been undertaken to explore<br />
the extent to which low glycaemic index diets might<br />
influence CHD and risk factors. The average reduction in<br />
total cholesterol when comparing low and high GI diets was<br />
0.17 mmol/l, P ¼ 0.03 (95% CI 0.32 to 0.02). No convincing<br />
differences were apparent in LDL cholesterol, HDL<br />
cholesterol or triglyceride levels (Kelly et al., 2004).<br />
In studies of free living individuals in whom fruits,<br />
vegetables and legumes rich in the viscous forms of NSPs<br />
replaced some of the relatively high fat foods typically<br />
consumed in a western diet, total and LDL cholesterol fell as<br />
expected, and the ratio of total (or LDL) cholesterol to HDL<br />
cholesterol improved with no change reported in triglyceride<br />
despite an appreciable increase in total carbohydrate (Turley<br />
et al., 1998). Total carbohydrate provided 59 and 43% total<br />
energy on the high and low carbohydrate diets. While the<br />
aim of these studies was not to achieve weight loss, small<br />
reductions in body weight did occur on the high carbohydrate<br />
diets, perhaps as a result of the enhanced satiety<br />
associated with the more bulky, less energy dense foods.<br />
This, together with the effects of dietary fibre, are likely to<br />
have contributed to the less atherogenic lipid profile<br />
observed on the high carbohydrate diet. Such findings<br />
provide a clear indication of the need to consider the nature<br />
of dietary carbohydrate when carbohydrate rich foods are<br />
recommended as replacement for dietary saturated fatty<br />
acids.<br />
Type II diabetes, impaired carbohydrate metabolism and insulin<br />
resistance<br />
See later section, which deals more fully with this topic.<br />
Inflammatory markers<br />
There has been considerable recent interest in the role of<br />
inflammation as a determinant of cardiovascular risk. Much<br />
of the research relating to the role of nutritional determinants<br />
has centred around different dietary fats (Basu et al.,<br />
2006). Jenkins et al. (2003) reported reduced C-reactive<br />
protein levels in hyperlipidaemic patients consuming a high<br />
carbohydrate diet rich in viscous fibre-containing foods.<br />
However, the diets were also high in nuts (almonds), plant<br />
sterols and soy proteins, and it is therefore impossible to<br />
disentangle separate effects. A very recent study (Kasim-<br />
Karakas et al., 2006) found that when carbohydrate replaced<br />
a substantial proportion of dietary fat under eucaloric<br />
conditions, the levels of several inflammatory markers<br />
increased along with an increase in triglyceride. However,<br />
when the participants (post-menopausal women) consumed<br />
the 15% fat diet ad libitum under free living conditions, they<br />
European Journal of Clinical Nutrition<br />
Cardiovascular disease and diabetes<br />
J Mann<br />
lost weight and triglyceride and the levels of inflammatory<br />
markers decreased.<br />
Hypertension<br />
Several ‘high carbohydrate’ dietary approaches have been<br />
shown to be associated with reduced levels of blood pressure.<br />
However, these have invariably involved many dietary<br />
changes. For example, the Dietary Approaches to Stop<br />
Hypertension approaches have involved an increase in<br />
intakes of fruits and vegetables, low fat dairy products and<br />
a reduction in sodium. Thus, it has been impossible to<br />
disentangle individual effects (Appel et al., 1997).<br />
RCT involving clinical end points<br />
A single RCT has examined the effect of altering dietary<br />
carbohydrate intakes on clinical end points. Burr et al. (1989)<br />
randomized 2033 men who had survived a myocardial<br />
infarction to receive one of eight possible combinations of<br />
dietary advice. Those who were advised to increase cereal<br />
fibre had a similar rate of CHD recurrences and deaths as<br />
those who did not receive this advice when considering a<br />
10-year follow-up period. However, the study was underpowered<br />
and the degree of compliance is uncertain (Ness<br />
et al., 2002). Other RCTs, which involved an increase in<br />
dietary carbohydrate, from fruits, vegetables, legumes and<br />
wholegrain, as part of a multifactorial dietary approach to<br />
primary and secondary prevention of CHD, demonstrated<br />
reduction in clinical events among those receiving intensive<br />
dietary advice compared with control groups (Hjermann<br />
et al., 1981; de Lorgeril et al., 1994). The Women’s Health<br />
Initiative Randomised Control for Dietary Modification Trial<br />
involved the intervention group being recommended a high<br />
carbohydrate low fat diet. Failure to demonstrate significant<br />
differences in CHD rates in control and intervention groups<br />
contributed little to the understanding of the role of<br />
carbohydrates since long-term compliance with the intervention<br />
diet was poor (Howard et al., 2006).<br />
Dietary carbohydrate and cardiovascular disease:<br />
recommendations<br />
The joint WHO/FAO Expert Consultation on Diet, Nutrition<br />
and the Prevention of Chronic Disease (WHO Technical<br />
Report Series 916, 2003) considered that the evidence<br />
suggesting a cardio-protective effect of fruits and vegetables<br />
was ‘convincing’ and that relating to wholegrain cereals and<br />
NSP was ‘probable’. The evidence that high intakes of total<br />
carbohydrate might increase the risk of cardiovascular<br />
diseases was considered to be ‘insufficient’ (Table 10, p88<br />
TRS 916). Difficulties with regard to the definition of<br />
wholegrains and inability to exclude the possibility of
esidual confounding provide the justification for regarding<br />
the protective effect being graded as ‘probable’ rather than<br />
‘convincing’. The Expert Consultation recommended that<br />
total carbohydrate should provide 55–75% total energy and<br />
that free sugars should provide less than 10%. Recommended<br />
intake of fruits and vegetables was 400 or more g per<br />
day, excluding tubers (that is potatoes, cassava). Precise<br />
amounts of NSPs or dietary fibre were not recommended.<br />
However, it was considered that appropriate intakes of fruits,<br />
vegetables, legumes and regular consumption of wholegrain<br />
cereals would provide in excess of 20 g/day of NSP and over<br />
25 g of total dietary fibre. There was also no recommendation<br />
regarding glycaemic index. These recommendations<br />
would appear to be generally compatible with this update of<br />
the relevant literature with the following caveats:<br />
Many western countries have average intakes of carbohydrate,<br />
which are below 55% total energy. There is no<br />
good evidence that total carbohydrate intake for populations<br />
or individuals must reach the lower recommended<br />
intake in order to achieve a cardioprotective dietary<br />
pattern provided guidelines relating to dietary fat and<br />
other nutrients are met. Several national guidelines<br />
suggest a lower limit of 50% total energy.<br />
A wide range of carbohydrate intakes is compatible with<br />
cardioprotection. However, it is important to be prescriptive<br />
with regard to the nature of carbohydrate, especially<br />
when total carbohydrate intakes are at the upper end of<br />
the recommended range. Failure to emphasize the need<br />
for carbohydrate to be derived principally from wholegrain<br />
cereals, fruits, vegetables and legumes may result in<br />
increased lipoprotein-mediated risk of CHD associated<br />
with an increase in the ratio of total (or LDL) cholesterol<br />
to HDL cholesterol and an increase in triglyceride. This<br />
may apply particularly to overweight and obese individuals<br />
who are insulin resistant (see separate section on<br />
diabetes and insulin resistance).<br />
While fruits and legumes rich in viscous (soluble) forms of<br />
NSP and dietary fibre are associated with reduced LDL<br />
cholesterol, insoluble forms derived from wholegrain<br />
cereals also appear to confer cardioprotection possibly in<br />
association with other constituents of wholegrains. There<br />
is no convincing evidence that fibre supplements and<br />
manufactured and functional foods containing them<br />
reduce cardiovascular risk.<br />
Dietary carbohydrate and diabetes, impaired<br />
carbohydrate metabolism and the metabolic<br />
syndrome<br />
The escalating rates of type II diabetes worldwide and the<br />
realization that insulin resistance and its associated metabolic<br />
abnormalities contribute increasingly to the global epidemic<br />
of cardiovascular disease (Mann, 2000) have resulted in<br />
renewed interest in the nutritional determinants of these<br />
Cardiovascular disease and diabetes<br />
J Mann<br />
metabolic derangements. In the 1960s, Yudkin suggested that<br />
sugar (sucrose) was a major determinant of type II diabetes<br />
(then known as ‘maturity onset’ and later as ‘non-insulin<br />
dependent’ diabetes). The conclusions were based largely on<br />
highly selected, within country and cross country, comparisons<br />
(Yudkin, 1964; Nuttall and Gannon, 1981) later<br />
acknowledged to be totally inappropriate analyses (Nuttall<br />
et al., 1985). At about the same time, Trowell, then working in<br />
Uganda, suggested that the low rates of diabetes in rural Africa<br />
were likely to result from a protective effect of large intakes of<br />
dietary fibre found in the minimally processed or unprocessed<br />
carbohydrate, which provided a high proportion of total<br />
dietary energy in such societies (Trowell, 1975). Although it<br />
was not possible to know the extent to which these<br />
observations implied true causation or protection or simply<br />
represented confounding, they stimulated much subsequent<br />
epidemiological and experimental research.<br />
Prospective epidemiological studies<br />
A number of limitations apply to all prospective studies that<br />
have examined the association between foods and nutrients<br />
and the risk of various diseases. The issues that are<br />
potentially relevant to dietary carbohydrate have been<br />
considered in the previous section on cardiovascular disease,<br />
and they apply equally when relating various carbohydrates<br />
to risk of developing diabetes. Recent prospective studies<br />
provide some insight.<br />
In the Nurses’ Health Study, there was no association<br />
between total intake of grains and type II diabetes. However,<br />
wholegrain consumption appeared to be protective. When<br />
comparing the highest and lowest quintiles of intake, age<br />
and energy adjusted relative risk was 0.62 (95% CI: 0.53,<br />
0.71). Further adjustment for other risk factors did not<br />
appreciably alter this risk estimate (Liu et al., 2000). A<br />
virtually identical risk reduction was observed among men<br />
participating in the Health Professionals Study (Fung et al.,<br />
2002). A relative risk of 0.63 was reported in association with<br />
three or more servings per day of wholegrains. In the Iowa<br />
Women’s Health Study, postmenopausal women in the<br />
upper quintile of wholegrain consumption (more than 33<br />
servings per week) were 20% less likely to develop type II<br />
diabetes than those in the lowest quintile (fewer than 13<br />
servings per week) (Meyer et al., 2000). Wholegrains have<br />
also been shown to be protective against type II diabetes in<br />
African-Americans (van Dam et al., 2006), Finns (Montonen<br />
et al., 2003) and Iranians (Esmaillzadeh et al., 2005). Cereal<br />
fibre, as distinct from fibre derived from other sources,<br />
appears to be associated with a protective dose–response<br />
effect that is present after controlling for a range of<br />
potentially confounding factors. In the Nurses’ Health Study,<br />
multivariate relative risks for quintiles 1–5 were 1.0, 0.85,<br />
0.87, 0.82 and 0.64, respectively (Salmeron et al., 1997a). The<br />
role of wholegrains and dietary fibre in diabetes has been<br />
reviewed in detail in Venn and Mann (2004).<br />
S105<br />
European Journal of Clinical Nutrition
S106<br />
In the Nurses’ Health Study and the Health Professionals<br />
Follow-up Study, a statistically significant relative risk of<br />
about 1.4 was observed when comparing diabetes rates in the<br />
highest and lowest quintiles of dietary glycaemic load, after<br />
adjusting for potentially confounding factors (Salmeron<br />
et al., 1997a, b). A high dietary glycaemic index was also<br />
found to be associated with an increased risk of type II<br />
diabetes in the Melbourne Collaboration Cohort Study<br />
(Hodge et al., 2004).<br />
Rapidly digested starches and sugars, especially glucose,<br />
contribute to the glycaemic load of the diet, and thus such<br />
observations provide some evidence for a promotive role<br />
of these carbohydrates in type II diabetes. However,<br />
no association was found between sucrose intake and risk<br />
of diabetes during a 6-year follow-up of the Nurses’ Health<br />
Study (Colditz et al., 1992). Meyer et al. (2000), reporting the<br />
findings from the Iowa Women’s Health Study, found no<br />
relationship between type II diabetes and either glycaemic<br />
index or glycaemic load. However, dietary glucose and<br />
fructose (but not sucrose) were associated with increased risk.<br />
Women who developed gestational diabetes in the Nurses’<br />
Health Study had lower intakes of dietary fibre and higher<br />
dietary glycaemic load than those who did not (Zhang et al.,<br />
2006).<br />
No prospective studies have examined the relationship<br />
between dietary carbohydrate and insulin resistance,<br />
considered to be the underlying abnormality in most<br />
cases of type II diabetes. However, two large cross-sectional<br />
studies, using validated food frequency questionnaires<br />
to assess nutrient intake and either the frequently<br />
sampled intravenous glucose tolerance test or homoeostasis<br />
model assessment for insulin resistance, found that<br />
intake of dietary fibre was inversely associated with the<br />
probability of having insulin resistance (Lau et al., 2005;<br />
Liese et al., 2005). In the Insulin Resistance Atheroscelerosis<br />
Study (Liese et al., 2005), it was possible to<br />
demonstrate that fibre was associated with increased<br />
insulin sensitivity even after adjustment for body mass<br />
index. Interestingly, neither study found any relationship<br />
between insulin sensitivity and glycaemic index or<br />
glycaemic load.<br />
While diets rich in wholegrains and dietary fibre may<br />
protect against diabetes and pre-diabetic states by virtue of<br />
their potential to promote satiety and weight loss in those<br />
who are overweight or obese (excess adiposity being the<br />
major determinant of these metabolic abnormalities),<br />
the epidemiological data do provide evidence for a protective<br />
effect independent of that on fat mass. The data do not<br />
permit distinction among different grains nor the extent to<br />
which structure of the grain or its constituents explain the<br />
protective effect. Several studies suggest that diets with a<br />
relatively low glycaemic index or glycaemic load are<br />
protective against disorders of carbohydrate metabolism,<br />
but the data are insufficient to establish with certainty the<br />
extent to which this is independent of other attributes of<br />
carbohydrates.<br />
European Journal of Clinical Nutrition<br />
Cardiovascular disease and diabetes<br />
J Mann<br />
Experimental studies<br />
Most studies that have compared the effects of carbohydrates<br />
and fats and the effects of different carbohydrates have been<br />
undertaken in people with established diabetes; however,<br />
some information is available concerning people with<br />
insulin resistance and the metabolic syndrome. Insulin<br />
resistance and its associated dyslipidaemia (high triglyceride,<br />
low HDL) have been shown to be more marked on a high<br />
carbohydrate diet when compared with a diet rich in<br />
monounsaturated fatty acids. However, while such studies<br />
may distinguish between sugars and polysaccharides, they<br />
often do not distinguish between starches, many of which<br />
are rapidly digested and absorbed, and NSPs (Mann, 2001).<br />
A study by Pereira et al. (2002) clearly demonstrates the<br />
importance of doing so. In a controlled 6-week study,<br />
overweight hyperinsulinaemic adults consumed diets providing<br />
55% energy from carbohydrate and 30% from fat.<br />
Carbohydrates were derived from predominantly wholegrain<br />
or refined grain cereals, with dietary fibre content of the<br />
wholegrain diet 28 g compared with 17 g on the refined grain<br />
diet. Dietary fibre was predominantly from cereal sources.<br />
Total carbohydrate and fat and fat sources were virtually<br />
identical on the two diets. Insulin sensitivity measured by a<br />
euglycaemic hyperinsulinaemic clamp was appreciably improved<br />
on the wholegrain compared with the refined grain<br />
diet. Fasting insulins and area under the 2-h insulin curve<br />
were lower, despite body weight not being significantly<br />
different on the two diets. Rye bread (Juntunen et al., 2003)<br />
and purified cereal fibre (Weickert et al., 2006) have been<br />
shown to improve insulin sensitivity in overweight and<br />
obese women.<br />
Analysis of a subgroup of individuals within the CARMEN<br />
Study, who were diagnosed with the metabolic syndrome,<br />
showed that the reduction in body weight and improvement<br />
in metabolic indices seen when simple carbohydrate (sugars)<br />
were replaced with complex ones were more striking in<br />
people with this disorder than in the general population<br />
(Poppitt et al., 2002). Studies by McAuley et al. (2005; 2006)<br />
have compared different nutritional approaches in overweight<br />
insulin-resistant women. Although a low carbohydrate<br />
high fat diet resulted in initial weight loss and<br />
improvement in the metabolic derangements associated<br />
with insulin resistance, the improvement was not sustained.<br />
A diet relatively high in protein and unsaturated fat sources<br />
and with moderate amounts of fibre-rich carbohydrate, and<br />
one low in total fat and relatively high in fibre-rich<br />
carbohydrate produced sustained weight loss and improvement<br />
in a range of metabolic measurements over a period of<br />
a year. Thus, while weight loss in those who are overweight<br />
or obese is the cornerstone of management aimed at<br />
improving insulin sensitivity, it appears that this can be<br />
achieved by diets relatively high or relatively low in<br />
carbohydrates, provided the carbohydrate sources are<br />
wholegrain and rich in dietary fibre. Other studies that have<br />
compared the effects of diets of varying amounts of
carbohydrate have generated broadly similar results (Nordmann<br />
et al., 2006).<br />
The fact that fructose, compared with glucose, is preferentially<br />
metabolized to lipid in the liver and that fructose<br />
consumption induces insulin resistance, impaired glucose<br />
tolerance, hyperinsulinaemia, hypertriglyceridaemia and<br />
hypertension in animal models has led to the suggestion<br />
that fructose, sucrose or high fructose corn syrup may have<br />
uniquely untoward effects compared with other carbohydrates<br />
in humans when fed in the context of energy balance.<br />
However, while these sugars may contribute to increasing<br />
the risk of overweight and obesity and thus to the<br />
clinical and metabolic disorders (Mann, 2004), the evidence<br />
regarding fructose remains limited and conflicting, and no<br />
conclusions can be drawn (Elliott et al., 2002; Daly, 2003).<br />
A large number of studies have been undertaken to<br />
determine the extent to which total quantity and nature of<br />
dietary carbohydrate influence glycaemic control, insulin<br />
resistance and cardiovascular risk factors in people with type<br />
II diabetes. While such studies apply principally to diabetes<br />
management, it seems reasonable to assume that the data<br />
also have some relevance to disease prevention.<br />
A meta-analysis of nine studies has been undertaken to<br />
compare the effects of high carbohydrate and high monounsaturated<br />
fatty acid diets. The overall results provide<br />
evidence of higher fasting triglycerides and VLDL cholesterol,<br />
slightly lower HDL cholesterol, slightly higher glucose,<br />
but not glycated haemoglobin on the high carbohydrate<br />
diets, typically providing 55–60% total energy from carbohydrate<br />
(Garg, 1998). There was considerable variation in the<br />
results of the individual studies, partly due to the fact that<br />
they were all relatively underpowered and also because the<br />
severity of diabetes may influence response to dietary<br />
carbohydrate. However, equally important is the fact that<br />
the nature of dietary carbohydrate was not clearly specified.<br />
It appears that a range of ‘complex carbohydrates’ provided a<br />
substantial proportion of total carbohydrate on the high<br />
carbohydrate diets. It seems that there may have been a lack<br />
of appreciation regarding the different effects of starches and<br />
NSPs and indeed the different effects of NSPs from different<br />
sources. This is surprising, given that in the late 1980s, it had<br />
been clearly shown that high carbohydrate diets were only<br />
associated with beneficial effects in terms of glycaemic<br />
control and blood lipids when carbohydrate was derived<br />
principally from foods rich in soluble forms of dietary fibre,<br />
notably pulses, legumes and intact fruits and vegetables<br />
(Rivellese et al., 1980; Simpson et al., 1981; Riccardi et al.,<br />
1984; Mann, 2001). Higher intakes of cereal (insoluble) fibre<br />
were associated with less marked or no benefit in glucose or<br />
lipid levels (Simpson et al., 1979; 1982; Riccardi et al., 1984).<br />
The beneficial effects of soluble forms of dietary fibre derived<br />
from fruits and vegetables appear to have been rediscovered<br />
more recently in randomized crossover studies in type II<br />
diabetes (Chandalia et al., 2000). Dietary fibre has also been<br />
shown to be of benefit in type I diabetes (Giacco et al., 2000).<br />
Cross-sectional epidemiological data, based on the<br />
Cardiovascular disease and diabetes<br />
J Mann<br />
EURODIAB Complications Study, which included over<br />
2000 patients in 31 European centres, showed an inverse<br />
association between dietary fibre intake of HbA1c and LDL<br />
cholesterol (in men only) and a positive association with<br />
HDL cholesterol in men and women (Toeller et al., 1999). An<br />
RCT (parallel design) in type I patients continued for 6<br />
months, confirmed the potential for around 40 g/day dietary<br />
fibre (half of the soluble type from legumes, fruits and<br />
vegetables) to improve glycaemic control (Giacco et al.,<br />
2000). Some studies have shown improved glycaemic control<br />
when soluble fibres have been fed as supplements to patients<br />
with diabetes. However, evidence-based nutritional guidelines<br />
of the Nutrition Study Group of the European<br />
Association for the Study of Diabetes offer no recommendations<br />
regarding supplements of functional foods providing<br />
increased dietary fibre. Long-term clinical trials are deemed<br />
necessary before recommendations can be considered (Mann<br />
et al., 2004).<br />
In the 1980s, several RCT with crossover designs demonstrated<br />
no adverse effects on glycaemic control, lipids and<br />
lipoproteins when diets containing small amounts of sucrose<br />
(usually around 50 g) were compared under eucaloric conditions<br />
with virtually sucrose-free diets in type I and type II<br />
diabetes (Slama et al., 1984; Peterson et al., 1986; Mann, 1987).<br />
While there is thus clear evidence for the acceptability of<br />
moderate intakes of sucrose for most people with diabetes,<br />
there are few data from which to derive acceptable upper<br />
limits. For those who are overweight or obese or are markedly<br />
insulin resistant, fairly severe restriction may be appropriate.<br />
For all others, moderate intakes of free sugars (up to 50 g/day)<br />
are acceptable, provided that free sugars do not exceed 10%<br />
total energy. There are suggestions that sugar in beverages<br />
increases body weight to a greater extent than the same<br />
amount of sugar in the solid form (diMeglio and Mattes, 2000).<br />
A number of randomized trials have examined the extent<br />
to which diets with a low glycaemic index can improve<br />
glycaemic control and cardiovascular risk factors. Several<br />
meta-analyses have been published (Brand-Miller et al., 2003;<br />
Opperman et al., 2004) and the results are broadly comparable.<br />
For example, Opperman et al. reported a reduction in<br />
HbA1c of 0.27 (95% confidence intervals: 0.5 to 0.03)<br />
when comparing high and low glycaemic index diets. This<br />
issue was examined in a Cochrane Systematic Review, which<br />
suggested some evidence of an effect of low GI diets<br />
compared with high GI diets after 12 weeks. Pooled analysis<br />
of studies with a parallel design demonstrated mean HbA1c<br />
levels 0.45% less than the high GI diets (95% confidence<br />
intervals: 0.82 to 0.09, P ¼ 0.02). It is of importance to<br />
note that the low GI foods utilized in most of the studies<br />
were plant based (for example peas, lentils, beans, pasta,<br />
barley, parboiled rice, oats and cereals) as were the high<br />
GI foods (potatoes, wheatmeal and white bread and high GI<br />
breakfast cereals). The studies did not generally include<br />
many of the now widely available manufactured and<br />
functional foods, which are not necessarily predominantly<br />
plant based.<br />
S107<br />
European Journal of Clinical Nutrition
S108<br />
RCT with clinical end points<br />
Two RCTs involving people with impaired glucose tolerance<br />
consuming ‘western’ diets have examined the extent to<br />
which progression of impaired glucose tolerance to type II<br />
diabetes can be reduced by intensive lifestyle modification<br />
(Tuomilehto et al., 2001; Knowler et al., 2002). In both the<br />
Finnish and US intervention studies, advice regarding<br />
frequent consumption of wholegrain products, vegetables<br />
and fruits has been a pivotal component of the advice to<br />
achieve weight loss. Other components included recommendations<br />
to use monounsaturated oils, soft margarines and<br />
low fat meat and milk products, as well as to increase<br />
physical activity of moderate intensity. These interventions<br />
achieved a nearly 60% reduction of progression from<br />
impaired glucose tolerance to type II diabetes. While it is<br />
impossible to accurately disentangle the separate contributions<br />
of the different components of the intervention<br />
package, and weight loss was clearly the major determinant<br />
of risk reduction, increased intake of dietary fibre appeared<br />
to be independently associated with reduced risk of progression<br />
(Lindstrom et al., 2003). A similar study has been<br />
conducted in India (Ramachandran et al., 2006).<br />
Dietary carbohydrate and diabetes:<br />
recommendations<br />
The Joint WHO/FAO Expert Consultation on Diet, Nutrition<br />
and the Prevention of Chronic Disease (WHO Technical<br />
Report Series 916, 2003) describes the protective effect of NSP<br />
as ‘probable’. However, an explanatory note indicates that<br />
the level of evidence is graded as ‘probable’ rather than<br />
‘convincing’ because of the apparent discrepancy between<br />
the experimental studies, in which it appears that soluble<br />
forms of NSP exert benefit in terms of glycaemic control,<br />
lipids and lipoproteins, and the prospective cohort studies,<br />
which suggest that cereal-derived insoluble forms are<br />
protective. The evidence regarding low glycaemic index<br />
foods as protective is graded as ‘possible’. The evidence table<br />
(Table 9, p 77 TRS 916) leads to the disease-specific<br />
recommendation regarding intakes of NSP, which quite<br />
appropriately disregards a clear distinction between soluble<br />
and insoluble forms and suggests that adequate intakes of<br />
NSP or dietary fibre can be achieved through regular<br />
consumption of wholegrain cereals, legumes, fruits<br />
and vegetables. There is no clear evidence on which to<br />
base precise quantities although a minimum intake of 20 g<br />
of NSP is recommended. These recommendations appear<br />
to be compatible with this update of the relevant literature<br />
with two caveats:<br />
There appears to be a reasonable body of evidence to<br />
suggest a protective effect of wholegrains.<br />
The apparently different effects of soluble and insoluble<br />
forms of NSP or dietary fibre may result from difficulty in<br />
accurately distinguishing between the two forms.<br />
European Journal of Clinical Nutrition<br />
Cardiovascular disease and diabetes<br />
J Mann<br />
Similar approaches to those suggested for reducing disease<br />
risk have been recommended for the management of<br />
diabetes. The European evidence-based nutritional approaches<br />
(Mann et al., 2004) to the treatment of diabetes indicate that<br />
a wide range of intakes of total carbohydrate (45–60% total<br />
energy) is acceptable, provided a high proportion of<br />
carbohydrate energy is derived from vegetables, legumes,<br />
fruits and wholegrain cereals. This should provide the<br />
recommended intake of total dietary fibre (more than<br />
40 g/day or 20 g/1000 kcal/day), about half of which should<br />
be soluble. Cereal-based foods should whenever possible be<br />
wholegrain and high in fibre. Daily consumption of at least<br />
five servings of fibre-rich vegetables or fruits and at least four<br />
servings of legumes per week help to provide the minimum<br />
requirements for fibre. While a choice anywhere within this<br />
range is acceptable for most people, it is acknowledged that<br />
some, especially those with marked hypertriglyceridaemia<br />
and/or severe insulin resistance, may respond more appropriately<br />
to an intake at the lower end of the recommended<br />
range. Use of carbohydrate-containing foods with a low<br />
glycaemic index is encouraged. While a moderate amount of<br />
sugar is acceptable in the context of energy balance, those<br />
who are overweight should substantially restrict sugar-containing<br />
energy-dense foods. Sugar-containing beverages,<br />
while not energy dense, promote overweight and obesity<br />
and are best avoided. Finally, it is important to emphasize<br />
that the beneficial effects of certain carbohydrate-containing<br />
foods have been based principally on the consumption of<br />
conventional foods. Evidence for the benefit of manufactured<br />
and functional foods containing added dietary fibre or<br />
other components of wholegrains, fruits, vegetables and<br />
legumes is limited. This applies also to foods with a low<br />
glycaemic index. Some foods now marketed as having a low<br />
glycaemic index are high in fat and sugar and therefore may<br />
not be suitable for people with diabetes, especially those<br />
who are overweight. The paper describing the European<br />
recommendations (Mann et al., 2004) provides a detailed list<br />
of references justifying the conclusions summarized here.<br />
Conclusions<br />
Nutritional attributes that are likely to protect against<br />
diabetes and cardiovascular diseases are remarkably similar<br />
as are the principles of nutritional management for those<br />
who already have established disease. In summary, they are<br />
as follows:<br />
A wide range of intakes of carbohydrate containing foods<br />
is acceptable.<br />
Nature of carbohydrate rather than quantity is principally<br />
what matters.<br />
Intact fruits, vegetables, legumes and wholegrains are<br />
excellent sources of carbohydrate likely to be rich in NSP<br />
or dietary fibre and other potentially cardioprotective<br />
components.
There is no good evidence of benefit when NSP or other<br />
components of wholegrains, fruits, vegetables and<br />
legumes are added to functional and manufactured foods.<br />
Low glycaemic index foods may confer benefits in terms<br />
of lowering total cholesterol and improving glycaemic<br />
control in people with diabetes. However, it is not clear<br />
whether these benefits are independent of the effects of<br />
dietary fibre or the fact that low glycaemic index foods<br />
tend to have intact plant cell walls. Furthermore, it is<br />
uncertain whether functional and manufactured foods<br />
with a low glycaemic index confer the same long-term<br />
benefits as low glycaemic index predominantly plantbased<br />
foods.<br />
A low dietary glycaemic load may reduce the risk of type II<br />
diabetes and cardiovascular disease. The same caveats as<br />
those described above for the therapeutic role of low GI<br />
foods apply.<br />
Limitations to the use of the glycaemic index and<br />
glycaemic load concepts in the clinical setting are further<br />
described in the accompanying paper in this series.<br />
Acknowledgements<br />
I thank Professor Kjeld Hermansen, Dr Andrew Neil, Dr<br />
Gabriele Riccardi, Dr Angela Rivellese, Dr Monika Toeller,<br />
Professor A Stewart Truswell, Dr Rob M van Dam and Dr HH<br />
Vorster for the valuable comments they provided on the<br />
earlier paper.<br />
Conflict of interest<br />
During the preparation and peer-review of this paper in<br />
2006, the author and peer-reviewers declared the following<br />
interests.<br />
Author<br />
Professor Jim Mann: none declared.<br />
Peer-reviewers<br />
Professor Kjeld Hermansen: none declared.<br />
Dr Andrew Neil: none declared.<br />
Dr Gabriele Riccardi: none declared.<br />
Dr Angela Rivellese: none declared.<br />
Dr Monika Toeller: none declared.<br />
Professor A Stewart Truswell: none declared.<br />
Dr Rob M van Dam: none declared.<br />
Dr HH Vorster: member and director of the Africa Unit for<br />
Transdisciplinary health Research (AUTHeR), Research grant<br />
from the South African Sugar association.<br />
References<br />
Ahrens E, Hirsch J, Oette K, Farquhar J, Stein Y (1961). Carbohydrateinduced<br />
and fat-induced lipemia. Trans Assoc Am Physicians 74,<br />
134–146.<br />
Cardiovascular disease and diabetes<br />
J Mann<br />
Anderson JW (2002). Whole-grains intake and risk for coronary heart<br />
disease. In: Marquart L, Slavin JL, Fulcher RD (eds). Whole-grain<br />
Foods in Health and Disease. American Association of Cereal Chemists.<br />
St Paul: Minnesota, USA. pp 187–200.<br />
Anderson JW (2003). Whole grains protect against atherosclerotic<br />
cardiovascular disease. Proc Nutr Soc 62, 135–142.<br />
Anderson JW, Hanna TJ, Peng X et al. (2000). Whole grain foods and<br />
heart disease risk. J Am Coll Nutr 19, 291S–299S.<br />
Antonis A, Bersohn I (1961). The influence of diet on serum-triglycerides<br />
in South African White and Bantu prisoners. Lancet 7, 39.<br />
Appel LJ, Moore TJ, Obarzanek E et al. (1997). For the DASH<br />
Collaborative Research Group. A clinical trial of the effects of<br />
dietary patterns on blood pressure. N Engl J Med 336, 1117–1124.<br />
Baghurst KI, Record SJ, Baghurst PA (1991). The relationship between<br />
refined sugar and micronutrient intakes. Proc Nutr Soc Australia<br />
16, 33.<br />
Basu A, Devaraj S, Jialal I (2006). Dietary factors that promote or<br />
retard inflammation. Arterioscler Thromb Vasc Biol 26, 995–1001.<br />
Bazzano LA, He J, Ogden LG, Loria C, Vupputuri S, Myers L et al.<br />
(2001). Legume consumption and risk of coronary heart disease in<br />
US men and women: NHANES 1 Epidemiologic Follow-up Study.<br />
Arch Intern Med 161, 2573–2578.<br />
Brand-Miller J, Hayne S, Petocz P et al. (2003). Low-glycemic index<br />
diets in the management of diabetes: a meta-analysis of randomized<br />
controlled trials. Diabetes Care 26, 2261–2267.<br />
Brunner EJ, Thorogood M, Rees K, Hewitt G (2005). Dietary advice<br />
for reducing cardiovascular risk. Cochrane Database of Systematic<br />
Reviews 4, Art. No: CD002128.DOl: 10.1002/.<br />
Burr ML, Fehily AM, Gilbert JF, Rogers S, Holliday RM, Sweetnam PM<br />
et al. (1989). Effects of changes in fat, fish and fibre intakes on<br />
death and myocardial reinfarction: diet and reinfarction trial<br />
(DART). Lancet ii, 757–761.<br />
Chandalia M, Garg A, Lutjohann D, von Bergmann K, Grundy SM,<br />
Brinkley LJ (2000). Beneficial effects of high dietary fiber intake<br />
in patients with type 2 diabetes mellitus. N Engl J Med 342,<br />
1392–1398.<br />
Colditz GA, Manson JF, Stampfer MJ, Rosner B, Willett WC, Speizer<br />
FF (1992). Diet and risk of clinical diabetes in women. Am J Clin<br />
Nutr 55, 1018–1023.<br />
Daly M (2003). Sugars, insulin sensitivity, and the postprandial state.<br />
Am J Clin Nutr 78, 865S–872S.<br />
de Lorgeril M, Renaud S, Mamelle N, Salen P, Martin J, Monjaud I<br />
et al. (1994). Mediterranean alpha-linolenic acid-rich diet in<br />
secondary prevention of coronary heart disease. Lancet 343,<br />
1454–1459.<br />
DiMeglio DP, Mattes RD (2000). Liquid versus solid carbohydrate:<br />
effects on food intake and body weight. Int J Obes Relat Metab<br />
Disord 24, 794–800.<br />
Elliott SS, Keim NS, Stern JS, Teff K, Havel PJ (2002). Fructose,<br />
weight gain, and the insulin resistance syndrome. Am J Clin Nutr<br />
76, 911–922.<br />
Esmaillzadeh A, Mirmiran P, Azizi F (2005). Whole-grain consumption<br />
and the metabolic syndrome: a favorable association in<br />
Tehranian adults. Eur J Clin Nutr 59, 353–362.<br />
Flight I, Clifton P (2006). Cereal grains and legumes in the<br />
prevention of coronary heart disease and stroke: a review of the<br />
literature. Eur J Clin Nutr 60, 1145–1159.<br />
Fried SK, Rao SP (2003). Sugars, hypertriglyceridemia, and cardiovascular<br />
disease. Am J Clin Nutr 78 (Suppl 8), 73S–80S.<br />
Fung TT, Hu FB, Pereira MA et al. (2002). Whole-grain intake and the<br />
risk of type 2 diabetes: a prospective study in men. Am J Clin Nutr<br />
76, 535–540.<br />
Fung TT, Rimm EB, Spiegelman D, Rifai N, Tofler GH, Willett WC<br />
et al. (2001a). Association between dietary patterns and plasma<br />
biomarkers of obesity and cardiovascular disease risk. Am J Clin<br />
Nutr 73, 61–67.<br />
Fung TT, Willett WC, Stampfer MJ, Manon JE, Fu FB (2001b). Dietary<br />
patterns and risk of coronary heart disease in women. Arch Intern<br />
Med 161, 1857–1862.<br />
S109<br />
European Journal of Clinical Nutrition
S110<br />
Cardiovascular disease and diabetes<br />
J Mann<br />
Garcia-Palmieri MR, Sorlie P, Tillotson J, Costas Jr R, Cordero E,<br />
Rodriguez M (1980). Relationship of dietary intake to subsequent<br />
coronary heart disease incidence: The Puerto Rico Heart Health<br />
Program. Am J Clin Nutr 33, 1818–1827.<br />
Garg A (1998). High-monounsaturated-fat diets for patients<br />
with diabetes mellitus: a meta-analysis. Am J Clin Nutr 67,<br />
577S–582S.<br />
Giacco R, Parillo M, Rivellese AA et al. (2000). Long-term dietary<br />
treatment with increased amounts of fiber-rich low-glycemic<br />
index natural foods improves blood glucose control and reduces<br />
the number of hypoglycemic events in type 1 diabetic patients.<br />
Diabetes Care 23, 1461–1466.<br />
He FJ, Nawson CA, Macgregor GA (2006). Fruit and vegetable<br />
consumption and stroke: metaanalysis of cohort studies. Lancet<br />
367, 320–326.<br />
Hjermann I, Byer K, Holme I et al. (1981). Effect of diet and smoking<br />
intervention on the incidence of coronary heart disease. Lancet ii,<br />
1303–1310.<br />
Hodge AM, English DR, O’Dea K et al. (2004). Glycaemic Index and<br />
dietary fiber and the Risk of type 2 diabetes. Diabetes Care 27,<br />
2701–2706.<br />
Howard BV, van Horn JH, Manson JE et al. (2006) (reprinted) Low-fat<br />
dietary pattern and risk of cardiovascular disease: the women’s<br />
health initiative randomized controlled dietary modification trial.<br />
JAMA 295, 655–666.<br />
Hu FB (2003). Plant-based foods and prevention of cardiovascular<br />
disease: an overview. Am J Clin Nutr 78 (Suppl 3), 544S–551S.<br />
(review).<br />
Hu FB, Rimm EB, Stampfer MJ, Ascherio A, Spiegelman D,<br />
Willett WC (2000). Prospective study of major dietary patterns<br />
and risk of coronary heart disease in men. Am J Clin Nutr 72,<br />
912–921.<br />
Jacobs Jr DR, Meyer KA, Kushi LH, Folsom AR (1998). Whole-grain<br />
intake may reduce the risk of ischemic heart disease death in postmenopausal<br />
women: the Iowa Women’s Health Study. Am J Clin<br />
Nutr 68, 248–257.<br />
Jacobs Jr DR, Pereira MA, Meyer KA, Kushi LH (2000). Fiber from<br />
whole grains, but not refined grains, is inversely associated with<br />
all-cause mortality in older women: the Iowa women’s health<br />
study. J Am Coll Nutr 19, 326S–330S.<br />
Jenkins DJ, Kendall CW, Marchie A, Faulkner DA, Wong JM, de Souza<br />
R et al. (2003). Effects of a dietary portfolio of cholesterol-lowering<br />
foods vs lovastatin on serum lipids and C-reactive protein. JAMA<br />
290, 502–510.<br />
Jenkins DJA, Kendall CWC, Axelsen M, Augustin LSA, Vuksan V<br />
(2000). Viscous and nonviscous fibres, nonabsorbable and low<br />
glycaemic indeed carbohydrates, blood lipids and coronary heart<br />
disease. Curr Opin Lipidol 11, 49–56.<br />
Jensen MK, Koh-Banerjee P, Hu FB, Franz M, Sampson L, Gronbaek M<br />
et al. (2004). Intakes of whole grains, bran, and germ and the<br />
risk of coronary heart disease in men. Am J Clin Nutr 80,<br />
1492–1499.<br />
Joshipura KJ, Hu FB, Manson JE et al. (2001). The effect of fruit and<br />
vegetable intake on risk for coronary heart disease. Ann Intern Med<br />
134, 1106–1114.<br />
Juntunen KS, Laaksonen DE, Poutanen KS, Niskanen LK, Mykkanen<br />
HM (2003). High-fiber rye bread and insulin secretion and<br />
sensitivity in healthy postmenopausal women. Am J Clin Nutr<br />
77, 385–391.<br />
Kasim-Karakas SE, Almario RU, Mueller WM, Peerson J (2000).<br />
Changes in plasma lipoproteins during low-fat, high-carbohydrate<br />
diets: effects of energy intake. Am J Clin Nutr 71, 1439–1447.<br />
Kasim-Karakas SE, Tsodikov A, Singh U, Jialal I (2006). Responses of<br />
inflammatory markers to a low-fat, high carbohydrate diet: effects<br />
of energy intake. Am J Clin Nutr 83, 774–779.<br />
Kelly S, Frost G, Whittaker V et al. (2004). Low glycaemic index diets<br />
for coronary heart disease. Cochrane Database Syst Rev 18,<br />
CD004467.<br />
European Journal of Clinical Nutrition<br />
Keys A (1971). Sucrose in the diet and coronary heart disease.<br />
Atherosclerosis 14, 193–202.<br />
Kinosian B, Glick H, Preiss L, Puder KL (1995). Cholesterol and<br />
coronary heart disease: predicting risks in men by changes in<br />
levels and ratios. J Invest Med 43, 443–450.<br />
Knekt P, Reunanen A, Jarvinen R, Seppanen R, Heliovaara M, Aromaa<br />
A (1994). Antioxidant vitamin intake and coronary mortality in a<br />
longitudinal population study. Am J Epidemiol 139, 1180–1189.<br />
Knowler WC, Barrett-Connor E, Fowler SE, et al. , For the Diabetes<br />
Prevention Program Research Group (2002). Reduction in the<br />
incidence of type 2 diabetes with lifestyle intervention or<br />
metformin. N Engl J Med 346, 393–403.<br />
Lau C, Faerch K, Glumer C, Tetens I, Pedersen O, Carstensen B<br />
et al. (2005). Dietary glycemic index, glycemic load, fiber, simple<br />
sugars, and insulin resistance: the Inter 99 study. Diabetes Care 28,<br />
1397–1403.<br />
Liese AD, Schulz M, Fang F, Wolever TM, D’Agostino RB, Sparks KC<br />
et al. (2005). Dietary glycemic index and glycemic load, carbohydrate<br />
and fiber intake, and measures of insulin sensitivity,<br />
secretion, and adiposity in the Insulin Resistance Atherosclerosis<br />
Study. Diabetes Care 28, 2832–2838.<br />
Lindstrom J, Louheranta A, Mannelin M, Rastas M, Salminen V,<br />
Eriksson J et al. (2003). The Finnish Diabetes Prevention Study<br />
(DPS): lifestyle intervention and 3-year results on diet and physical<br />
activity. Diabetes Care 26, 3230–3236.<br />
Liu S (2002). Intake of refined carbohydrates and whole grain foods<br />
in relation to risk of type 2 diabetes mellitus and coronary heart<br />
disease. J Am Coll Nutr 21, 298–306.<br />
Liu S, Lee IM, Ajani U, Cole SR, Buring JE, Manson JE (2001).<br />
Intake of vegetables rich in carotenoids and risk of coronary heart<br />
disease in men: the Physicians’ Health Study. Int J Epidemiol 30,<br />
130–135.<br />
Liu S, Manson JE, Stampfer MJ et al. (2000). A prospective study of<br />
whole-grain intake and risk of type 2 diabetes mellitus in US<br />
women. Am J Public Health 90, 1409–1415.<br />
Liu S, Manson JE, Stampfer MJ, Rexrode KM, Hu FB, Rimm EG<br />
et al. (2000a). Whole grain consumption and risk of ischemic<br />
stroke in women: a prospective study. JAMA 284, 1534–1540.<br />
Liu S, Willett WC, Stampfer MJ, Hu FB, Franz M, Sampson L<br />
et al. (2000b). A prospective study of dietary glycaemic load,<br />
carbohydrate intake, and risk of coronary heart disease in US<br />
women. Am J Clin Nutr 71, 1455–1461.<br />
Mann J (2001). Dietary fibre and diabetes revised. Eur J Clin Nutr 55,<br />
919–921.<br />
Mann J (2004). Free sugars and human health: sufficient evidence for<br />
action? Lancet 363, 1068–1070.<br />
Mann JI (1987). Simple sugars and diabetes. Diabet Med 4, 135–139.<br />
Mann JI (2000). Stemming the tide of the diabetes epidemic. Lancet<br />
356, 1454–1455 (editorial).<br />
Mann JI, De Leeuw I, Hermansen K, Karamanos B, Karlström B,<br />
Katsilambros N et al. (2004). Evidence-based nutritional<br />
approaches to the treatment and prevention of diabetes mellitus.<br />
Nutr Metab Cardiovasc Dis 14, 373–394.<br />
McAuley KA, Hopkins CM, Smith KJ, McLay RT, Williams SM, Taylor<br />
RW et al. (2005). Comparisons of high-fat and high-protein diets<br />
with a high-carbohydrate diet in insulin-resistant obese women.<br />
Diabetologia 48, 8–16.<br />
McAuley KA, Smith KJ, Taylor RW, McLay RT, Williams SM, Mann JI<br />
(2006). Long-term effects of popular dietary approaches on weight<br />
loss and features of insulin resistance. Int J Obes 30, 342–349.<br />
McGee DL, Reed DM, Yano K, Kagan A, Tillotson J (1984). Ten-year<br />
incidence of coronary heart disease in the Honolulu Heart<br />
Program: relationship to nutrient intake. Am J Epidemiol 119,<br />
667–676.<br />
Mensink RP, Zock PL, Kester ADM, Katan MB (2003). Effects of<br />
dietary fatty acids and carbohydrates on the ratio of serum total to<br />
HDL cholesterol and on serum lipids and apolipoproteins: a metaanalysis<br />
of 60 controlled trials. Am J Clin Nutr 77, 1146–1155.
Meyer KA, Kushi LH, Jacobs Jr DR, Slavin J, Sellers TA, Folsom AR<br />
(2000). Carbohydrates, dietary fiber, and incident type 2 diabetes<br />
in older women. Am J Clin Nutr 71, 921–930.<br />
Montonen J, Knekt P, Jarvinen R, Aromaa A, Reunanen A (2003).<br />
Whole-grain and fiber intake and the incidence of type 2 diabetes.<br />
Am J Clin Nutr 77, 622–629.<br />
Morgan LM, Tredger JA, Shavila Y, Travis JS, Wright J (1993). The<br />
effect of non-starch polysaccharide supplementation on circulating<br />
bile acids, hormone and metabolite levels following a fat meal<br />
in human subjects. Br J Nutr 70, 491–501.<br />
Morris JN, Marr JW, Clayton DG (1977). Diet and heart: a postscript.<br />
BMJ 2, 1307–1314.<br />
Mozaffarian D, Kumanyika SK, Lemaitre RN, Olson JL, Burke GL,<br />
Siscovick DS (2003). Cereal, fruit and vegetable fiber intake and<br />
the risk of cardiovascular disease in elderly individuals. JAMA 289,<br />
1659–1666.<br />
Ness AR, Hughes J, Elwood PC, Whiteley E, Smith GD, Burr ML<br />
(2002). The long-term effect of dietary advice in men with<br />
coronary disease: follow-up of the Diet and Reinfarction trial<br />
(DART). Eur J Clin Nutr 56, 512–518.<br />
Nordmann AJ, Nordmann A, Briel M, Keller U, Yancy Jr WS, Brehm BJ<br />
et al. (2006). Effects of low-carbohydrate vs low-fat diets on weight<br />
loss and cardiovascular risk factors: a meta-analysis of randomized<br />
controlled trials. Arch Intern Med 166, 285–293.<br />
Nuttall FO, Gannon MC, Wald JL, Ahmed M (1985). Plasma glucose<br />
and insulin profiles in normal subjects ingesting diets of varying<br />
carbohydrate, fat, and protein content. J Am Coll Nutr 4, 437–450.<br />
Nuttall FO, Gannon MC (1981). Sucrose and disease. Diabetes Care<br />
4L, 305–310.<br />
Opperman AM, Venter CS, Oosthuizen W et al. (2004). Meta-analysis<br />
of the health effects of using the glycaemic index in mealplanning.<br />
Br J Nutr 92, 367–381.<br />
Pereira MA, Jacobs Jr DR, Pins JJ, Raatz SK, Gross MD, Slavin JL et al.<br />
(2002). Effect of whole grains on insulin sensitivity in overweight<br />
hyperinsulinaemic adults. Am J Clin Nutr 75, 848–855.<br />
Pereira MA, O’Reilly E, Augustsson K, Fraser GE, Goldbourt U,<br />
Heitmann BL et al. (2004). Dietary fiber and risk of coronary heart<br />
disease: a pooled analysis of cohort studies. Arch Intern Med 164,<br />
370–376.<br />
Peterson DB, Lambert J, Gerring S et al. (1986). Sucrose in the diet<br />
of diabetic patients-just another carbohydrate? Diabetologia 29,<br />
216–220.<br />
Poppitt SD, Keogh GS, Prentice AM, Williams DE, Sonnemans HM,<br />
Valk EE et al. (2002). Long-term effects of ad libitum low-fat,<br />
high-carbohydrate diets on body weight and serum lipids in<br />
overweight subjects with metabolic syndrome. Am J Clin Nutr 75,<br />
11–20.<br />
Ramachandran A, Snehalatha C, Mary S, Mukesh B, Bhaskar AD,<br />
Vijay V (2006). The Indian Diabetes Prevention Programme shows<br />
that lifestyle modification and metformin prevent type 2 diabetes<br />
in Asian Indian subjects with impaired glucose tolerance (IDPP—1).<br />
Diabetologia 49, 289–297.<br />
Retzlaff BM, Walden CE, Dowdy AA, McCann BS, Anderson KV,<br />
Knopp RH (1995). Changes in plasma triacylglycerol concentrations<br />
among free-living hyperlipidemic men adopting different<br />
carbohydrate intakes over two years: The Dietary Alternatives<br />
Study. Am J Clin Nutr 62, 988–995.<br />
Riccardi G, Rivellese A, Pacioni D, Genovese S, Mastranzo P, Mancini<br />
M (1984). Separate influence of dietary carbohydrate and fibre on<br />
the metabolic control in diabetes. Diabetologia 26, 116–121.<br />
Rivellese A, Riccardi G, Giacco A et al. (1980). Effect of dietary fibre<br />
on glucose control and serum lipoproteins in diabetic patients.<br />
Lancet 2, 447–450.<br />
Cardiovascular disease and diabetes<br />
J Mann<br />
Salmeron J, Ascherio A, Rimm EB et al. (1997b). Dietary<br />
fiber, glycemic load, and risk of NIDDM in men. Diabetes Care<br />
20, 545–550.<br />
Salmeron J, Manson JE, Stampfer MJ et al. (1997a). Dietary fiber,<br />
glycemic load, and risk of non-insulin-dependent diabetes<br />
mellitus in women. JAMA 277, 472–477.<br />
Saris WH, Astrup A, Prentice AM et al. (2000). Randomized controlled<br />
trial of changes in dietary carbohydrate/fat ratio and simple vs<br />
complex carbohydrates on body weight and blood lipids: the<br />
CARMEN study. The Carbohydrate Ratio Management in European<br />
National diets. Int J Obes Relat Metab Disord 24, 1310–1318.<br />
Simpson HCR, Carter RD, Lousley S, Mann JL (1982). Digestible<br />
carbohydrate—an independent effect on diabetic control in type<br />
11 (non-insulin dependent) diabetic patients? Diabetologia 23,<br />
235–239.<br />
Simpson HCR, Simpson RW, Lousley S et al. (1981). A high<br />
cabohydrate leguminous fibre diet improves all aspect of diabetic<br />
control. Lancet 1, 1–5.<br />
Slama G, Haardt MJ, Jean-Joseph P et al. (1984). Sucrose taken during<br />
mixed meal has no additional hyperglycaemic action over<br />
isocaloric amounts of starch in well-controlled diabetes. Lancet<br />
2, 122–125.<br />
Slavin J (2003). Why whole grains are protective: biological<br />
mechanisms. Proc Nutr Soc 62, 129–134.<br />
Stone D, Connor W (1963). The prolonged effects of a lowcholesterol,<br />
high-carbohydrate diet upon serum lipids in diabetic<br />
patients. Diabetes 12, 127–132.<br />
Toeller M, Buyken AE, Heitkamp G, de Pergola G, Giorgino F, Fuller<br />
JH (1999). Fiber intake, serum cholesterol levels, and cardiovascular<br />
disease in European individuals with type 1 diabetes.<br />
EURODIAB IDDM Complications Study Group. Diabetes Care 22<br />
(Suppl 2), B21–B28.<br />
Trowell H (1975). Dietary-fiber hypothesis of the etiology of diabetes<br />
mellitus. Diabetes 24, 762–765.<br />
Truswell AS (1987). Sugar and health: a review. Food Technology in<br />
Australia 39, 134–140.<br />
Truswell AS (1994). Food carbohydrates and plasma lipids—an<br />
update. Am J Clin Nutr 59, 710S–718S.<br />
Truswell AS (2002). Cereal grains and coronary heart disease.<br />
Eur J Clin Nutr 56, 1–14.<br />
Tuomilehto J, Lindström J, Eriksson JG et al. (2001). For the Finnish<br />
Diabetes Prevention Study Group. Prevention of type 2 diabetes<br />
mellitus by changes in lifestyle among subjects with impaired<br />
glucose tolerance. N Engl J Med 334, 1343–1350.<br />
Turley ML, Skeaff CM, Mann JI, Cox B (1998). The effect of a low-fat,<br />
high-carbohydrate diet on serum high density lipoprotein cholesterol<br />
and triglyceride. Eur J Clin Nutr 52, 728–732.<br />
Van Dam RM, Hu FB, Rosenberg L, Krishnan S, Palmer JR (2006).<br />
Dietary calcium and magnesium, major food sources, and risk of<br />
type 2 diabetes in US black women. Diabetes Care 29, 2238–2243.<br />
Venn BJ, Mann JI (2004). Cereal grains, legumes and diabetes.<br />
Eur J Clin Nutr 58, 1443–1461.<br />
Weickert MO, Mohlig M, Schofl C et al. (2006). Cereal fiber improves<br />
whole-body insulin sensitivity in overweight and obese women.<br />
Diabetes Care 29, 775–780.<br />
WHO Technical Report Series 916 (2003). Diet, nutrition and the<br />
prevention of chronic diseases. Report of a Joint WHO/FAO Expert<br />
Consultation (Geneva).<br />
Yudkin J (1964). Dietary fat and dietary sugar in relation to ischaemic<br />
heart disease and diabetes. Lancet 4, 4–5.<br />
Zhang C, Liu S, Solomon CG et al. (2006). Dietary fiber intake,<br />
dietary glycemic load and the risk for gestational diabetes mellitus.<br />
Diabetes Care 29, 2223–2230.<br />
S111<br />
European Journal of Clinical Nutrition
REVIEW<br />
Carbohydrates and cancer: an overview of the<br />
epidemiological evidence<br />
TJ Key and EA Spencer<br />
Cancer Research UK Epidemiology Unit, University of Oxford, Oxford, UK<br />
Objective: To assess the epidemiological evidence on dietary carbohydrates and the risk of developing cancer.<br />
Method: Review of published studies, concentrating on recent systematic reviews, meta-analyses and large prospective studies.<br />
Conclusions: Carbohydrates have not been intensively investigated in epidemiological studies of diet and cancer. There is a<br />
moderately large amount of data on the possible association between dietary fibre and the risk for colorectal cancer; the results<br />
of studies have varied and no firm conclusion can be drawn, but the available data suggest that high intakes of dietary fibre<br />
possibly reduce the risk for colorectal cancer. There are also limited data which suggest that high intakes of sucrose might<br />
increase the risk for colorectal cancer and that high intakes of lactose might increase the risk for ovarian cancer. For other<br />
components of carbohydrates and other types of cancer, the available data are too sparse to draw even tentative conclusions.<br />
Further research is needed on the possible associations of carbohydrates with cancer risk.<br />
European Journal of Clinical Nutrition (2007) 61 (Suppl 1), S112–S121; doi:10.1038/sj.ejcn.1602941<br />
Keywords: carbohydrates; sugar; dietary fibre; cancer; review<br />
Introduction<br />
European Journal of Clinical Nutrition (2007) 61 (Suppl 1), S112–S121<br />
& 2007 Nature Publishing Group All rights reserved 0954-3007/07 $30.00<br />
www.nature.com/ejcn<br />
General<br />
The causes of cancer are incompletely understood, and<br />
cancers in different organs in the body can have different<br />
causes. Reviews have provided estimates that dietary factors<br />
may account for approximately 30% of cancers in industrialized<br />
countries and approximately 20% in developing<br />
countries, but it has proved difficult to clearly establish the<br />
effects of dietary factors on cancer risk (WHO, 2003a,b; Key<br />
et al., 2004). The WHO/FAO Expert Consultation in 2002<br />
categorized putative nutritional risk factors according to the<br />
strength of the evidence available (WHO, 2003a). The only<br />
diet-related factors for which there is convincing evidence of<br />
an effect on cancer risk are overweight and obesity, alcohol,<br />
aflatoxin and Chinese-style salted fish; there is also evidence<br />
that fruit and vegetables probably reduce the risk for some<br />
cancers, and that high intakes of preserved meat, saltpreserved<br />
foods and salt and very hot drinks and food<br />
probably increase the risk for some types of cancer (WHO,<br />
2003a).<br />
Correspondence: Professor TJ Key, Cancer Research UK Epidemiology Unit,<br />
University of Oxford, Richard Doll Building, Roosevelt Drive, Oxford OX3 7LF,<br />
UK.<br />
E-mail: Tim.Key@ceu.ox.ac.uk<br />
The body of evidence relating to diet and cancer risk in<br />
humans derives mostly from observational epidemiological<br />
studies conducted during the last 30 years, together with a<br />
few randomized controlled trials. Most attention has been<br />
given to a small number of prominent hypotheses in relation<br />
to certain food groups, in particular meat, fruit and<br />
vegetables; certain macronutrients, especially fat and saturated<br />
fat; and some of the micronutrients. With the<br />
exception of dietary fibre, relatively little attention has been<br />
given to the possibility that consumption of carbohydrates<br />
may affect cancer risk, although some attention has been<br />
given to sucrose and recently several studies have investigated<br />
the possible associations of glycaemic index and<br />
glycaemic load with cancer risk.<br />
Approach and methods of this overview<br />
Our aim in this overview is to summarize the current<br />
evidence and understanding of the possible role of carbohydrates<br />
in determining the risk for various cancers. This is not<br />
a systematic review of all relevant literature; rather, we have<br />
discussed previous assessments by expert panels (World<br />
Cancer Research Fund, 1997; Department of Health UK,<br />
1998; WHO, 2003a), meta-analyses and systematic reviews,<br />
and data from recent publications (1995 onwards), especially
from prospective studies which have not been considered in<br />
previous reviews. Publications were identified by searching<br />
on PubMed using the terms carbohydrate, sucrose, lactose,<br />
galactose, glycaemic index, glycaemic load, dietary fibre and<br />
individual cancer types, together with searching the reference<br />
lists of each paper identified. It is noted that the World<br />
Cancer Research Fund is currently updating their previous<br />
systematic review of diet and cancer; this will include all<br />
studies relevant to the possible associations between carbohydrate<br />
consumption and cancer risk, and is scheduled to be<br />
published during 2007.<br />
For each cancer site we summarize the findings available in<br />
relation to sucrose, glycaemic index and glycaemic load and<br />
dietary fibre. Some studies have reported on total carbohydrate;<br />
we describe these findings briefly for stomach<br />
cancer, but for other cancers have followed the conclusion<br />
of the World Cancer Research Fund report (1997), that such<br />
results are very difficult to interpret due to the differences<br />
between different types of carbohydrate, especially starches<br />
and sugars. The estimation and interpretation of glycaemic<br />
index and glycaemic load is discussed fully in the paper by<br />
Venn and Green (2007); we note here simply that glycaemic<br />
index is the blood glucose response to a test food compared<br />
to a standard reference food, that the glycaemic load is<br />
usually calculated by multiplying the glycaemic index of a<br />
food by the content of available carbohydrate, and that the<br />
interpretation of these estimates requires caution because of<br />
variations due to factors such as food preparation and total<br />
meal composition.<br />
We have restricted our review to studies with cancer as<br />
the endpoint, excluding studies of intermediate endpoints<br />
such as precancerous lesions, with the single exception<br />
of colorectal cancer, where we discuss briefly the results<br />
of randomized trials and large prospective studies with colorectal<br />
adenoma as the endpoint. We have not discussed<br />
possible mechanisms in any detail, but where the epidemiological<br />
evidence suggests that there might be an association<br />
of carbohydrates with cancer risk we have mentioned briefly<br />
potential mechanisms which have been proposed.<br />
Limitations of the research<br />
The study of carbohydrates in relation to cancer risk suffers<br />
several limitations. As with all epidemiological studies of<br />
nutrition, it is difficult to obtain valid measures of long-term<br />
dietary intake. Dietary assessment in general is not very<br />
accurate, and for carbohydrates there are some particular<br />
problems; for example, substantial amounts of sucrose can<br />
be incorporated in many manufactured foods but this can be<br />
hard to quantify in epidemiological studies; most food<br />
composition tables do not distinguish the sugars naturally<br />
present in foods such as fruits from sugars added during food<br />
manufacturing; the definition of fibre varies between food<br />
tables; the amount of fibre in foods such as bread varies<br />
several fold according to the method of milling and sieving<br />
of the grain and flour, and it is difficult to identify the exact<br />
Carbohydrates and cancer<br />
TJ Key and EA Spencer<br />
types of breads chosen and the quantity consumed using<br />
dietary questionnaires. Another problem concerns the interrelations<br />
of different dietary components; for energyproviding<br />
nutrients such as most carbohydrates (fibre is an<br />
exception because it provides little energy), the intake of<br />
carbohydrate is usually inversely correlated with the intake<br />
of some of the other macronutrients, such as fat, therefore it<br />
can be difficult to determine which macronutrient is<br />
genuinely associated with cancer risk.<br />
Review of the role of carbohydrates in the<br />
aetiology of the major cancers<br />
Cancers of the oral cavity, pharynx and oesophagus<br />
The dietary factors known to be important in the aetiology<br />
of these cancers of the upper gastro-intestinal tract are<br />
alcohol, which can cause all these cancers, and obesity,<br />
which increases the risk for adenocarcinoma of the oesophagus<br />
(WHO, 2003a; Crew and Neugut, 2004). Few studies<br />
have examined the risk for these cancers in relation to the<br />
consumption of any type of carbohydrate, although it has<br />
been suggested that dietary fibre might reduce the risk for<br />
adenocarcinoma of the oesophagus (Pera et al., 2005).<br />
Stomach cancer<br />
Diet, together with infection by the bacterium Helicobacter<br />
pylori, is thought to be important in the aetiology of<br />
stomach cancer, but the exact nature of this relationship<br />
has not been established (Crew and Neugut, 2006). Risk is<br />
probably decreased by a high intake of fruit and vegetables<br />
and increased by a high intake of salt-preserved foods and<br />
salt (Key et al., 2004). Some studies have suggested that the<br />
risk for stomach cancer might be increased by diets high in<br />
starch or total carbohydrates (Muñoz et al., 2001; De Stefani<br />
et al., 2004; Lissowska et al., 2004), but a recent large<br />
prospective study found no association (Larsson et al., 2006a)<br />
and the positive association observed in some studies may<br />
reflect the association of this cancer with low socioeconomic<br />
status. A few studies have examined the association<br />
between dietary fibre and risk for stomach cancer; one<br />
small case–control study reported an inverse association<br />
between dietary fibre and stomach cancer (De Stefani et al.,<br />
1999), but others observed no association (Botterweck et al.,<br />
2000; Muñoz et al., 2001; Nomura et al., 2003; Lissowska<br />
et al., 2004).<br />
Whereas overall stomach cancer rates have fallen in most<br />
western countries so that these countries now have lower<br />
rates for this cancer than do many developing countries, one<br />
sub-type of stomach cancer, adenocarcinoma of the gastric<br />
cardia, is increasing and is more common among western<br />
than developing countries (Crew and Neugut, 2006). The risk<br />
for this sub-type of stomach cancer is positively associated<br />
with obesity (Hampel et al., 2005), and some evidence has<br />
led to the suggestion that a high intake of cereal fibre might<br />
S113<br />
European Journal of Clinical Nutrition
S114<br />
Carbohydrates and cancer<br />
TJ Key and EA Spencer<br />
reduce the risk for this type of stomach cancer (Terry et al.,<br />
2001).<br />
Overall, the data are insufficient to draw any conclusions<br />
as to whether the consumption of carbohydrates has any<br />
effect on the risk for stomach cancer.<br />
Colorectal cancer<br />
The aetiology of colorectal cancer is poorly understood, but<br />
rates are generally much higher in western countries than<br />
in developing countries, and much evidence suggests that<br />
dietary factors are likely to be important in the development<br />
of this disease (World Cancer Research Fund, 1997; Potter,<br />
1999; Key et al., 2004). However, despite much research on<br />
diet and colorectal cancer, it is still unclear which dietary<br />
factors are important. In relation to carbohydrates, the most<br />
prominent hypothesis is that high intakes of dietary fibre<br />
may reduce risk; there has also been some research into the<br />
possible roles of sugar and, more recently, of glycaemic index<br />
and glycaemic load.<br />
Sucrose. The possibility that a high consumption of sucrose<br />
might increase the risk for colorectal cancer has been<br />
investigated in several epidemiological studies, but has not<br />
been studied extensively. In a review by Burley (1997), 18<br />
case–control and three prospective studies of sugar and<br />
colorectal cancer were considered; 7 of these 21 studies<br />
reported risk estimates consistent with a positive association<br />
between sugar consumption and the risk for colorectal<br />
cancer, but the author concluded that, due to the limited<br />
number of well-conducted studies, there was insufficient<br />
information to assess the degree of risk associated with sugar<br />
consumption. In the World Cancer Research Fund review<br />
(World Cancer Research Fund, 1997), 12 case–control studies<br />
and one cohort study were assessed (the smaller number of<br />
studies included in this review than in the Burley (1997)<br />
review is largely explained by the stricter application of<br />
criteria as to which studies were relevant among studies<br />
which reported on a limited number of foods); 8 of the 12<br />
case–control studies, and the single cohort study, reported<br />
that diets comparatively high in refined sucrose or sucrosecontaining<br />
foods were associated with increased risk of<br />
colorectal cancer. The reviewers noted that high sugar<br />
intakes are associated with other dietary factors that may<br />
affect the risk for colorectal cancer, and concluded that diets<br />
high in extrinsic (refined) sugars possibly increase the risk of<br />
Table 1 Prospective studies of sucrose intake and colorectal cancer risk<br />
colorectal cancer, and that the evidence was strongest for<br />
sucrose.<br />
Table 1 summarizes the findings of prospective studies<br />
which have reported on sucrose intake and the risk for<br />
colorectal cancer; three of these four studies were published<br />
after the systematic reviews discussed above. For each study<br />
we have given the relative risk for people with the highest<br />
level of sucrose consumption compared to people with the<br />
lowest level of consumption within the same study. Three of<br />
the four relative risks reported were above unity, but none<br />
was statistically significant (Terry et al., 2003 did not cite a<br />
relative risk but stated that there was no association with<br />
sucrose).<br />
Overall, therefore, the available data are compatible with<br />
the hypothesis that high intakes of sugar may increase the<br />
risk for colorectal cancer. However, the results from prospective<br />
studies are inconsistent, few studies have addressed<br />
this hypothesis as their primary, pre-specified objective and<br />
there may be reporting bias in that investigators may have<br />
selectively reported findings where there was a positive<br />
association of sucrose intake with the risk for colorectal<br />
cancer. Possible mechanisms by which high intakes of<br />
sucrose might increase the risk for colorectal cancer include<br />
increasing mouth to anus transit time and increasing the<br />
faecal concentration of secondary bile acids (Bostick et al.,<br />
1994).<br />
Glycaemic index and glycaemic load. Several case–control<br />
studies have suggested that there might be a positive<br />
association between diets with a high glycaemic index or<br />
glycaemic load and the risk for colorectal cancer (Slattery<br />
et al., 1997; Franceschi et al., 2001; Levi et al., 2002).<br />
Subsequently, four prospective studies have investigated<br />
the associations of estimates of glycaemic index and<br />
glycaemic load with the risk for colorectal cancer (Table 2).<br />
For glycaemic index, all four relative risks for high versus low<br />
index were above unity, but none was statistically significant.<br />
For glycaemic load, four out of five relative risks<br />
reported were greater than unity, of which one was<br />
statistically significant. The available data are too few to<br />
draw any conclusions on whether there is any association<br />
between either of these variables and the risk for colorectal<br />
cancer.<br />
Fibre. Burkitt proposed in 1969 that a high intake of dietary<br />
fibre reduces the risk for colorectal cancer (Burkitt, 1969).<br />
First author and year Country Cases Sex Comparison Relative risk (95% CI) in highest category<br />
Bostick et al., 1994 USA 212 Women Highest vs lowest fifth 1.45 (0.88–2.39)<br />
Terry et al., 2003 Canada 616 Women Highest vs lowest fifth No association<br />
Higginbotham et al., 2004a USA 174 Women Highest vs lowest fifth 1.51 (0.90–2.54)<br />
Michaud et al., 2005 USA 683 Men Highest vs lowest fifth 1.30 (0.99–1.69)<br />
Michaud et al., 2005 USA 1096 Women Highest vs lowest fifth 0.89 (0.72–1.11)<br />
European Journal of Clinical Nutrition
Table 3 Prospective studies of dietary fibre and risk for colorectal cancer<br />
First author and year Region Cases Sex Comparison Relative risk in highest category<br />
Bingham et al., 2005 Europe a<br />
1721 Both Highest vs lowest fifth 0.79 (0.63–0.99)<br />
Park et al., 2005 North America and Europe b<br />
8081 Both Highest vs lowest fifth 0.94 (0.86–1.03)<br />
Otani et al., 2006 Japan 567 Men Highest vs lowest fifth 0.92 (0.67–1.3)<br />
Otani et al., 2006 Japan 340 Women Highest vs lowest fifth 1.4 (0.95–2.2)<br />
a Data from 10 European countries.<br />
b Pooled analysis of data from 13 studies in six countries.<br />
This hypothesis has subsequently been investigated in<br />
numerous observational studies. In a meta-analysis of 13<br />
case–control studies, Howe et al. (1992) reported that people<br />
with a high intake of dietary fibre had a risk for colorectal<br />
cancer about 50% lower than that of people with a relatively<br />
low intake of dietary fibre (relative risk in highest versus<br />
lowest fifth of consumption was 0.53). However, the results<br />
from prospective studies have been much closer to null<br />
(Table 3). In the Pooling Project of Prospective Studies of Diet<br />
and Cancer, 8081 colorectal cancer cases were identified<br />
among men and women from 13 cohort studies (Park et al.,<br />
2005). For comparison of the highest versus lowest studyand<br />
sex-specific fifth of dietary fibre intake, a significant<br />
inverse association was found in the age-adjusted model<br />
(pooled relative risk 0.84; 95% confidence interval [CI],<br />
0.77–0.92). However, the association was attenuated and no<br />
longer statistically significant after adjusting for other dietary<br />
and non-dietary risk factors (pooled multivariate RR 0.94;<br />
95% CI, 0.86–1.03). In the European Prospective Investigation<br />
into Cancer and Nutrition (EPIC), a large prospective<br />
study, which was not included in the Pooling Project, the<br />
association of dietary fibre with colorectal cancer was<br />
investigated among 1721 cases from nine European countries.<br />
The relative risk for people in the highest versus the<br />
lowest fifth of dietary fibre intake, adjusted for dietary and<br />
non-dietary covariates, was 0.79 (0.63–0.99; Bingham et al.,<br />
2005). Thus the results from EPIC show a significantly lower<br />
risk for colorectal cancer associated with high-fibre intake,<br />
whereas the main results from the Pooling Project show no<br />
significant association; however, further analyses in the<br />
report from the Pooling Project show a significantly<br />
increased risk for colorectal cancer among participants with<br />
a very low intake of fibre (dietary fibre intake of o10 g/day<br />
Carbohydrates and cancer<br />
TJ Key and EA Spencer<br />
Table 2 Prospective studies of glycaemic index, glycaemic load and colorectal cancer risk<br />
First author and year Country Cases Sex Comparison Glycaemic index,<br />
relative risk in highest category<br />
Glycaemic load,<br />
relative risk in highest category<br />
Terry et al., 2003 Canada 616 Women Highest vs lowest fifth Not reported 1.05 (0.73–1.53)<br />
Higginbotham et al., 2004a USA 174 Women Highest vs lowest fifth 1.71 (0.98–2.98) 2.85 (1.40–5.80)<br />
Michaud et al., 2005 USA 683 Men Highest vs lowest fifth 1.14 (0.88–1.48) 1.32 (0.98–1.79)<br />
Michaud et al., 2005 USA 1096 Women Highest vs lowest fifth 1.08 (0.87–1.34) 0.89 (0.71–1.11)<br />
McCarl et al., 2006 USA 954 Women Highest vs lowest fifth 1.08 (0.88–1.32) 1.09 (0.88–1.35)<br />
versus intake of X30 g/day, relative risk 1.18 (1.05–1.31)).<br />
Both the Pooling Project and EPIC reported results according<br />
to the source of fibre, categorized as cereals, fruit or<br />
vegetables, but neither study showed clear differences in<br />
the association with risk according to fibre source (Bingham<br />
et al., 2005; Park et al., 2005). A further recent prospective<br />
study in Japan, which was not included in the Pooling<br />
Project, reported no significant association of dietary fibre<br />
with colorectal cancer among 907 incident cases (Otani et al.,<br />
2006).<br />
In the Women’s Health Initiative (Beresford et al., 2006), a<br />
randomized controlled trial designed to evaluate the effects<br />
of a low-fat eating pattern, the intervention aimed to reduce<br />
total fat and to increase consumption of vegetables, fruits<br />
and grains, and the intake of dietary fibre in the intervention<br />
group increased from 15.4 to 17.9 g/day. The hazard ratio for<br />
colorectal cancer during 8 years of follow-up was 1.08 (0.90–<br />
1.29), thus the small increase in dietary fibre intake did not<br />
reduce the risk of colorectal cancer. In three randomized<br />
controlled trials with colorectal adenoma as the endpoint,<br />
the recurrence of adenomas was not reduced by a fibre<br />
supplement, a high-fibre cereal supplement or by a highfibre<br />
low-fat diet (Alberts et al., 2000; Bonithon-Kopp et al.,<br />
2000; Schatzkin et al., 2000), although a recent pooled<br />
analysis of the latter two trials suggested that there was a<br />
significant reduction in adenoma recurrence among men<br />
but not among women (Jacobs et al., 2006), and observational<br />
prospective studies have suggested that high intakes of<br />
dietary fibre may reduce the risk for adenomas (Peters et al.,<br />
2003; Robertson et al., 2005). However, although some<br />
colorectal adenomas progress to cancer, many do not,<br />
therefore factors which affect adenomas may not have the<br />
same effect on colorectal cancer.<br />
S115<br />
European Journal of Clinical Nutrition
S116<br />
In summary, despite a substantial amount of research, the<br />
relationship of dietary fibre intake with the development of<br />
colorectal cancer is not well understood, and we conclude<br />
that high intakes of dietary fibre possibly reduce the risk for<br />
colorectal cancer.<br />
Several mechanisms which might explain a protective<br />
effect of fibre have been proposed; dietary fibre might reduce<br />
the risk for colorectal cancer by increasing the speed of<br />
transit of food material through the large intestine, by<br />
fermentation to short-chain fatty acids which may promote<br />
cell differentiation, induce apoptosis and/or inhibit the<br />
production of secondary bile acids by reducing luminal pH,<br />
or by other mechanisms (Hague et al., 1995; Nagengast et al.,<br />
1995; Potter, 1999).<br />
Some studies have investigated whether consumption of<br />
whole grains rather than refined grains is associated with a<br />
relatively low risk for colorectal cancer. In a review and metaanalysis<br />
in 1998, Jacobs et al. (1998) concluded that the<br />
evidence from case–control studies supported the hypothesis<br />
that a high intake of whole grains reduces the risk for<br />
colorectal cancer. However, the Pooling Project of Prospective<br />
Studies of Diet and Cancer showed no significant<br />
association between whole grain intake and the risk for<br />
colorectal cancer (Park et al., 2005).<br />
Cancer of the liver and biliary tract<br />
The major causes of liver cancer (hepatocellular carcinoma)<br />
include hepatitis viruses, cirrhosis, liver flukes and aflatoxins<br />
(WHO, 2003b; Bosch et al., 2005). Carbohydrates are not<br />
thought to be directly relevant to the aetiology of this<br />
cancer, although under poor storage conditions some staple<br />
foods such as maize and rice, which are rich sources of<br />
carbohydrates, can become contaminated with aflatoxins<br />
produced by aspergillus.<br />
For cancer of the biliary tract, Zatonski et al. (1997)<br />
reported in a case–control study that a high intake of<br />
carbohydrates was associated with a substantial increase in<br />
risk; however, this might reflect dietary changes due to longstanding<br />
symptoms of gallbladder disease. There are few<br />
other data on the possible role of carbohydrates in the<br />
aetiology of this cancer, and no conclusions can be drawn<br />
(Pandey, 2003).<br />
Cancer of the pancreas<br />
The only well-established risk factor for cancer of the<br />
pancreas is smoking (Lowenfels and Maisonneuve, 2005).<br />
Chronic pancreatitis and type-II diabetes are associated with<br />
pancreatic cancer (Michaud, 2004; Huxley et al., 2005) but<br />
some uncertainties remain as to whether these represent<br />
largely causal associations or whether these non-malignant<br />
conditions are sometimes due to the presence of early<br />
pancreatic cancer. The role of diet in the aetiology of this<br />
cancer is not well understood. Obesity is weakly positively<br />
associated with risk (Berrington de Gonzalez et al., 2003), but<br />
European Journal of Clinical Nutrition<br />
Carbohydrates and cancer<br />
TJ Key and EA Spencer<br />
no other dietary risk factors have been confirmed. Based on<br />
the association with diabetes, it has been proposed that the<br />
risk for cancer of the pancreas may be increased by a diet<br />
with a high glycaemic load and by impaired glucose<br />
tolerance, insulin resistance and hyperinsulinaemia. Three<br />
prospective studies have examined the associations of sugar,<br />
sugar-sweetened soft drinks, glycaemic index and glycaemic<br />
load with the risk for pancreatic cancer: sucrose itself was not<br />
associated with risk and the results for glycaemic index and<br />
load were inconsistent (Michaud et al., 2002; Johnson et al.,<br />
2005; Silvera et al., 2005a), whereas there was some evidence<br />
that risk increased with a high intake of sugar-sweetened soft<br />
drinks in women (Schernhammer et al., 2005). Case–control<br />
studies have suggested that high intakes of dietary fibre<br />
might reduce risk (World Cancer Research Fund, 1997), but<br />
few data are available from prospective studies (Stolzenberg-<br />
Solomon et al., 2002). There are insufficient data to draw any<br />
conclusions.<br />
Lung cancer<br />
Most cases of lung cancer are caused by smoking. The<br />
possibility that diet might also have an effect was raised by<br />
studies in the 1970s (Key et al., 2004). Subsequent research<br />
has focused on fruit, vegetables and related micronutrients,<br />
with little attention given to carbohydrates. No dietary<br />
effects on lung cancer have been established, and the weak<br />
associations between some dietary factors and risk observed<br />
in many studies might be due to residual confounding by<br />
smoking.<br />
Breast cancer<br />
The established risk factors for breast cancer are hormonal<br />
and reproductive factors (Key et al., 2003). Risk among<br />
postmenopausal women is increased by obesity (van den<br />
Brandt et al., 2000), probably because obese women have<br />
relatively high oestrogen production due to synthesis in the<br />
adipose tissue from androgen precursors (Endogenous<br />
Hormones and Breast Cancer Collaborative Group, 2003).<br />
In relation to carbohydrates, it is possible that high intakes<br />
of sucrose or high glycaemic load might increase risk by<br />
leading to obesity (see van Dam and Seidell, 2007) which<br />
causes an increase in endogenous oestrogen levels, while it is<br />
possible that high intakes of fibre might reduce risk, perhaps<br />
by interrupting the entero-hepatic circulation of oestrogens<br />
and therefore reducing oestrogen levels in the breasts (Key<br />
et al., 2003).<br />
Sucrose. Few studies have investigated the association<br />
between sucrose consumption and breast cancer risk. In<br />
previous reviews it was concluded that the little evidence<br />
available was inconsistent and therefore that no judgement<br />
was possible (World Cancer Research Fund, 1997) or that<br />
although there was some suggestion of a small increase in<br />
risk of breast cancer in association with a high consumption
of sucrose-containing foods, such as cakes and biscuits, there<br />
was insufficient evidence to conclude whether sugar has<br />
any association with breast cancer risk (Burley, 1998). Some<br />
subsequent case–control studies have also observed an<br />
increased risk for breast cancer among women with a<br />
relatively high consumption of sugar (Romieu et al., 2004)<br />
or sweet foods (Potischman et al., 2002). Subsequent<br />
prospective studies have mainly examined glycaemic index<br />
and glycaemic load (see below) rather than sucrose, and the<br />
few prospective data published on sucrose have not<br />
suggested that there is an association with breast cancer risk<br />
(Nielsen et al., 2005; Silvera et al., 2005b).<br />
Glycaemic index and glycaemic load. Seven prospective<br />
studies have investigated the associations of estimates of<br />
glycaemic index and glycaemic load with the risk for breast<br />
cancer (Table 4). For glycaemic index, the relative risks for a<br />
high index versus a low index ranged from 0.88. to 1.15,<br />
with a median of 1.03, and one of the relative risk was<br />
significantly greater than unity. For glycaemic load the<br />
relative risks for a high load versus a low load ranged from<br />
0.87 to 1.19, with a median of 1.02 and none was statistically<br />
Table 4 Prospective studies of glycaemic index, glycaemic load and breast cancer risk<br />
significant. The available data therefore suggest that there is<br />
no association between either of these variables and the risk<br />
for breast cancer.<br />
Fibre. In previous systematic reviews, the World Cancer<br />
Research Fund (1997) concluded that, based largely on the<br />
findings from case–control studies, dietary fibre possibly<br />
decreases the risk of breast cancer, whereas the Department<br />
of Health UK report concluded simply that the evidence<br />
was inconsistent (Department of Health UK, 1998). In six<br />
subsequent prospective studies, the relative risks for high<br />
versus low consumption of total dietary fibre ranged from<br />
0.58. to 1.08, with a median of 0.92 (Table 5), and one of<br />
these relative risks was significantly below unity. Analyses<br />
according to the food source of fibre, categorized as cereals,<br />
fruit and vegetables, did not show any significant associations<br />
with risk (Table 5). Overall, the data do not support the<br />
hypothesis that a high intake of dietary fibre might reduce<br />
breast cancer risk.<br />
In a prospective study, there was no clear association<br />
between the consumption of whole and refined grain and<br />
breast cancer risk (Nicodemus et al., 2001).<br />
First author and year Country Cases Menopausal status Comparison Glycaemic index, relative<br />
risk in highest category<br />
Glycaemic load, relative<br />
risk in highest category<br />
Cho et al., 2003 USA 714 Premenopausal Highest vs lowest fifth 1.05 (0.83–1.33) 1.06 (0.78–1.45)<br />
Jonas et al., 2003 USA 1442 Postmenopausal Highest vs lowest fifth 1.03 (0.87–1.22) 0.90 (0.76–1.08)<br />
Higginbotham et al., 2004b USA 946 Any Highest vs lowest fifth 1.03 (0.84–1.28) 1.01 (0.76–1.35)<br />
Holmes et al., 2004 USA 854 Premenopausal Highest vs lowest fifth 1.02 (0.82–1.28) 0.87 (0.70–1.12)<br />
Holmes et al., 2004 USA 2924 Postmenopausal Highest vs lowest fifth 1.15 (1.02–1.30) 1.03 (0.90–1.16)<br />
Nielsen et al., 2005 Denmark 634 Postmenopausal Per 10 units GI, per 100 units GL 0.94 (0.80–1.10) 1.04 (0.90–1.19)<br />
Silvera et al., 2005b Canada 1461 Any Top fifth 0.88 (0.63–1.22) 0.95 (0.79–1.14)<br />
Giles et al., 2006 Australia 324 Postmenopausal 1 s.d. 0.98 (0.88–1.10) 1.19 (0.93–1.52)<br />
Table 5 Prospective studies of dietary fibre and breast cancer risk<br />
First author<br />
and year<br />
Verhoeven<br />
et al., 1997<br />
Terry et al.,<br />
2002<br />
Cho et al.,<br />
2003<br />
Holmes<br />
et al., 2004<br />
Holmes<br />
et al., 2004<br />
Mattisson<br />
et al., 2004<br />
Giles et al.,<br />
2006<br />
Country N<br />
cases<br />
Menopausal<br />
status<br />
Carbohydrates and cancer<br />
TJ Key and EA Spencer<br />
Comparison Relative risk in highest category<br />
Total fibre Cereal fibre Fruit fibre Vegetable fibre<br />
Netherlands 650 Postmenopausal Highest<br />
vs lowest fifth<br />
0.83 (0.56–1.24)<br />
Canada 2536 Any Highest<br />
vs lowest fifth<br />
0.92 (0.78–1.09) 0.90 (0.78–1.04) 1.07 (0.92–1.25) 0.90 (0.75–1.08)<br />
USA 714 Premenopausal Highest<br />
vs lowest fifth<br />
0.88 (0.67–1.14) 0.91 (0.69–1.21) 1.13 (0.88–1.46) 0.97 (0.75–1.24)<br />
USA 854 Premenopausal Highest<br />
vs lowest fifth<br />
0.99 (0.75–1.29) 0.99 (0.78–1.25) 0.86 (0.67–1.10) 0.95 (0.72–1.25)<br />
USA 2924 Postmenopausal Highest<br />
vs lowest fifth<br />
0.96 (0.83–1.10) 1.08 (0.96–1.22) 0.92 (0.81–1.04) 0.94 (0.82–1.08)<br />
Sweden 342 Postmenopausal Highest<br />
vs lowest fifth<br />
0.58 (0.40–0.84)<br />
Australia 324 Postmenopausal 1 s.d. 1.08 (0.92–1.26) 1.08 (0.95–1.23) 1.00 (0.88–1.13) 1.07 (0.95–1.20)<br />
S117<br />
European Journal of Clinical Nutrition
S118<br />
Cancer of the endometrium<br />
The development of endometrial cancer is strongly related to<br />
hormonal factors: both parity and use of the oral contraceptive<br />
pill reduce risk, whereas obesity and oestrogen-only<br />
hormone replacement therapy increase risk (Amant et al.,<br />
2005). There are few data on dietary carbohydrates and<br />
endometrial cancer risk; available results do not suggest an<br />
association of risk with total carbohydrates or with dietary<br />
fibre, but have suggested a possible association with high<br />
glycaemic index or glycaemic load (Jain et al., 2000; Augustin<br />
et al., 2003; Folsom et al., 2003; Silvera et al., 2005c). Since<br />
obesity increases risk by about threefold (Bergstrom et al.,<br />
2001; International Agency for Research on Cancer, 2002), it<br />
is possible that any associations with the glycaemic index or<br />
load of the diet may be explained by the effect of obesity.<br />
One prospective study has reported that high consumption<br />
of whole grain is associated with a reduced risk for<br />
endometrial cancer among women who had never used<br />
hormone replacement therapy (Kasum et al., 2001).<br />
Cancer of the cervix<br />
The principal cause of cancer of the cervix is persistent<br />
infection with oncogenic strains of the human papilloma<br />
virus (zur Hausen, 2002). The possibility that dietary factors<br />
might influence risk has been investigated in a number of<br />
studies, but these have focused largely on carotenoids and<br />
folic acid, with little attention given to carbohydrates<br />
(Garcia-Closas et al., 2005).<br />
Cancer of the ovary<br />
The development of ovarian cancer is strongly related to<br />
hormonal factors: both parity and use of the oral contraceptive<br />
pill reduce risk (Banks et al., 1997). Cramer et al.<br />
(1989) proposed that a high consumption of lactose might<br />
increase the risk for ovarian cancer, perhaps due to adverse<br />
effects of galactose on the ovaries. A number of studies have<br />
subsequently addressed this hypothesis. In a meta-analysis,<br />
Larsson et al. (2006b) concluded that the results of case–<br />
control studies were heterogeneous and did not suggest an<br />
association of lactose intake with the risk for ovarian cancer.<br />
However, they reported that in the three prospective studies<br />
examined there was evidence of a significant positive<br />
association between lactose consumption and ovarian<br />
cancer risk. A pooled analysis of 12 prospective studies,<br />
which included the three studies reviewed by Larsson et al.<br />
(2006b), reported that the risk for ovarian cancer was higher<br />
among people with the highest lactose intake than among<br />
those with the lowest lactose intake (relative risk 1.19 (1.01–<br />
1.40)), although the test for a linear trend was not<br />
statistically significant (Genkinger et al., 2006). Overall, we<br />
conclude that a high intake of lactose is possibly associated<br />
with a small increase in the risk for ovarian cancer. As<br />
proposed by Cramer et al. (1989), one possible mechanism<br />
European Journal of Clinical Nutrition<br />
Carbohydrates and cancer<br />
TJ Key and EA Spencer<br />
for such an association is a direct adverse effect of galactose<br />
on the ovaries.<br />
For other carbohydrates, there are few data in relation to<br />
the risk for ovarian cancer (Schulz et al., 2004).<br />
Prostate cancer<br />
The causes of prostate cancer are poorly understood, and<br />
despite considerable research on the association of dietary<br />
factors with risk, no foods or nutrients have been clearly<br />
established as risk factors for this disease (Chan et al., 2005).<br />
Very little of this research has been focused on carbohydrates,<br />
and the data available have not suggested that<br />
there is an association between carbohydrate intake and<br />
prostate cancer risk (Chan et al., 2005).<br />
Bladder cancer<br />
The principal known risk factor for bladder cancer is tobacco<br />
(WHO, 2003b). Some studies have investigated the possible<br />
role of dietary factors, but the results have been inconclusive<br />
and little attention has been given to carbohydrates (Zeegers<br />
et al., 2004).<br />
Kidney cancer<br />
The aetiology of kidney cancer is poorly understood. Obesity<br />
increases risk, but the mechanism for this is unknown (Wolk<br />
et al., 1996). Studies have suggested possible associations<br />
with some dietary factors, but have focused mainly on the<br />
possible increased risks associated with the consumption of<br />
meat, eggs and dairy products and the possible reduction in<br />
risk associated with high intakes of fruit and vegetables. The<br />
results have been inconclusive and little attention has been<br />
given to carbohydrates (Wolk et al., 1996; Lindblad et al.,<br />
1997; Handa and Kreiger, 2002; Nicodemus et al., 2004;<br />
Rashidkhani et al., 2005).<br />
Other cancers<br />
For other cancers, not discussed above, little or no research<br />
has been conducted on whether dietary carbohydrates may<br />
have any direct impact on the development of disease.<br />
Obesity: associations with carbohydrate intake and cancer risk<br />
Obesity is an established risk factor for cancers of the<br />
oesophagus (adenocarcinoma) colorectum, breast, endometrium<br />
and kidney (International Agency for Research on<br />
Cancer, 2002; Key et al., 2004). The role of carbohydrates,<br />
especially sucrose and fibre, in the aetiology of obesity is<br />
discussed in the paper by van Dam and Seidell (2007) in this<br />
supplement. Where dietary carbohydrates contribute to<br />
obesity then they almost certainly also contribute to<br />
increasing the risk for these particular cancer sites, but this<br />
link may not be clearly seen in observational studies if the<br />
magnitude of both these associations is moderate or small.
Acrylamide<br />
Acrylamide is a chemical which has been shown to be<br />
carcinogenic in some tests on laboratory animals, and can<br />
be formed from carbohydrates during the production or<br />
cooking of foods at high temperatures. The possible effects of<br />
dietary acrylamide on cancer risk in humans have been<br />
reviewed by the Joint FAO/WHO Expert Committee on Food<br />
Additives (http://www.who.int/foodsafety/chem/chemicals/<br />
acrylamide/en/). This committee concluded in 2005 that,<br />
based on comparisons with the intake shown to cause<br />
mammary tumours in rats, acrylamide intakes in humans are<br />
generally low but that there is a possible human health<br />
concern for high consumers. Epidemiological data available<br />
are limited but have not suggested any association of<br />
estimated dietary acrylamide intake with cancer risk in<br />
humans (Mucci and Adami, 2005; Pelucchi et al., 2006;<br />
Wilson et al., 2006).<br />
Conclusions and recommendations<br />
Carbohydrates as a group have not been intensively<br />
investigated in epidemiological studies of diet and cancer.<br />
There is a moderately large amount of data on the possible<br />
association between dietary fibre and the risk for colorectal<br />
cancer; the results of studies have varied and no firm<br />
conclusion can be drawn, but the available data suggest<br />
that high intakes of dietary fibre possibly reduce the risk<br />
for colorectal cancer. There are also limited data which<br />
suggest that high intakes of sucrose might increase the<br />
risk for colorectal cancer and that high intakes of lactose<br />
might increase the risk for ovarian cancer. For other<br />
components of carbohydrates and other types of cancer,<br />
the available data are too sparse to draw any conclusions.<br />
Further research is needed on the possible associations<br />
of carbohydrates with cancer risk. The systematic review<br />
being conducted by the World Cancer Research Fund<br />
will provide a detailed update in 2007. Further information<br />
could also be provided by extending the Pooling Project<br />
of Prospective Studies of Diet and Cancer to examine<br />
specific classes of carbohydrates in relation to a range of<br />
cancer sites.<br />
Acknowledgements<br />
We thank Dr Arthur Schatzkin, Professor Stephanie Smith-<br />
Warner, Professor Carolyn Summerbell, Dr Anne Tjonneland,<br />
Professor PA van den Brandt and Dr Martin Wiseman for their<br />
constructive comments. The authors are supported by Cancer<br />
Research UK.<br />
Conflict of interest<br />
During the preparation and peer-review of this paper in<br />
2006, the authors and peer-reviewers declared the following<br />
interests.<br />
Carbohydrates and cancer<br />
TJ Key and EA Spencer<br />
Authors<br />
Professor Timothy J Key: None declared.<br />
Dr Elizabeth A Spencer: None declared.<br />
Peer-reviewers<br />
Dr Arthur Schatzkin: None declared.<br />
Professor Stephanie Smith-Warner: None declared.<br />
Professor Carolyn Summerbell: None declared.<br />
Dr Anne Tjonneland: None declared.<br />
Professor PA van den Brandt: None declared.<br />
Dr Martin Wiseman: None declared.<br />
References<br />
Alberts DS, Martinez ME, Roe DJ, Guillen-Rodriguez JM, Marshall JR,<br />
van Leeuwen JB et al. (2000). Lack of effect of a high-fiber cereal<br />
supplement on the recurrence of colorectal adenomas. Phoenix<br />
Colon Cancer Prevention Physicians’ Network. N Engl J Med 342,<br />
1156–1162.<br />
Amant F, Moerman P, Neven P, Timmerman D, Van Limbergen E,<br />
Vergote I (2005). Endometrial cancer. Lancet 366, 491–505.<br />
Augustin LS, Gallus S, Bosetti C, Levi F, Negri E, Franceschi S et al.<br />
(2003). Glycemic index and glycemic load in endometrial cancer.<br />
Int J Cancer 105, 404–407.<br />
Banks E, Beral V, Reeves G (1997). The epidemiology of epithelial<br />
ovarian cancer: a review. Int J Gynecol Cancer 7, 425–438.<br />
Beresford SA, Johnson KC, Ritenbaugh C, Lasser NL, Snetselaar LG,<br />
Black HR et al. (2006). Low-fat dietary pattern and risk of colorectal<br />
cancer: the women’s health initiative randomized controlled<br />
dietary modification trial. JAMA 295, 643–654.<br />
Bergstrom A, Pisani P, Tenet V, Wolk A, Adami HO (2001).<br />
Overweight as an avoidable cause of cancer in Europe. Int J Cancer<br />
91, 421–430.<br />
Berrington de Gonzalez A, Sweetland S, Spencer E (2003). A metaanalysis<br />
of obesity and the risk of pancreatic cancer. Br J Cancer 89,<br />
519–523.<br />
Bingham SA, Norat T, Moskal A, Ferrari P, Slimani N, Clavel-<br />
Chapelon F et al. (2005). Is the association with fiber from foods<br />
in colorectal cancer confounded by folate intake? Cancer Epidemiol<br />
Biomarkers Prev 14, 1552–1556.<br />
Bonithon-Kopp C, Kronborg O, Giacosa A, Rath U, Faivre J (2000).<br />
Calcium and fibre supplementation in prevention of<br />
colorectal adenoma recurrence: a randomised intervention trial.<br />
European cancer prevention organisation study group. Lancet 356,<br />
1300–1306.<br />
Bosch FX, Ribes J, Cleries R, Diaz M (2005). Epidemiology of<br />
hepatocellular carcinoma. Clin Liver Dis 9, 191–211.<br />
Bostick RM, Potter JD, Kushi LH, Sellers TA, Steinmetz KA, McKenzie<br />
DR et al. (1994). Sugar, meat, and fat intake, and non-dietary risk<br />
factors for colon cancer incidence in Iowa women (United States).<br />
Cancer Causes Control 5, 38–52.<br />
Botterweck AA, van den Brandt PA, Goldbohm RA (2000). Vitamins,<br />
carotenoids, dietary fiber, and the risk of gastric carcinoma: results<br />
from a prospective study after 6.3 years of follow-up. Cancer 88,<br />
737–748.<br />
Burkitt DP (1969). Related disease—related cause? Lancet 2,<br />
1229–1231.<br />
Burley VJ (1997). Sugar consumption and cancers of the digestive<br />
tract. Eur J Cancer Prev 6, 422–434.<br />
Burley VJ (1998). Sugar consumption and human cancer in sites<br />
other than the digestive tract. Eur J Cancer Prev 7, 253–277.<br />
Chan JM, Gann PH, Giovannucci EL (2005). Role of diet in prostate<br />
cancer development and progression. J Clin Oncol 23, 8152–8160.<br />
Cho E, Spiegelman D, Hunter DJ, Chen WY, Colditz GA, Willett WC<br />
(2003). Premenopausal dietary carbohydrate, glycemic index,<br />
S119<br />
European Journal of Clinical Nutrition
S120<br />
Carbohydrates and cancer<br />
TJ Key and EA Spencer<br />
glycemic load, and fiber in relation to risk of breast cancer. Cancer<br />
Epidemiol Biomarkers Prev 11, 1153–1158.<br />
Cramer DW, Harlow BL, Willett WC, Welch WR, Bell DA, Scully RE<br />
et al. (1989). Galactose consumption and metabolism in relation<br />
to the risk of ovarian cancer. Lancet 8, 66–71.<br />
Crew KD, Neugut AI (2004). Epidemiology of upper gastrointestinal<br />
malignancies. Semin Oncol 31, 450–464.<br />
Crew KD, Neugut AI (2006). Epidemiology of gastric cancer. World J<br />
Gastroenterol 12, 354–362.<br />
De Stefani E, Boffetta P, Deneo-Pellegrini H, Mendilaharsu M,<br />
Carzoglio JC, Ronco A (1999). Carbohydrates and risk of stomach<br />
cancer in Uruguay. Int J Cancer 82, 618–621.<br />
De Stefani E, Correa P, Boffetta P, Deneo-Pellegrini H, Ronco AL,<br />
Mendilaharsu M (2004). Dietary patterns and risk of gastric cancer:<br />
a case–control study in Uruguay. Gastric Cancer 7, 211–220.<br />
Department of Health UK (1998). Nutritional aspects of the development<br />
of cancer (Report of the Working Group on Diet and Cancer of the<br />
Committee on Medical Aspects of Food and Nutrition Policy). The<br />
Stationery Office: London.<br />
Endogenous Hormones and Breast Cancer Collaborative Group<br />
(2003). Body mass index, serum sex hormones, and breast cancer<br />
risk in postmenopausal women. J Natl Cancer Inst 95, 1218–1226.<br />
Folsom AR, Demissie Z, Harnack L (2003). Iowa women’s health<br />
study: glycemic index, glycemic load, and incidence of endometrial<br />
cancer: the Iowa women’s health study. Nutr Cancer 46, 119–124.<br />
Franceschi S, Dal Maso L, Augustin L, Negri E, Parpinel M, Boyle P<br />
et al. (2001). Dietary glycemic load and colorectal cancer risk.<br />
Ann Oncol 12, 173–178.<br />
Garcia-Closas R, Castellsague X, Bosch X, Gonzalez CA (2005). The<br />
role of diet and nutrition in cervical carcinogenesis: a review of<br />
recent evidence. Int J Cancer 117, 629–637.<br />
Genkinger JM, Hunter DJ, Spiegelman D, Anderson KE, Arslan A,<br />
Beeson WL et al. (2006). Dairy products and ovarian cancer: a<br />
pooled analysis of 12 cohort studies. Cancer Epidemiol Biomarkers<br />
Prev 15, 364–372.<br />
Giles GG, Simpson JA, English DR, Hodge AM, Gertig DM, Macinnis<br />
RJ et al. (2006). Dietary carbohydrate, fibre, glycaemic index,<br />
glycaemic load and the risk of postmenopausal breast cancer. Int J<br />
Cancer 118, 1843–1847.<br />
Hague A, Elder DJ, Hicks DJ, Paraskeva C (1995). Apoptosis in<br />
colorectal tumour cells: induction by the short chain fatty acids<br />
butyrate, propionate and acetate and by the bile salt deoxycholate.<br />
Int J Cancer 60, 400–406.<br />
Hampel H, Abraham NS, El-Serag HB (2005). Meta-analysis: obesity<br />
and the risk for gastroesophageal reflux disease and its complications.<br />
Ann Intern Med 143, 199–211.<br />
Handa K, Kreiger N (2002). Diet patterns and the risk of renal cell<br />
carcinoma. Public Health Nutr 5, 757–767.<br />
Higginbotham S, Zhang ZF, Lee IM, Cook NR, Buring JE, Liu S<br />
(2004b). Dietary glycemic load and breast cancer risk in the<br />
Women’s Health Study. Cancer Epidemiol Biomarkers Prev 13, 65–70.<br />
Higginbotham S, Zhang ZF, Lee IM, Cook NR, Giovannucci E, Buring<br />
JE et al. (2004a). Dietary glycemic load and risk of colorectal cancer<br />
in the women’s health study. J Natl Cancer Inst 96, 229–233.<br />
Holmes MD, Liu S, Hankinson SE, Colditz GA, Hunter DJ, Willett WC<br />
(2004). Dietary carbohydrates, fiber, and breast cancer risk. Am J<br />
Epidemiol 159, 732–739.<br />
Howe GR, Benito E, Castelleto R, Cornee J, Esteve J, Gallagher RP<br />
et al. (1992). Dietary intake of fiber and decreased risk of cancers of<br />
the colon and rectum: evidence from the combined analysis of 13<br />
case-control studies. J Natl Cancer Inst 84, 1887–1896.<br />
http://www.who.int/foodsafety/chem/chemicals/acrylamide/en/.<br />
Huxley R, Ansary-Moghaddam A, Berrington de Gonzalez A, Barzi F,<br />
Woodward M (2005). Type-II diabetes and pancreatic cancer: a<br />
meta-analysis of 36 studies. Br J Cancer 92, 2076–2083.<br />
International Agency for Research on Cancer (2002). Overweight and<br />
lack of exercise linked to increased cancer risk. In: IARC Handbooks<br />
of Cancer Prevention, volume 6 World Health Organisation:<br />
Geneva.<br />
European Journal of Clinical Nutrition<br />
Jacobs Jr DR, Marquart L, Slavin J, Kushi LH (1998). Whole-grain<br />
intake and cancer: an expanded review and meta-analysis.<br />
Nutr Cancer 30, 85–96.<br />
Jacobs ET, Lanza E, Alberts DS, Hsu CH, Jiang R, Schatzkin A et al.<br />
(2006). Fiber, sex, and colorectal adenoma: results of a pooled<br />
analysis. Am J Clin Nutr 83b, 343–349.<br />
Jain MG, Rohan TE, Howe GR, Miller AB (2000). A cohort study of<br />
nutritional factors and endometrial cancer. Eur J Epidemiol 16,<br />
899–905.<br />
Jonas CR, McCullough ML, Teras LR, Walker-Thurmond KA, Thun MJ<br />
et al. (2003). Dietary glycemic index, glycemic load, and risk<br />
of incident breast cancer in postmenopausal women. Cancer<br />
Epidemiol Biomarkers Prev 12, 573–577.<br />
Johnson KJ, Anderson KE, Harnack L, Hong CP, Folsom AR (2005).<br />
No association between dietary glycemic index or load and<br />
pancreatic cancer incidence in postmenopausal women. Cancer<br />
Epidemiol Biomarkers Prev 14, 1574–1575.<br />
Kasum CM, Nicodemus K, Harnack LJ, Jacobs Jr DR, Folsom AR, Iowa<br />
Women’s Health Study (2001). Whole grain intake and incident<br />
endometrial cancer: the Iowa Women’s Health Study. Nutr Cancer<br />
39, 180–186.<br />
Key TJ, Allen NE, Spencer EA, Travis RC (2003). Nutrition and breast<br />
cancer. Breast 12, 412–416.<br />
Key TJ, Schatzkin A, Willett WC, Allen NE, Spencer EA, Travis RC<br />
(2004). Diet, nutrition and the prevention of cancer. Public Health<br />
Nutr 7 (1A), 187–200.<br />
Larsson SC, Bergkvist L, Wolk A (2006a). Glycemic load, glycemic<br />
index and carbohydrate intake in relation to risk of stomach<br />
cancer: a prospective study. Int J Cancer 118, 3167–3169.<br />
Larsson SC, Orsini N, Wolk A (2006b). Milk, milk products and<br />
lactose intake and ovarian cancer risk: a meta-analysis of<br />
epidemiological studies. Int J Cancer 118, 431–441.<br />
Levi F, Pasche C, Lucchini F, Bosetti C, La Vecchia C (2002).<br />
Glycaemic index, breast and colorectal cancer. Ann Oncol 13,<br />
1688–1689.<br />
Lindblad P, Wolk A, Bergstrom R, Adami HO (1997). Diet and risk of<br />
renal cell cancer: a population-based case–control study. Cancer<br />
Epidemiol Biomarkers Prev 6, 215–223.<br />
Lissowska J, Gail MH, Pee D, Groves FD, Sobin LH, Nasierowska-<br />
Guttmejer A et al. (2004). Diet and stomach cancer risk in Warsaw,<br />
Poland. Nutr Cancer 48, 149–159.<br />
Lowenfels AB, Maisonneuve P (2005). Risk factors for pancreatic<br />
cancer. J Cell Biochem 95, 649–656.<br />
Mattisson I, Wirfalt E, Johansson U, Gullberg B, Olsson H, Berglund<br />
G (2004). Intakes of plant foods, fibre and fat and risk of breast<br />
cancer–a prospective study in the Malmo diet and cancer cohort.<br />
Br J Cancer 90, 122–127.<br />
McCarl M, Harnack L, Limburg PJ, Anderson KE, Folsom AR (2006).<br />
Incidence of colorectal cancer in relation to glycemic index and<br />
load in a cohort of women. Cancer Epidemiol Biomarkers Prev 15,<br />
892–896.<br />
Michaud DS (2004). Epidemiology of pancreatic cancer. Minerva Chir<br />
59, 99–111.<br />
Michaud DS, Fuchs CS, Liu S, Willett WC, Colditz GA, Giovannucci E<br />
(2005). Dietary glycemic load, carbohydrate, sugar, and colorectal<br />
cancer risk in men and women. Cancer Epidemiol Biomarkers Prev<br />
14, 138–147.<br />
Michaud DS, Liu S, Giovannucci E, Willett WC, Colditz GA,<br />
Fuchs CS (2002). Dietary sugar, glycemic load, and<br />
pancreatic cancer risk in a prospective study. J Natl Cancer Inst<br />
94, 1293–1300.<br />
Mucci LA, Adami HO (2005). The role of epidemiology in understanding<br />
the relationship between dietary acrylamide and cancer<br />
risk in humans. Adv Exp Med Biol 561, 39–47.<br />
Muñoz N, Plummer M, Vivas J, Moreno V, De Sanjose S, Lopez G et al.<br />
(2001). A case–control study of gastric cancer in Venezuela. Int J<br />
Cancer 93, 417–423.<br />
Nagengast FM, Grubben MJ, van Munster IP (1995). Role of bile acids<br />
in colorectal carcinogenesis. Eur J Cancer 31A, 1067–1070.
Nicodemus KK, Jacobs Jr DR, Folsom AR (2001). Whole and refined<br />
grain intake and risk of incident postmenopausal breast cancer<br />
(United States). Cancer Causes Control 12, 917–925.<br />
Nicodemus KK, Sweeney C, Folsom AR (2004). Evaluation of dietary,<br />
medical and lifestyle risk factors for incident kidney cancer in<br />
postmenopausal women. Int J Cancer 108, 115–121.<br />
Nielsen TG, Olsen A, Christensen J, Overvad K, Tjonneland A (2005).<br />
Dietary carbohydrate intake is not associated with the breast<br />
cancer incidence rate ratio in postmenopausal Danish women.<br />
J Nutr 135, 124–128.<br />
Nomura AM, Hankin JH, Kolonel LN, Wilkens LR, Goodman MT,<br />
Stemmermann GN (2003). Case–control study of diet and other<br />
risk factors for gastric cancer in Hawaii (United States). Cancer<br />
Causes Control 14, 547–558.<br />
Otani T, Iwasaki M, Ishihara J, Sasazuki S, Inoue M, Tsugane S et al.<br />
(2006). Dietary fiber intake and subsequent risk of colorectal<br />
cancer: the Japan public health center-based prospective study. Int<br />
J Cancer 119, 1475–1480.<br />
Pandey M (2003). Risk factors for gallbladder cancer: a reappraisal.<br />
Eur J Cancer Prev 12, 15–24.<br />
Park Y, Hunter DJ, Spiegelman D, Bergkvist L, Berrino F, van den<br />
Brandt PA et al. (2005). Dietary fiber intake and risk of colorectal<br />
cancer: a pooled analysis of prospective cohort studies. JAMA 294,<br />
2849–2857.<br />
Pelucchi C, Galeone C, Levi F, Negri E, Franceschi S, Talamini R et al.<br />
(2006). Dietary acrylamide and human cancer. Int J Cancer 118,<br />
467–471.<br />
Pera M, Manterola C, Vidal O, Grande L (2005). Epidemiology of<br />
esophageal adenocarcinoma. J Surg Oncol 92, 151–159.<br />
Peters U, Sinha R, Chatterjee N, Subar AF, Ziegler RG, Kulldorff M<br />
et al. (2003). Dietary fibre and colorectal adenoma in a colorectal<br />
cancer early detection programme. Lancet 361, 1491–1495.<br />
Potischman N, Coates RJ, Swanson CA, Carroll RJ, Daling JR, Brogan<br />
DR et al. (2002). Increased risk of early-stage breast cancer related<br />
to consumption of sweet foods among women less than age 45 in<br />
the United States. Cancer Causes Control 13, 937–946.<br />
Potter JD (1999). Colorectal cancer: molecules and populations.<br />
J Natl Cancer Inst 91, 916–932.<br />
Rashidkhani B, Akesson A, Lindblad P, Wolk A (2005). Major dietary<br />
patterns and risk of renal cell carcinoma in a prospective cohort of<br />
Swedish women. JNutr135, 1757–1762.<br />
Robertson DJ, Sandler RS, Haile R, Tosteson TD, Greenberg ER, Grau<br />
M et al. (2005). Fat, fiber, meat and the risk of colorectal<br />
adenomas. Am J Gastroenterol 100, 2789–2795.<br />
Romieu I, Lazcano-Ponce E, Sanchez-Zamorano LM, Willett W,<br />
Hernandez-Avila M (2004). Carbohydrates and the risk of breast<br />
cancer among Mexican women. Cancer Epidemiol Biomarkers Prev<br />
13, 1283–1289.<br />
Schatzkin A, Lanza E, Corle D, Lance P, Iber F, Caan B et al. (2000).<br />
Lack of effect of a low-fat, high-fiber diet on the recurrence of<br />
colorectal adenomas. Polyp Prevention Trial Study Group. N Engl J<br />
Med 342, 1149–1155.<br />
Schernhammer ES, Hu FB, Giovannucci E, Michaud DS, Colditz GA,<br />
Stampfer MJ et al. (2005). Sugar-sweetened soft drink consumption<br />
and risk of pancreatic cancer in two prospective cohorts. Cancer<br />
Epidemiol Biomarkers Prev 14, 2098–2105.<br />
Schulz M, Lahmann PH, Riboli E, Boeing H (2004). Dietary<br />
determinants of epithelial ovarian cancer: a review of the<br />
epidemiologic literature. Nutr Cancer 50, 120–140.<br />
Silvera SA, Jain M, Howe GR, Miller AB, Rohan TE (2005b). Dietary<br />
carbohydrates and breast cancer risk: a prospective study of the<br />
Carbohydrates and cancer<br />
TJ Key and EA Spencer<br />
roles of overall glycemic index and glycemic load. Int J Cancer 114,<br />
653–658.<br />
Silvera SA, Rohan TE, Jain M, Terry PD, Howe GR, Miller AB (2005a).<br />
Glycemic index, glycemic load, and pancreatic cancer risk<br />
(Canada). Cancer Causes Control 16, 431–436.<br />
Silvera SA, Rohan TE, Jain M, Terry PD, Howe GR, Miller AB (2005c).<br />
Glycaemic index, glycaemic load and risk of endometrial<br />
cancer: a prospective cohort study. Public Health Nutr 8,<br />
912–919.<br />
Slattery ML, Benson J, Berry TD, Duncan D, Edwards SL, Caan BJ,<br />
Potter JD (1997). Dietary sugar and colon cancer. Cancer Epidemiol<br />
Biomarkers Prev 6, 677–685.<br />
Stolzenberg-Solomon RZ, Pietinen P, Taylor PR, Virtamo J, Albanes D<br />
(2002). Prospective study of diet and pancreatic cancer in male<br />
smokers. Am J Epidemiol 155, 783–792.<br />
Terry P, Jain M, Miller AB, Howe GR, Rohan TE (2002). No association<br />
among total dietary fiber, fiber fractions, and risk of breast cancer.<br />
Cancer Epidemiol Biomarkers Prev 11, 1507–1508.<br />
Terry P, Lagergren J, Ye W, Wolk A, Nyren O (2001). Inverse<br />
association between intake of cereal fiber and risk of gastric cardia<br />
cancer. Gastroenterology 120, 387–391.<br />
Terry PD, Jain M, Miller AB, Howe GR, Rohan TE (2003). Glycemic<br />
load, carbohydrate intake, and risk of colorectal cancer in<br />
women: a prospective cohort study. J Natl Cancer Inst 95,<br />
914–916.<br />
van Dam RM, Seidell JC (2007). Carbohydrate intake and obesity. Eur<br />
J Clin Nutr 61 (Suppl 1), S75–S99.<br />
van den Brandt PA, Spiegelman D, Yaun SS, Adami HO, Beeson L,<br />
Folsom AR et al. (2000). Pooled analysis of prospective cohort<br />
studies on height, weight, and breast cancer risk. Am J Epidemiol<br />
152, 514–527.<br />
Venn BJ, Green TJ (2007). Glycemic index and glycemic load:<br />
measurement issues and their effect on diet–disease relationships.<br />
Eur J Clin Nutr 61 (Suppl 1), S122–S131.<br />
Verhoeven DT, Assen N, Goldbohm RA, Dorant E, van ‘t Veer P,<br />
Sturmans F et al. (1997). Vitamins C and E, retinol, beta-carotene<br />
and dietary fibre in relation to breast cancer risk: a prospective<br />
cohort study. Br J Cancer 75, 149–155.<br />
Wilson KM, Rimm EB, Thompson KM, Mucci LA (2006). Dietary<br />
acrylamide and cancer risk in humans: a review. J Verbr Lebensm 1,<br />
19–27.<br />
Wolk A, Lindblad P, Adami HO (1996). Nutrition and renal cell<br />
cancer. Cancer Causes Control 7, 5–18.<br />
World Cancer Research Fund (1997). Food, Nutrition, and the<br />
Prevention of Cancer: A Global Perspective. American Institute for<br />
Cancer Research: Washington DC.<br />
World Health Organization (2003a). Diet, Nutrition and the Prevention<br />
of Chronic Diseases. WHO Technical Report Series 916. WHO:<br />
Geneva.<br />
World Health Organization (2003b). World Cancer Report. BW Stewart<br />
and P Kleihues (eds) IARC Press: Lyon.<br />
Zatonski WA, Lowenfels AB, Boyle P, Maisonneuve P, Bueno de<br />
Mesquita HB, Ghadirian P et al. (1997). Epidemiologic aspects of<br />
gallbladder cancer: a case-control study of the SEARCH program of<br />
the international agency for research on cancer. J Natl Cancer Inst<br />
89, 1132–1138.<br />
Zeegers MP, Kellen E, Buntinx F, van den Brandt PA (2004). The<br />
association between smoking, beverage consumption, diet<br />
and bladder cancer: a systematic literature review. World J Urol<br />
21, 392–401.<br />
zur Hausen H (2002). Papillomaviruses and cancer: from basic studies<br />
to clinical application. Nat Rev Cancer 2, 342–350.<br />
S121<br />
European Journal of Clinical Nutrition
REVIEW<br />
Glycemic index and glycemic load: measurement<br />
issues and their effect on diet–disease relationships<br />
BJ Venn and TJ Green<br />
Department of Human Nutrition, University of Otago, Dunedin, New Zealand<br />
Glycemic index (GI) describes the blood glucose response after consumption of a carbohydrate containing test food relative to a<br />
carbohydrate containing reference food, typically glucose or white bread. GI was originally designed for people with diabetes as<br />
a guide to food selection, advice being given to select foods with a low GI. The amount of food consumed is a major<br />
determinant of postprandial hyperglycemia, and the concept of glycemic load (GL) takes account of the GI of a food and the<br />
amount eaten. More recent recommendations regarding the potential of low GI and GL diets to reduce the risk of chronic<br />
diseases and to treat conditions other than diabetes, should be interpreted in the light of the individual variation in blood<br />
glucose levels and other methodological issues relating to measurement of GI and GL. Several factors explain the large inter- and<br />
intra-individual variation in glycemic response to foods. More reliable measurements of GI and GL of individual foods than are<br />
currently available can be obtained by studying, under standard conditions, a larger number of subjects than has typically been<br />
the case in the past. Meta-analyses suggest that foods with a low GI or GL may confer benefit in terms of glycemic control in<br />
diabetes and lipid management. However, low GI and GL foods can be energy dense and contain substantial amounts of sugars<br />
or undesirable fats that contribute to a diminished glycemic response. Therefore, functionality in terms of a low glycemic<br />
response alone does not necessarily justify a health claim. Most studies, which have demonstrated health benefits of low GI or GL<br />
involved naturally occurring and minimally processed carbohydrate containing cereals, vegetables and fruit. These foods have<br />
qualities other than their immediate impact on postprandial glycemia as a basis to recommend their consumption. When the GI<br />
or GL concepts are used to guide food choice, this should be done in the context of other nutritional indicators and when values<br />
have been reliably measured in a large group of individuals.<br />
European Journal of Clinical Nutrition (2007) 61 (Suppl 1), S122–S131; doi:10.1038/sj.ejcn.1602942<br />
Keywords: glycemic index; glycemic load; methodology; diet–disease relationships<br />
Introduction<br />
European Journal of Clinical Nutrition (2007) 61 (Suppl 1), S122–S131<br />
& 2007 Nature Publishing Group All rights reserved 0954-3007/07 $30.00<br />
www.nature.com/ejcn<br />
The glycemic index (GI) concept was introduced by Jenkins<br />
et al. (1981) in the early 1980s as a ranking system for<br />
carbohydrates based on their immediate impact on blood<br />
glucose levels. GI was originally designed for people with<br />
diabetes as a guide to food selection, advice being given to<br />
select foods with a low GI (Jenkins et al., 1983). Lower GI<br />
foods were considered to confer benefit as a result of the<br />
relatively low glycemic response following ingestion compared<br />
with high GI foods. The GI concept has been extended<br />
to also take into account the effect of the total amount of<br />
carbohydrate consumed. Thus glycemic load (GL), a product<br />
of GI and quantity of carbohydrate eaten provides an<br />
Correspondence: Dr B Venn, PO Box 56, Department of Human Nutrition,<br />
University of Otago, Dunedin, New Zealand.<br />
E-mail: bernard.venn@stonebow.otago.ac.nz<br />
indication of glucose available for energy or storage following<br />
a carbohydrate containing meal. Although GI is usually<br />
tested on individual foods, there are methods described<br />
whereby the GI and GL of meals and habitual diets can be<br />
estimated (Wolever and Jenkins, 1986; Salmeron et al.,<br />
1997a). In addition to a role in the treatment of diabetes,<br />
low GI and GL diets have more recently been widely<br />
recommended for the prevention of chronic diseases including<br />
diabetes, obesity, cancer and heart disease and in the<br />
treatment of cardiovascular risk factors, especially dyslipidaemia<br />
(Jenkins et al., 2002).<br />
The usefulness of GI and GL has been questioned on<br />
several counts: failure to consider the insulin response<br />
(Coulston et al., 1984), the high intra- and inter-subject<br />
variation in glucose response to a food (Pi-Sunyer, 2002), and<br />
a loss of discriminating power when foods are combined in a<br />
mixed meal (Flint et al., 2004). Furthermore, foods with a<br />
high sugar (sucrose) content and those containing both
carbohydrate and fat may have a low GI, but may not be<br />
regarded as particularly appropriate choices because of their<br />
energy density and nature of dietary fat (Freeman, 2005).<br />
This review considers the reliability of the measurement and<br />
the practical application of GI. Its value in relating dietary<br />
attributes to chronic diseases is considered in other papers in<br />
this series.<br />
Definition and measurement<br />
GI is defined as the blood glucose response measured as area<br />
under the curve (AUC) in response to a test food consumed<br />
by an individual under standard conditions expressed as a<br />
percentage of the AUC following consumption of a reference<br />
food consumed by the same person on a different day (FAO/<br />
WHO, 1998). The test food and reference food (usually 50 g<br />
glucose) must contain the same amount of available<br />
carbohydrate (Figure 1). It is important to standardize GI<br />
testing conditions, and the procedure for the measurement<br />
of GI is described in detail in the 1998 FAO/WHO report on<br />
carbohydrates in human nutrition (FAO, 1998). Hundreds of<br />
foods have been tested for GI with the aim of ranking foods<br />
within and between food categories. A GI classification<br />
system is in common use in which foods are categorized as<br />
having low (o55), medium (55–69) or high GI (470) (Brand-<br />
Miller et al., 2003a).<br />
Glucose, a monosaccharide, induces a large glycemic<br />
response and is often used as the reference food and assigned<br />
a GI of 100. Some polysaccharides, such as those present in<br />
instant potato for example, may also result in large glycemic<br />
Blood glucose (mmol/L)<br />
10<br />
8<br />
6<br />
4<br />
2<br />
0<br />
Blood glucose (mmol/L)<br />
8<br />
7<br />
6<br />
5<br />
4<br />
3<br />
2<br />
1<br />
0<br />
0 30 60 90 120<br />
Time (min)<br />
responses when consumed in an amount containing 50 g<br />
available carbohydrate because of rapid and near complete<br />
digestion and absorption in the small intestine. From the<br />
International Tables, the GI for instant potato, determined as<br />
the mean of six studies, was 85 (Foster-Powell et al., 2002).<br />
Sucrose, a disaccharide of glucose and fructose, has a<br />
somewhat lower GI of 68, resulting from the fructose<br />
component which has an exceptionally low GI of 19. Adding<br />
protein or fat to a carbohydrate containing food can also<br />
lower overall GI (Miller et al., 2006). Resistant starch and<br />
dietary fibre are largely undigested and not absorbed in the<br />
small intestine and therefore contribute little to postprandial<br />
glycemia. However, a lowering of glycemic response has<br />
been found when purified extracts of fibre, particularly of<br />
the type that forms a viscous gel in water such as guar gum,<br />
are added to a test food in sufficient quantity (Jenkins et al.,<br />
1976; Doi et al., 1979; Wolever et al., 1991; Tappy et al.,<br />
1996). GI cannot be predicted from the fibre content of a<br />
carbohydrate containing food or from the terms wholemeal<br />
and wholegrain for which there are no universally accepted<br />
definitions. For example, from the International Tables, the<br />
mean GI of wholemeal bread from 13 studies is 71, while<br />
that of white wheat bread (mean of six studies) is 70 (Foster-<br />
Powell et al., 2002). Whole grains, when largely intact, have<br />
been found to lower GI (Jenkins et al., 1986; 1988; Liljeberg<br />
et al., 1992; Granfeldt et al., 1994; 1995), but wholegrain<br />
products contain a variable proportion of intact grains.<br />
GI does not take into account the amount of carbohydrate<br />
consumed, an important determinant of glycemic response.<br />
For example, watermelon has a high GI (Foster-Powell et al.,<br />
2002) and may not be considered a good food selection as<br />
0 30 60 90 120<br />
Time (min)<br />
Blood glucose (mmol/L)<br />
Glycemic index and glycemic load<br />
BJ Venn and TJ Green<br />
10<br />
8<br />
6<br />
4<br />
2<br />
0<br />
0 30 60 90 120<br />
Time (min)<br />
Figure 1 Example of an individual’s data used to estimate glycemic index (GI). Area under the curve (AUC) refers to the area included between<br />
the baseline and incremental blood glucose points when connected by straight lines. The area under each incremental glucose curve is<br />
calculated using the trapezoid rule (note: only areas above the baseline are used). GI ¼ AUCFood/mean (AUCReference) 100.<br />
S123<br />
European Journal of Clinical Nutrition
S124<br />
Blood glucose iAUC (mmol/L·min)<br />
350<br />
300<br />
250<br />
200<br />
150<br />
100<br />
50<br />
0<br />
0 12.5 25 37.5 50 62.5 75<br />
Available carbohydrate (g)<br />
Figure 2 Blood glucose area under the curve (AUC) responses to<br />
increasing amounts of glucose and granola bar tested in 20 people.<br />
part of a low GI diet. However, watermelon only contains 5 g<br />
of carbohydrate per 100 g, thus it would have a minimal<br />
glycemic effect. GL takes into account how much carbohydrate<br />
a serving of a food contains and may be determined by<br />
indirect and direct methods.<br />
The indirect method involves multiplying the GI of a food<br />
by the amount of available carbohydrate in the portion of<br />
food consumed. This method implies that GL is directly<br />
proportional to the amount of the particular food eaten. This<br />
is perhaps counterintuitive, because the blood glucose AUC<br />
does not increase in direct proportion to the amount<br />
consumed. For example, eating six times the amount of<br />
bread results in an approximately threefold increase in AUC<br />
(Brand-Miller et al., 2003c). In other words, as the amount of<br />
food increased, the rate of increase in AUC declines, an effect<br />
shown in Figure 2 (Venn et al., 2006). Therefore, it is implicit<br />
in the calculation of GL that the AUC for both the test and<br />
the reference foods are attenuated to the same degree with<br />
increasing amounts consumed.<br />
Glycemic equivalence is a method of directly determining<br />
GL. For each subject an AUC for glucose is calculated for a<br />
range of doses of the reference food measured on different<br />
days. A standard curve is constructed for each subject with<br />
increasing amounts of the reference on the x axis with its<br />
corresponding AUC for blood glucose on the y axis (Venn<br />
et al., 2006). The AUC in response to a food consumed at any<br />
portion size, typically a usual serving, is compared to that<br />
individual’s glucose standard curve as depicted in Figure 3<br />
(Venn et al., 2006). Using this technique, glycemic equivalence<br />
is the amount of glucose that would theoretically<br />
produce the same blood glucose AUC as that particular<br />
portion size of food consumed. Major drawbacks of the direct<br />
method are increased time and cost required to determine<br />
the GL of a food. The reference must be tested at several<br />
doses in each subject and the GL of a food cannot be<br />
estimated from currently available GI values. Data from our<br />
laboratory support the premise that GL is linearly related to<br />
the amount of food consumed that is, GL calculated using<br />
European Journal of Clinical Nutrition<br />
Glycemic index and glycemic load<br />
BJ Venn and TJ Green<br />
Blood glucose iAUC (mmol/L·min)<br />
175<br />
150<br />
125<br />
100<br />
75<br />
50<br />
25<br />
0<br />
iAUC food<br />
0 12.5 25 37.5 50 62.5 75<br />
Glycaemic load (g)<br />
GL direct measure<br />
Figure 3 Example of an individual’s standard glucose curve<br />
generated using glucose doses of 12.5, 25, 50 and 75 g. A test food<br />
is consumed and the resulting area under the curve (AUC) used to<br />
impute the glycemic load. AUC refers to the area included between<br />
the baseline and incremental blood glucose points when connected<br />
by straight lines. The area under each incremental glucose curve is<br />
calculated using the trapezoid rule (Note: only areas above the<br />
baseline are used.)<br />
Table 1 Examples of GL arranged by classification taken from the<br />
international tables (Foster-Powell et al., 2002)<br />
Food GI Serving<br />
size (g)<br />
Available<br />
carbohydrate (g)<br />
Watermelon 72 120 6 4<br />
Ice cream (high fat) 37 50 9 4<br />
Mashed potato 74 150 20 15<br />
Macaroni 47 180 48 23<br />
Parboiled rice 64 150 36 23<br />
Chocolate bar 65 60 40 26<br />
Porridge 58 250 22 13<br />
Corn flakes 81 30 26 21<br />
Abbreviations: GI, glycaemic index; GL, glycaemic load.<br />
GI available carbohydrate agrees well with GL measured<br />
directly, at least when food is consumed over a range of usual<br />
intakes (Venn et al., 2006). A GL classification system is used<br />
in which foods are categorized as having low (p10), medium<br />
(410–o20) or high GL (X20).<br />
The relationship between GI and GL is not straightforward;<br />
for example, a high GI food can have a low GL if eaten<br />
in small quantities. Conversely, a low GI food can have a<br />
high GL dependent upon the portion size eaten. This effect is<br />
demonstrated in Table 1, in which various foods from the<br />
International Tables have been selected (Foster-Powell et al.,<br />
2002). A ‘serving size’ of watermelon, a high GI food, has the<br />
same GL as a serving size of high fat ice cream, a low GI food.<br />
Mashed potato and macaroni may be contrasted with the<br />
lower GI food (macaroni) having a higher GL per serving.<br />
GL
Foods having very different nutrient profiles can have<br />
similar GIs and GLs per serving, such as parboiled rice and<br />
a chocolate bar. GI and GL can also be positively related to<br />
each other, for example comparing porridge and corn flakes,<br />
in which the higher GI food (corn flakes) predicts a higher<br />
GL per serving. Although a food is assigned a fixed GI value,<br />
any food could have a low, medium or high GL because GL is<br />
dependent upon the amount eaten.<br />
The glycemic load of a diet can be calculated by summing<br />
the glycemic loads for all foods consumed in the diet. A low<br />
GL diet could be achieved by choosing small servings of<br />
foods relatively high in carbohydrate having a low GI.<br />
Alternatively, a low GL diet could comprise foods having a<br />
high fat, high protein, low carbohydrate content. The<br />
heterogeneity of foods that could be used to construct a<br />
low GL diet indicates that food selection should not be made<br />
on GL alone. Knowledge of other qualities of the food, for<br />
example fat content, type of fat, energy density, fibre<br />
content and appropriate serving size should be taken into<br />
consideration.<br />
GI and GL labelling<br />
Voluntary GI labelling of foods by food manufacturers occurs<br />
in several countries. Products may need to meet nutritional<br />
compositional requirements to be eligible for GI testing and<br />
labelling, such as a limit on the type or amount of fat<br />
contained in the food. However, compositional requirements<br />
are not standardized either within a country, where<br />
more than one laboratory may provide a GI-testing service,<br />
or among countries around the world. Standardized eligibility<br />
criteria would give consumers, health professionals<br />
and regulators more confidence in the suitability of a food to<br />
display its GI. It could be argued that GL should be labeled<br />
because GL more closely reflects the glycaemic impact<br />
associated with consuming an amount of the food.<br />
Factors affecting the measurement<br />
Postprandial glucose concentrations are dependent upon<br />
several factors. In people with impaired glucose tolerance<br />
and diabetes the glycemic response measured as blood<br />
glucose AUC is increased compared with healthy individuals.<br />
However, GI is the AUC in response to a test food relative to<br />
that of a reference food and given that each person acts as<br />
his/her own control the GI of a food should not differ in<br />
those with and without abnormalities of glucose metabolism.<br />
GI testing has been carried out, and values published in<br />
international tables, using normoglycaemic individuals as<br />
well as those with impaired glucose tolerance (Foster-Powell<br />
et al., 2002). Despite broadly comparable results Brouns et al.<br />
(2005) have recommended using people with normal glucose<br />
tolerance for the determination of GI because variability in<br />
glycemic response is greater in people with impaired glucose<br />
tolerance or diabetes.<br />
Glycemic index and glycemic load<br />
BJ Venn and TJ Green<br />
The use of a test food referenced to a standard could be<br />
used as an argument that GI is a property of food, rather than<br />
a characteristic of the individual consuming the food.<br />
However, postprandial glycemia may be influenced by the<br />
extent to which individuals chew food prior to swallowing<br />
(Read et al., 1986; Suzuki et al., 2005) as well as the expected<br />
biological variation in rates and extent of digestion and<br />
absorption. These variables may not apply equally to test and<br />
reference foods; a reference food commonly used is a glucose<br />
beverage. The observed intra- and inter-individual differences<br />
in GI and GL which are apparent even when measured<br />
under standardized conditions may be further exaggerated<br />
by differing physical and chemical nature of apparently<br />
similar food products (Wolever, 1990). For example, gelatinization,<br />
the process of rendering starches water soluble;<br />
retrogradation, a realignment of starch molecules during<br />
cooling and storage; starch type; and dietary fibre, are all<br />
factors with potential glycemic-modifying effects. Some of<br />
these factors are affected by cooking times and methods, and<br />
the temperature of the food consumed, potentially providing<br />
a source of variability both in GI measurement and in<br />
day-to-day variability of glycemic responses to the same<br />
food.<br />
Reliability of GI values for individual foods<br />
The 1998 Joint FAO/WHO Expert Consultation on carbohydrates<br />
suggested that for the determination of the GI of a<br />
food, six subjects would be required; although the basis for<br />
this number was not given (FAO, 1998). More recently, it has<br />
been recommended that a sample of 10 should be used, on<br />
the grounds that it allows for a ‘reasonable degree of power<br />
and precision for most purposes’, although it was acknowledged<br />
that more people would be necessary if greater<br />
precision was required (Brouns et al., 2005). However, there<br />
are strong indications that using 10 people is insufficient to<br />
obtain reliable estimates of GI, particularly if GI levels are<br />
high, because variance increases with the mean. Large<br />
variation in glycemic response between- and within-people<br />
makes it difficult to show differences among foods. For<br />
example, Henry et al. (2005) tested eight varieties of potato<br />
in groups of 10 people and reported mean7s.e.m. GIs<br />
ranging from 5673 to94716. Despite a wide range of GIs, it<br />
was not possible to demonstrate statistically significant<br />
differences among the potato varieties. Because of the large<br />
variation there is the potential to miss-classify foods into<br />
categories of low, medium, or high GI.<br />
In an inter-laboratory study, seven laboratories tested the<br />
GIs of centrally provided foods, each using 8–12 participants<br />
(Wolever et al., 2003). A range in mean GI values among<br />
laboratories was obtained for each of the test foods; potato<br />
65.2744.6–98.5720.6; bread (locally sourced) 64.2715.4–<br />
78.9726.1; rice 54.8724.1–85.0728.6; spaghetti 36.4735.8<br />
–69.9718.8; and barley 23.2724.6–47.1749.7. Rice would<br />
have been classified as low GI (54.8724.1) by one laboratory,<br />
S125<br />
European Journal of Clinical Nutrition
S126<br />
medium GI (62.6725.0, 63.378.1, 68.4748.0) by three<br />
laboratories, and high GI (76.9712.9, 85.0728.6,<br />
87.0775.9) by the other three laboratories. It appeared that<br />
results were more consistent when GI was calculated using<br />
capillary blood obtained by finger prick rather than venous<br />
blood. A much better estimate was obtained when data from<br />
the laboratories using capillary blood were combined. Using<br />
a pooled sample of 47 participants, mean GI for rice was 69<br />
with narrower confidence intervals (95% CI: 63, 76). Thus, in<br />
addition to indicating the most appropriate method for<br />
blood sampling, the data demonstrate the enhanced reliability<br />
of a measurement when studying large numbers of<br />
individuals. Most of the variation in GI differences between<br />
laboratories was attributed to random within-person variability<br />
(Wolever et al., 2003). There is no ready explanation for<br />
this random day-to-day variability in glycemic response that<br />
occurs even to repeat challenges of the same food under<br />
standardized conditions.<br />
Within-person variability can be reduced to some extent<br />
by increasing the number of replicates for each subject. The<br />
current recommendation is that the reference food should be<br />
tested two or three times in each subject (Brouns et al., 2005).<br />
However, within-person variability is also present for the test<br />
food. Using data obtained from our laboratory in which a<br />
test food and a reference food were tested three times and<br />
four times, respectively, in 20 people, we have calculated<br />
sample sizes necessary to be confident of a difference of 10<br />
GI units between foods. The sample size is dependent on the<br />
level of GI. For a difference of 10 units, between 30 and 40<br />
for instance, it was estimated that 25 people would be<br />
required if the food was tested once and the reference food<br />
three times, or 19 people if the test and reference foods were<br />
both tested twice. These estimates are comparable with the<br />
sample size estimates shown by Brouns et al. (2005). The<br />
same likelihood of detecting differences of 10 GI units<br />
between foods having GIs toward the upper end of the scale<br />
(70 and 80), would require a sample size of 114 people<br />
testing the food once and the reference food three times, or<br />
86 people if the test and reference foods are both tested<br />
twice. Increasing the sample and/or repeating the test food<br />
would appreciably increase the cost of testing, perhaps a<br />
necessary expense, if more precision in GI measurement is to<br />
be achieved.<br />
Mixed meals<br />
The ranking of meals by GI has been found to reflect the<br />
ranking of the major carbohydrate component in the meal.<br />
For example, baked potato was found to have a higher GI<br />
than rice (Jenkins et al., 1984). When these foods were<br />
incorporated into meals, there was a tendency for the<br />
postprandial glycemic ranking of the meals to be maintained<br />
according to the GI ranking of the food that provided the<br />
major carbohydrate source (Wolever and Jenkins, 1986).<br />
However, there is debate as to whether summing the<br />
European Journal of Clinical Nutrition<br />
Glycemic index and glycemic load<br />
BJ Venn and TJ Green<br />
individual GIs of foods in a meal can be used to reliably<br />
calculate the GI of the meal. Flint et al. (2004) used GI values<br />
taken from the International Table of GI (Foster-Powell et al.,<br />
2002) to predict the GI of 13 simple breakfast meals, each<br />
providing 50 g available carbohydrate. There was no association<br />
between the GI calculated from the Tables and the<br />
measured GI. It was pointed out that the energy content of<br />
the meals had not been standardized (Brand-Miller and<br />
Wolever, 2005); however, it might be argued that GI testing<br />
is standardized to an available amount of carbohydrate, not<br />
to energy content. In another study, a closer relationship was<br />
reported between calculated GI and glycemic responses to<br />
various breakfast meals, but the agreement was not entirely<br />
consistent (Wolever et al., 2006). Two of the meals, a bagel<br />
with cream cheese and orange juice; and a meal of rye bread,<br />
margarine, cereal, milk, sugar and orange juice each<br />
contained approximately 69 g available carbohydrate. The<br />
mean7s.e. glycemic responses to the meals, measured as<br />
AUC, were similar (148714 and 143713 mmol/l min, respectively).<br />
However, using published values the calculated<br />
GIs of the meals were predicted to be 67 and 51, respectively.<br />
Sugiyama et al. (2003) found that the ingestion of milk with<br />
rice resulted in a significantly lower GI than when rice was<br />
eaten alone. When cheese was added to potato, a dramatic<br />
lowering of the potato’s mean7s.e.m. GI from 9378 to<br />
3975 was found (Henry et al., 2006). Thus while it is clear<br />
that combining foods does influence GI and that the<br />
addition of protein and fat to a carbohydrate containing<br />
meal can appreciably reduce the glycemic response (Collier<br />
and O’Dea, 1983; Nuttall et al., 1984) there is insufficient<br />
information to accurately predict the effect of different<br />
combinations of foods. Aggregating the GIs of individual<br />
components of a meal does not reliably predict the observed<br />
GI of the meal as a whole.<br />
Published glycemic index and glycemic load values<br />
Care must be taken when using published GI and GL values.<br />
Variability of GI and GL among apparently similar foods has<br />
led to recommendations that some foods, for example rice,<br />
should be tested in the geographical region in which they are<br />
consumed. This may be necessary to account for differences<br />
in variety and cooking conditions (Foster-Powell et al., 2002).<br />
Testing in specific populations may also be important if GI is<br />
not solely a property of food. Mettler et al. (2007) found that<br />
the training state of athletes affected GI of the same food. It<br />
was suggested that Flint et al. (2004) who reported that<br />
combining the GI of single foods did not predict the GI of<br />
mixed meals, chose incorrect GI values from published tables<br />
(Wolever et al., 2006). This problem is likely to occur when<br />
multiple entries for the same food are presented. For<br />
example, in the International Tables baked Russet Burbank<br />
potatoes eaten without added fat (that is butter) are listed as<br />
having GI values of 56, 78, 94 and 111 (Foster-Powell et al.,<br />
2002). Multiple entries for the same foods also complicate
esearch activities and food selection for individuals trying to<br />
follow a low GI diet. For example, boiled carrots have mean<br />
GI values listed in the International Tables of 92, 49 and 32<br />
(Foster-Powell et al., 2002). If GI were a major criterion in<br />
food selection, a value of 92 might have discouraged people<br />
from eating boiled carrots. On the other hand, low GI values<br />
of 32 and 49 would have suggested boiled carrots as a highly<br />
suitable choice. It has been suggested that reliability of the<br />
estimates might have contributed to the differences in GI<br />
(Foster-Powell et al., 2002), an argument in favour of<br />
studying large numbers of individuals under the standardized<br />
conditions described above.<br />
Dietary instruments<br />
Questions have been raised regarding the appropriateness of<br />
the dietary instruments used when examining the relationship<br />
between GI and GL and various diseases in observational<br />
studies (Pi-Sunyer, 2002). Food frequency<br />
questionnaires used in several studies were not designed<br />
specifically to obtain information on GI and GL. Individual<br />
foods were not assigned GI or GL values, rather they were<br />
collapsed into categories. Most of the published studies have<br />
not described how foods were grouped, but an Australian<br />
study gave some insight into the process (Hodge et al., 2004).<br />
The food frequency questionnaire used in the Australian<br />
study had a category of ‘cereal foods, cakes and biscuits’.<br />
Within that category were 17 items, two of which were<br />
‘muesli’ and ‘other breakfast cereals’. A GI value of 46% was<br />
assigned to muesli and 62% to ‘other breakfast cereals.’ The<br />
use of a single value to describe the GI of breakfast cereals<br />
seemed inappropriate given that the GIs of Australian cereals<br />
range from 30 (All-Bran) to 85 (Rice Bubbles) (Foster-Powell<br />
et al., 2002). Pi-Sunyer has drawn attention to the even<br />
broader groupings that were used in the Health Professionals’<br />
Follow-up Study and the Nurses’ Health Study.<br />
Categories used were—all whole grains; all refined grains;<br />
all cold breakfast cereals; all fruit; and all fruit juices (Pi-<br />
Sunyer, 2002). Such observations do raise some concerns<br />
about the degree of confidence that can be placed on the<br />
findings of these cohort studies with respect to dietary GI or<br />
GL and disease outcome. On the other hand one might argue<br />
that misclassification leads to an underestimate of the true<br />
association between GI and GL and disease (see paper by<br />
Mann in this series). The use of dietary questionnaires<br />
specifically designed to gather information on GI and GL,<br />
such as those currently being developed, may be expected to<br />
generate data which can be interpreted with greater<br />
confidence (Flood et al., 2006; Neuhouser et al., 2006).<br />
Overall comment on reliability<br />
Biological variation, differing chemical and physical structure<br />
of apparently similar foods and method of food<br />
Glycemic index and glycemic load<br />
BJ Venn and TJ Green<br />
preparation and consumption may all contribute to the<br />
marked inter- and intra-individual variation observation in<br />
the glycemic response to foods. GI and GL testing on larger<br />
numbers of individuals than previously undertaken or<br />
increasing the number of replicates carried out on an<br />
individual will improve the reliability and precision of GI<br />
estimates. Specifying origin and other details of product (for<br />
example, variety of fruit or vegetable) will further enhance<br />
confidence in the measurement. However, the usefulness of<br />
the index will always be limited to some extent by the<br />
variation between and within individuals. It is common<br />
practice to place foods into broad categories of GI. Classification<br />
works well when there is a large separation in GI values<br />
between foods, but there are still uncertainties into which<br />
category of GI many foods belong because of the variability<br />
around group mean GI values. More certainty in the relative<br />
ranking of foods by GI would be attained if larger group sizes<br />
were used to estimate GI. The degree to which limitations of<br />
currently available data influence present use of the concepts<br />
of GI and GL in understanding cause or influencing<br />
management of disease is considered further in the section<br />
on recommendations.<br />
Glycemic index and glycemic load and human<br />
health<br />
The GI/GL concept has been widely advocated as a means of<br />
identifying foods that might protect against chronic diseases<br />
or be useful in disease management. Potential protection<br />
against diabetes and cardiovascular disease is considered in<br />
the paper by Mann (2007). Several other health issues are<br />
discussed here.<br />
Long-term glycemic control in diabetes<br />
The GI concept was used in the management of diabetes<br />
before being used in other clinical situations. Glycated<br />
haemoglobin (HbA1C) is measured in people with diabetes<br />
to assess overall glycemic control over a period of approximately<br />
2–3 months prior to the measurement being made<br />
(Goldstein et al., 2004). Fructosamine, another glycated<br />
protein, is also occasionally used as a measure of glucose<br />
control over the preceding 2–3 weeks. Several studies have<br />
been carried out in people with diabetes to examine the<br />
effect on HbA1C or fructosamine of diets differing principally<br />
with respect to GI. Data from these studies form the basis of<br />
two meta-analyses. There was a modest reduction in HbA 1C<br />
in people consuming low GI diets, estimated to be 0.33%<br />
units (95% CI: 0.07, 0.59) in one meta-analysis (Brand-Miller<br />
et al., 2003b), and 0.27% units (95% CI: 0.03, 0.5) in the<br />
other (Opperman et al., 2004). Fructosamine concentrations<br />
were also lower in favour of low GI dietary interventions. In<br />
one meta-analysis, the estimated difference between low and<br />
high GI dietary periods was 0.19 mmol/l (95% CI: 0.06, 0.32)<br />
S127<br />
European Journal of Clinical Nutrition
S128<br />
(Brand-Miller et al., 2003b), and in the other 0.1 mmol/l<br />
(95% CI: 0.00, 0.20) (Opperman et al., 2004). Although these<br />
reductions in HbA1C or fructosamine are small it is important<br />
to note that these effects are in addition to other dietary<br />
changes or pharmacological treatments used in diabetes<br />
management. Whether changes in glycated proteins of this<br />
magnitude affect long-term health outcomes is untested.<br />
Trials using drugs such as acarbose, which lower postprandial<br />
hyperglycaemia, suggest that acarbose may be effective in<br />
reducing cardiovascular complications in people with type 2<br />
diabetes mellitus (Hanefeld et al., 2004). However, reductions<br />
in HbA1C of 0.6–0.8% were achieved in these trials (Hanefeld<br />
et al., 2004; van de Laar et al., 2005). Nevertheless, any<br />
dietary strategy that resulted in improved glycaemic control<br />
would be welcome and given the difference in the acute<br />
effect that low and high GI foods have on postprandial<br />
hyperglycaemia, the proposition that changing foods in the<br />
diet from high to low GI might improve markers of glycemic<br />
control is entirely plausible. However, some caveats may be<br />
appropriate. In many of the studies included in the metaanalyses<br />
described above, the low GI foods tended to have<br />
low energy density and a high fibre content, such as whole<br />
fruit, oats, whole grain, pulses and pasta (Frost et al., 1998;<br />
Heilbronn et al., 2002). Thus, modest changes in glycaemic<br />
control were achieved under study conditions that required<br />
people to be compliant with relatively major changes in<br />
dietary habits. The findings may not necessarily apply to the<br />
many low GI functional and convenience foods currently<br />
available, which may be relatively high in sugars and energy<br />
dense.<br />
Glycemic index and glycemic load and blood lipids<br />
Relationships between dietary GI and blood lipid fractions<br />
have been assessed in several prospective observational<br />
studies. A reasonably consistent finding has been an inverse<br />
association between fasting HDL cholesterol concentrations<br />
and dietary GI (Liu et al., 2001; Amano et al., 2004; Slyper<br />
et al., 2005), although one study found no association<br />
(Murakami et al., 2006). Ma et al. (2006) found inverse<br />
associations between dietary GI and GL in a cross-sectional<br />
analysis, but the associations were lost during follow-up. An<br />
inverse association between GI and HDL-cholesterol concentration<br />
has also been found in a nationally representative<br />
sample of US adults (Ford and Liu, 2001).<br />
Findings from intervention trials differed from those of<br />
observational studies. Kelly et al. (2004) conducted a metaanalysis<br />
of intervention trials that had examined the effect of<br />
low GI diets on coronary heart disease risk factors. Results<br />
from that analysis showed limited and weak evidence of an<br />
inverse relationship between GI and total cholesterol, with<br />
no effect of dietary GI on LDL and HDL cholesterol,<br />
triglycerides, fasting glucose and fasting insulin. Opperman<br />
et al. (2004) conducted a meta-analysis of 14 randomized<br />
controlled trials relating to the effects on blood lipids of<br />
European Journal of Clinical Nutrition<br />
Glycemic index and glycemic load<br />
BJ Venn and TJ Green<br />
altering the GI of test diets. There was a difference in total<br />
and LDL-cholesterol concentrations of 0.33 (95% CI: 0.18,<br />
0.47) mmol/l and 0.15 (95% CI: 0.00, 0.31) mmol/l, favoring<br />
the low GI diets, but no difference in HDL cholesterol<br />
concentrations between people consuming low and high GI<br />
diets.<br />
Thus, the reasonably consistent finding in observational<br />
studies of an inverse association between dietary GI and HDL<br />
cholesterol concentrations is not confirmed by meta-analyses<br />
of randomized controlled trials in which people<br />
consumed diets that had been designed specifically to<br />
achieve differences in GI (Kelly et al., 2004; Opperman<br />
et al., 2004). On the other hand, the meta-analyses show<br />
differences in total and LDL cholesterol not found in the<br />
observational data. There is no obvious explanation for this<br />
inconsistency.<br />
Glycemic index and glycemic load and insulin<br />
response<br />
The GI of a food is affected not only by the rate of absorption<br />
of carbohydrate, but also by the rate of glucose removal from<br />
the plasma. When comparing two breakfast cereals with<br />
different GI values (131733 and 54.577.2), the rate of<br />
glucose removal was a major determinant of postprandial<br />
hyperglycaemia (Schenk et al., 2003). It was found that the<br />
lower GI breakfast cereal had induced hyperinsulinaemia<br />
earlier than the higher GI cereal, resulting in an earlier<br />
increase in more rapid removal of glucose from circulation. It<br />
has been known for some time that insulin response cannot<br />
be predicted based solely on the glycemic response to a food.<br />
Collier and O’Dea (1983) found marked differences in the<br />
glycemic response to potato with or without added butter,<br />
but a very similar insulin response. The effect of GI on<br />
insulin response may also depend upon insulin sensitivity.<br />
Dietary GI has not been shown to have a marked effect on<br />
insulin sensitivity whereas dietary fibre has (McAuley and<br />
Mann, 2006).<br />
Glycemic index and satiety<br />
An important justification for the claim of an overall health<br />
benefit of low GI foods is that low GI foods may aid weight<br />
control because they promote satiety (Brand-Miller et al.,<br />
2002). Ideally, weight loss studies comparing low and high<br />
GI diets would need to assess differences between diets based<br />
on ad libitum intake to show that the apparently greater<br />
satiating effect of low GI foods led to a reduced energy<br />
intake. Holt and colleagues have carried out the most<br />
comprehensive study investigating the relationship between<br />
GI and satiety, reporting the same work in several articles<br />
(Holt et al., 1995; Holt et al., 1996; Holt et al., 1997). Isoenergetic<br />
(1000 kJ) servings of 38 foods were tested for satiety<br />
rating and glucose and insulin response. The food with the
highest satiety score was boiled potato. When comparing a<br />
high GI food (potato) with a low GI food (white pasta) on an<br />
iso-energetic, equi-carbohydrate (49 g) basis, the high GI<br />
food had the highest satiety rating. The opposite was true<br />
when comparing oranges (lower GI) and white bread (higher<br />
GI), where the lower GI food had the higher satiety rating.<br />
Porridge and natural muesli had similar glycemic and<br />
insulinemic scores, but porridge had a greater satiety index<br />
than muesli (Po0.001). These results suggest that there is<br />
little or no relationship between GI and satiety, at least when<br />
comparing food portions of equal energy content. Rather,<br />
energy density appeared to be inversely related to satiety,<br />
presumably because of the high bulk required to obtain a<br />
serving containing 1000 kJ when low energy-dense foods<br />
were tested. When iso-energetic, iso-volumetric carbohydrate-containing<br />
beverages were tested, high GI beverages<br />
resulted in lower energy intakes during a subsequent meal,<br />
while low GI beverages were found not to suppress appetite<br />
and food intake in the short-term (Anderson et al., 2002). A<br />
review of the effect of glycemic carbohydrates on short-term<br />
satiety has been published (Anderson and Woodend, 2003).<br />
One conclusion was that high GI carbohydrates suppress<br />
short-term (1 h) food intake more effectively than low GI<br />
carbohydrates, whereas low GI carbohydrates appeared to be<br />
more effective over longer periods (6 h).<br />
How dietary GI and GL affects satiety and food intake over<br />
a number of years is not entirely clear. The effectiveness of<br />
dietary GI and GL on weight loss or maintenance is covered<br />
by van Damm in this series. The results of several observational<br />
studies have shown little difference in body mass<br />
index (BMI) across categories of GI and GL (Salmeron et al.,<br />
1997a, b; Hodge et al., 2004; Schulze et al., 2004). Murakami<br />
et al. (2006) found a positive association between GI and<br />
body mass index in Japanese female farmers, but no<br />
association between GL and body mass index. On the other<br />
hand, Ford and Liu reported inverse associations between GI<br />
and GL and body mass index in a nationally representative<br />
sample of US adults (Ford and Liu, 2001). These contradictory<br />
findings might suggest that dietary GI and GL is not<br />
a major determinant of dietary energy intake over the longterm.<br />
A plausible reason is that GI appears not to be related<br />
to energy density. Potatoes and lentils for example represent<br />
foods with widely differing GIs but comparable energy<br />
densities of around 3–4 kJ/g. On the other hand, cakes,<br />
cookies and fresh oranges have similar GIs in the low to<br />
medium range, but energy densities some 10-fold different<br />
(Holt et al., 1996).<br />
Recommendations<br />
The FAO/WHO Report on Carbohydrates in Human Nutrition<br />
suggests that the concept of GI provides a useful means<br />
of selecting the most appropriate carbohydrate containing<br />
foods for the maintenance of health and the treatment of<br />
several disease states (FAO, 1998). Since the publication of<br />
Glycemic index and glycemic load<br />
BJ Venn and TJ Green<br />
that report some of the limitations of the GI and GL concepts<br />
have become increasingly apparent. With regard to measurement<br />
there is clearly a need to study a larger number of<br />
subjects under standard conditions to obtain more precise<br />
estimates of the GI and GL of individual foods. The<br />
introduction of instruments for assessing dietary intake in<br />
epidemiological studies that have been designed to include<br />
more direct measures of GI and GL will enhance the<br />
confidence in findings from such studies. Despite these<br />
reservations it does appear that distinguishing between foods<br />
with appreciable differences in the indices may produce<br />
some benefit in terms of glycemic control in diabetes and<br />
lipid management. However, caution should be exercised in<br />
food choice based solely on GI or GL because low GI and GL<br />
foods may be energy dense and contain substantial amounts<br />
of sugars or undesirable fatty acids that contribute to the<br />
diminished glycemic response but not necessarily to good<br />
health outcomes. This may apply especially to some of the<br />
manufactured products that have been GI and GL tested and<br />
are available in many countries. Given that most of the<br />
studies which have demonstrated a health benefit of low GI<br />
and GL involved the use of naturally occurring and<br />
minimally processed foods it would seem to be appropriate<br />
for such products to be further tested for their health benefits<br />
directly, rather than on the basis of their functionality (that<br />
is, a low glycemic response). Although some data suggest<br />
that the low GI effect is not explained by the dietary fibre<br />
content of the foods it remains conceivable that food<br />
structure or composition explain some of the health<br />
benefits. GI may be a useful indicator to guide food choice<br />
if for example bread with a high GI is replaced on a slice-forslice<br />
basis with a lower GI bread, thereby achieving a lower<br />
GL. However, the complexity of the relationship between GI<br />
and GL is probably not well understood whereby GI and the<br />
amount of a food eaten are both important determinants of<br />
the postprandial glycemic response. For the present it would<br />
seem appropriate that when GI or GL are used to guide food<br />
choice, it should only be done in the context of other<br />
nutritional indicators and when values have been measured<br />
in a large group of individuals.<br />
Acknowledgements<br />
We wish to thank Dr Jennie Brand-Miller, Professor Gary<br />
Frost, Professor Philip James, Professor Simin Liu, Professor<br />
Jim Mann, Dr Gabriele Riccardi, Dr M Robertson and<br />
Professor HH Vorster for their valuable comments.<br />
Conflict of interest<br />
During the preparation and peer-review of this paper in<br />
2006, the authors and peer-reviewers declared the following<br />
interests.<br />
Authors<br />
Dr Bernard J Venn: None declared.<br />
S129<br />
European Journal of Clinical Nutrition
S130<br />
Dr Tim Green: Affiliated with GI Otago, a commercial<br />
glycemic index testing service.<br />
Peer-reviewers<br />
Dr Jennie Brand-Miller: Publishing books in the popular<br />
press: ‘The New Glucose Revolution Series’; Director of a<br />
University-based service for GI testing; Director of a not-forprofit<br />
food-labelling programme based on the GI.<br />
Professor Gary Frost: None declared.<br />
Professor Philip James: None declared.<br />
Professor Simin Liu: None declared.<br />
Professor Jim Mann: None declared.<br />
Dr Gabriele Riccardi: None declared.<br />
Dr M Robertson: Research Grant from National Chemical<br />
and Starch.<br />
Professor HH Vorster: Member and Director of the Africa<br />
Unit for Transdisciplinary health Research (AUTHeR), Research<br />
grant from the South African Sugar Association.<br />
References<br />
Glycemic index and glycemic load<br />
BJ Venn and TJ Green<br />
Amano Y, Kawakubo K, Lee JS, Tang AC, Sugiyama M, Mori K (2004).<br />
Correlation between dietary glycemic index and cardiovascular<br />
disease risk factors among Japanese women. Eur J Clin Nutr 58,<br />
1472–1478.<br />
Anderson GH, Catherine NL, Woodend DM, Wolever TM (2002).<br />
Inverse association between the effect of carbohydrates on blood<br />
glucose and subsequent short-term food intake in young men. Am<br />
J Clin Nutr 76, 1023–1030.<br />
Anderson GH, Woodend D (2003). Effect of glycemic carbohydrates<br />
on short-term satiety and food intake. Nutr Rev 61, S17–S26.<br />
Brand-Miller J, Hayne S, Petocz P, Colagiuri S (2003b). Low-glycemic<br />
index diets in the management of diabetes: a meta-analysis of<br />
randomized controlled trials. Diabetes Care 26, 2261–2267.<br />
Brand-Miller JC, Holt SH, Pawlak DB, McMillan J (2002). Glycemic<br />
index and obesity. Am J Clin Nutr 76, 281S–285S.<br />
Brand-Miller JC, Thomas M, Swan V, Ahmad ZI, Petocz P, Colagiuri S<br />
(2003c). Physiological validation of the concept of glycemic load<br />
in lean young adults. J Nutr 133, 2728–2732.<br />
Brand-Miller JC, Wolever TM (2005). The use of glycaemic index<br />
tables to predict glycaemic index of breakfast meals. Br J Nutr 94,<br />
133–134.<br />
Brand-Miller J, Wolever TM, Foster-Powell K, Colagiuri S (2003a). The<br />
New Glucose Revolution. Marlowe & Company: New York.<br />
Brouns F, Bjorck I, Frayn KN, Gibbs AL, Lang V, Slama G et al. (2005).<br />
Glycaemic index methodology. Nutr Res Rev 18, 145–171.<br />
Collier G, O’Dea K (1983). The effect of coingestion of fat on the<br />
glucose, insulin, and gastric inhibitory polypeptide responses to<br />
carbohydrate and protein. Am J Clin Nutr 37, 941–944.<br />
Coulston AM, Hollenbeck CB, Reaven GM (1984). Utility of studies<br />
measuring glucose and insulin responses to various carbohydratecontaining<br />
foods. Am J Clin Nutr 39, 163–167.<br />
Doi K, Matsuura M, Kawara A, Baba S (1979). Treatment of diabetes<br />
with glucomannan (konjac mannan). Lancet 1, 987–988.<br />
FAO (1998). Carbohydrates in human nutrition. Report of a Joint<br />
FAO/WHO Expert Consultation. FAO Food Nutr Pap 66,<br />
1–140.<br />
Flint A, Moller BK, Raben A, Pedersen D, Tetens I, Holst JJ et al.<br />
(2004). The use of glycaemic index tables to predict glycaemic<br />
index of composite breakfast meals. Br J Nutr 91, 979–989.<br />
Flood A, Subar AF, Hull SG, Zimmerman TP, Jenkins DJ, Schatzkin A<br />
(2006). Methodology for adding glycemic load values to the<br />
European Journal of Clinical Nutrition<br />
National Cancer Institute Diet History Questionnaire database.<br />
J Am Diet Assoc 106, 393–402.<br />
Ford ES, Liu S (2001). Glycemic index and serum high-density<br />
lipoprotein cholesterol concentration among US adults. Arch<br />
Intern Med 161, 572–576.<br />
Foster-Powell K, Holt SH, Brand-Miller JC (2002). International table<br />
of glycemic index and glycemic load values: 2002. Am J Clin Nutr<br />
76, 5–56.<br />
Freeman J (2005). The glycemic index debate: does the type of<br />
carbohydrate really matter? Diabet Forecast 58, 11.<br />
Frost G, Leeds A, Trew G, Margara R, Dornhorst A (1998). Insulin<br />
sensitivity in women at risk of coronary heart disease and the<br />
effect of a low glycemic diet. Metabolism 47, 1245–1251.<br />
Goldstein DE, Little RR, Lorenz RA, Malone JI, Nathan DM, Peterson<br />
CM (2004). Tests of glycemia in diabetes. Diabetes care 27<br />
(Suppl 1), S91–S93.<br />
Granfeldt Y, Liljeberg H, Drews A, Newman R, Bjorck I (1994).<br />
Glucose and insulin responses to barley products: influence of<br />
food structure and amylose-amylopectin ratio. Am J Clin Nutr 59,<br />
1075–1082.<br />
Granfeldt Y, Hagander B, Bjorck I (1995). Metabolic responses to<br />
starch in oat and wheat products. On the importance of food<br />
structure, incomplete gelatinization or presence of viscous dietary<br />
fibre. Eur J Clin Nutr 49, 189–199.<br />
Hanefeld M, Cagatay M, Petrowitsch T, Neuser D, Petzinna D, Rupp<br />
M (2004). Acarbose reduces the risk for myocardial infarction in<br />
type 2 diabetic patients: meta-analysis of seven long-term studies.<br />
Eur Heart J 25, 10–16.<br />
Heilbronn LK, Noakes M, Clifton PM (2002). The effect of high- and<br />
low-glycemic index energy restricted diets on plasma lipid and<br />
glucose profiles in type 2 diabetic subjects with varying glycemic<br />
control. J Am Coll Nutr 21, 120–127.<br />
Henry CJ, Lightowler HJ, Kendall FL, Storey M (2006). The impact of<br />
the addition of toppings/fillings on the glycaemic response<br />
to commonly consumed carbohydrate foods. Eur J Clin Nutr 60,<br />
763–769.<br />
Henry CJ, Lightowler HJ, Strik CM, Storey M (2005). Glycaemic index<br />
values for commercially available potatoes in Great Britain. Br J<br />
Nutr 94, 917–921.<br />
Hodge AM, English DR, O’Dea K, Giles GG (2004). Glycemic index<br />
and dietary fiber and the risk of type 2 diabetes. Diabetes Care 27,<br />
2701–2706.<br />
Holt SH, Miller JC, Petocz P (1997). An insulin index of foods: the<br />
insulin demand generated by 1000-kJ portions of common foods.<br />
Am J Clin Nutr 66, 1264–1276.<br />
Holt SH, Miller JC, Petocz P, Farmakalidis E (1995). A satiety index of<br />
common foods. Eur J Clin Nutr 49, 675–690.<br />
Holt SH, Brand Miller JC, Petocz P (1996). Inter-relationships among<br />
postprandial satiety, glucose and insulin responses and changes in<br />
subsequent food intake. Eur J Clin Nutr 50, 788–797.<br />
Jenkins DJ, Goff DV, Leeds AR, Alberti KG, Wolever TM, Gassull MA<br />
et al. (1976). Unabsorbable carbohydrates and diabetes: decreased<br />
post-prandial hyperglycaemia. Lancet 2, 172–174.<br />
Jenkins DJ, Kendall CW, Augustin LS, Franceschi S, Hamidi M,<br />
Marchie A et al. (2002). Glycemic index: overview of implications<br />
in health and disease. Am J Clin Nutr 76, 266S–273S.<br />
Jenkins DJ, Wolever TM, Buckley G, Lam KY, Giudici S, Kalmusky J<br />
et al. (1988). Low-glycemic index starchy foods in the diabetic diet.<br />
Am J Clin Nutr 48, 248–254.<br />
Jenkins DJ, Wolever TM, Jenkins AL, Giordano C, Giudici S,<br />
Thompson LU et al. (1986). Low-glycemic response to traditionally<br />
processed wheat and rye products: bulgur and pumpernickel<br />
bread. Am J Clin Nutr 43, 516–520.<br />
Jenkins DJ, Wolever TM, Jenkins AL, Josse RG, Wong GS (1984).<br />
The glycaemic response to carbohydrate foods. Lancet 2,<br />
388–391.<br />
Jenkins DJ, Wolever TM, Jenkins AL, Thorne MJ, Lee R, Kalmusky J<br />
et al. (1983). The glycaemic index of foods tested in diabetic
patients: a new basis for carbohydrate exchange favouring the use<br />
of legumes. Diabetologia 24, 257–264.<br />
Jenkins DJ, Wolever TM, Taylor RH, Barker H, Fielden H, Baldwin JM<br />
et al. (1981). Glycemic index of foods: a physiological basis for<br />
carbohydrate exchange. Am J Clin Nutr 34, 362–366.<br />
Kelly S, Frost G, Whittaker V, Summerbell C (2004). Low-glycaemic<br />
index diets for coronary heart disease. Cochrane Database Syst Rev<br />
CD004467.<br />
Liljeberg H, Granfeldt Y, Bjorck I (1992). Metabolic responses to<br />
starch in bread containing intact kernels versus milled flour. Eur<br />
J Clin Nutr 46, 561–575.<br />
Liu S, Manson JE, Stampfer MJ, Holmes MD, Hu FB, Hankinson SE<br />
et al. (2001). Dietary glycemic load assessed by food-frequency<br />
questionnaire in relation to plasma high-density lipoprotein<br />
cholesterol and fasting plasma triacylglycerols in postmenopausal<br />
women. Am J Clin Nutr 73, 560–566.<br />
Ma Y, Li Y, Chiriboga DE, Olendzki BC, Hebert JR, Li W et al. (2006).<br />
Association between carbohydrate intake and serum lipids. JAm<br />
Coll Nutr 25, 155–163.<br />
Mann J (2007). Dietary carbohydrate: relationship to cardiovascular<br />
disease and disorders of carbohydrate metabolism. Eur J Clin Nutr<br />
61(Suppl 1), S100–S111.<br />
McAuley K, Mann J (2006). Thematic review series: patient-oriented<br />
research. Nutritional determinants of insulin resistance. J Lipid Res<br />
47, 1668–1676.<br />
Mettler S, Lamprecht-Rusca F, Stoffel-Kurt N, Wenk C, Colombani PC<br />
(2007). The influence of the subjects’ training state on the<br />
glycemic index. Eur J Clin Nutr 61, 19–24.<br />
Miller CK, Gabbay RA, Dillon J, Apgar J, Miller D (2006). The effect of<br />
three snack bars on glycemic response in healthy adults. J Am Diet<br />
Assoc 106, 745–748.<br />
Murakami K, Sasaki S, Takahashi Y, Okubo H, Hosoi Y, Horiguchi H<br />
et al. (2006). Dietary glycemic index and load in relation to<br />
metabolic risk factors in Japanese female farmers with traditional<br />
dietary habits. Am J Clin Nutr 83, 1161–1169.<br />
Neuhouser ML, Tinker LF, Thomson C, Caan B, Horn LV, Snetselaar L<br />
et al. (2006). Development of a glycemic index database for food<br />
frequency questionnaires used in epidemiologic studies. J Nutr<br />
136, 1604–1609.<br />
Nuttall FQ, Mooradian AD, Gannon MC, Billington C, Krezowski P<br />
(1984). Effect of protein ingestion on the glucose and insulin<br />
response to a standardized oral glucose load. Diabetes Care 7, 465–470.<br />
Opperman AM, Venter CS, Oosthuizen W, Thompson RL, Vorster HH<br />
(2004). Meta-analysis of the health effects of using the glycaemic<br />
index in meal-planning. Br J Nutr 92, 367–381.<br />
Pi-Sunyer FX (2002). Glycemic index and disease. Am J Clin Nutr 76,<br />
290S–298S.<br />
Read NW, Welch IM, Austen CJ, Barnish C, Bartlett CE, Baxter AJ<br />
et al. (1986). Swallowing food without chewing; a simple way to<br />
reduce postprandial glycaemia. Br J Nutr 55, 43–47.<br />
Salmeron J, Ascherio A, Rimm EB, Colditz GA, Spiegelman D, Jenkins<br />
DJ et al. (1997a). Dietary fiber, glycemic load, and risk of NIDDM<br />
in men. Diabetes Care 20, 545–550.<br />
Glycemic index and glycemic load<br />
BJ Venn and TJ Green<br />
Salmeron J, Manson JE, Stampfer MJ, Colditz GA, Wing AL, Willett<br />
WC (1997b). Dietary fiber, glycemic load, and risk of non-insulindependent<br />
diabetes mellitus in women. JAMA 277, 472–477.<br />
Schenk S, Davidson CJ, Zderic TW, Byerley LO, Coyle EF (2003).<br />
Different glycemic indexes of breakfast cereals are not due to<br />
glucose entry into blood but to glucose removal by tissue. Am<br />
J Clin Nutr 78, 742–748.<br />
Schulze MB, Liu S, Rimm EB, Manson JE, Willett WC, Hu FB (2004).<br />
Glycemic index, glycemic load, and dietary fiber intake and<br />
incidence of type 2 diabetes in younger and middle-aged women.<br />
Am J Clin Nutr 80, 348–356.<br />
Slyper A, Jurva J, Pleuss J, Hoffmann R, Gutterman D (2005).<br />
Influence of glycemic load on HDL cholesterol in youth. Am J Clin<br />
Nutr 81, 376–379.<br />
Sugiyama M, Tang AC, Wakaki Y, Koyama W (2003). Glycemic<br />
index of single and mixed meal foods among common Japanese<br />
foods with white rice as a reference food. Eur J Clin Nutr 57,<br />
743–752.<br />
Suzuki H, Fukushima M, Okamoto S, Takahashi O, Shimbo T, Kurose<br />
T et al. (2005). Effects of thorough mastication on postprandial<br />
plasma glucose concentrations in nonobese Japanese subjects.<br />
Metabolism 54, 1593–1599.<br />
Tappy L, Gugolz E, Wursch P (1996). Effects of breakfast cereals<br />
containing various amounts of beta-glucan fibers on plasma<br />
glucose and insulin responses in NIDDM subjects. Diabetes Care<br />
19, 831–834.<br />
van de Laar FA, Lucassen PL, Akkermans RP, van de Lisdonk EH,<br />
Rutten GE, van Weel C (2005). Alpha-glucosidase inhibitors for<br />
patients with type 2 diabetes: results from a Cochrane systematic<br />
review and meta-analysis. Diabetes Care 28, 154–163.<br />
Venn BJ, Wallace AJ, Monro JA, Perry T, Brown R, Frampton C et al.<br />
(2006). The glycemic load estimated from the glycemic index does<br />
not differ greatly from that measured using a standard curve in<br />
healthy volunteers. J Nutr 136, 1377–1381.<br />
Wolever TM, Jenkins DJ (1986). The use of the glycemic index in<br />
predicting the blood glucose response to mixed meals. Am J Clin<br />
Nutr 43, 167–172.<br />
Wolever TM, Vorster HH, Bjorck I, Brand-Miller J, Brighenti F, Mann<br />
JI et al. (2003). Determination of the glycaemic index of foods:<br />
interlaboratory study. Eur J Clin Nutr 57, 475–482.<br />
Wolever TM (1990). The glycemic index. World Rev Nutr Diet 62,<br />
120–185.<br />
Wolever TM, Vuksan V, Eshuis H, Spadafora P, Peterson RD, Chao ES<br />
et al. (1991). Effect of method of administration of psyllium on<br />
glycemic response and carbohydrate digestibility. J Am Coll Nutr<br />
10, 364–371.<br />
Wolever TM, Yang M, Zeng XY, Atkinson F, Brand-Miller JC<br />
(2006). Food glycemic index, as given in glycemic index<br />
tables, is a significant determinant of glycemic responses<br />
elicited by composite breakfast meals. Am J Clin Nutr 83,<br />
1306–1312.<br />
S131<br />
European Journal of Clinical Nutrition
European Journal of Clinical Nutrition (2007) 61 (Suppl 1), S132–S137<br />
& 2007 Nature Publishing Group All rights reserved 0954-3007/07 $30.00<br />
www.nature.com/ejcn<br />
FAO/WHO Scientific Update on carbohydrates in<br />
human nutrition: conclusions<br />
J Mann, JH Cummings, HN Englyst, T Key, S Liu, G Riccardi, C Summerbell, R Uauy, RM van Dam,<br />
B Venn, HH Vorster and M Wiseman<br />
European Journal of Clinical Nutrition (2007) 61 (Suppl 1), S132–S137; doi:10.1038/sj.ejcn.1602943<br />
Keywords: carbohydrates; human nutrition; chronic diseases; FAO; WHO; scientific update<br />
The Scientific Update involved consideration of a number of<br />
key issues that have arisen since the Joint FAO/WHO Expert<br />
Consultation on Carbohydrates in Human Nutrition was<br />
held in 1997 (FAO, 1998) or where new data may have<br />
altered conclusions drawn some 10 years ago. The Scientific<br />
Update enabled some firm conclusions to be drawn and<br />
identified a number of areas where more research is required<br />
to enable definitive recommendations. The review papers<br />
prepared as part of this Scientific Update applied the criteria<br />
used by the 2002 WHO/FAO Expert Consultation on Diet,<br />
Nutrition and the Prevention of Chronic Diseases to describe<br />
strength of evidence for drawing the conclusions of the<br />
scientific review (WHO, 2003). The following are agreedupon<br />
summaries of both the review papers, and discussions<br />
from the authors’ meeting (Geneva, 17–18 July 2006) on<br />
each issue area.<br />
The experts who participated at the authors meeting were:<br />
John H Cummings, Hans Englyst Timothy Key, Simin Liu,<br />
Jim Mann (Chairman), Rob van Dam, Bernard Venn, Carolyn<br />
Summerbell (Rapporteur), Gabriele Riccardi, Ricardo Uauy,<br />
HH Vorster (Rapporteur) and Martin Wiseman. The FAO<br />
Secretariat members were Kraisid Tontisirin and Frank<br />
Martinez Nocito and the WHO Secretariat members were<br />
Chizuru Nishida and Denise Costa Coitinho.<br />
Terminology and classification<br />
Terminology and classification of carbohydrates remain<br />
difficult issues. The Scientific Update endorsed the primary<br />
classification, recommended by the 1997 Expert Consultation,<br />
based on chemical form, while acknowledging that<br />
classification of carbohydrates based on chemistry should<br />
also have dimensions of physical effects (food matrix),<br />
functional/physiological effects and health outcomes<br />
(Cummings and Stephen, 2007). The chemical classification<br />
Correspondence: Professor J Mann, Department of Human Nutrition, Edgar<br />
National Centre for Diabetes Research, University of Otago, New Zealand.<br />
E-mail: jim.mann@stonebow.otago.ac.nz<br />
provides a practical basis for measurement and labelling, but<br />
does not allow a simple translation into nutritional effects.<br />
Each chemical class of carbohydrate has overlapping physiological<br />
properties and health effects. As a result several<br />
terms have been used to describe their functional properties.<br />
For example, many terms exist to describe sugars in the diet.<br />
While it is straightforward from an analytical point of view<br />
to determine the total sugar content of food and their<br />
division into monosaccharides and disaccharides, it is<br />
acknowledged that the nature of the food matrix may<br />
influence the nutritional effects of foods-containing sugars.<br />
The term free sugars, defined as ‘all monosaccharides and<br />
disaccharides added to foods by the manufacturer, cook or<br />
consumer, plus sugars naturally present in honey, syrups and<br />
fruit juices’ (WHO, 2003), describes sugars which may have<br />
different physiological consequences from sugars incorporated<br />
within intact plant cell walls. This concept, which has<br />
been recommended by the 2002 WHO/FAO Expert Consultation<br />
(WHO, 2003), is theoretically useful to nutritionists<br />
but there is currently no standardized approach to their<br />
determination.<br />
The terms ‘prebiotic’, ‘resistant starch’ and ‘dietary fibre’<br />
are used to indicate some of the physiological properties and<br />
health effects of oligosaccharides and polysaccharides. The<br />
concepts of ‘prebiotic’ and ‘resistant starch’ are quite clearly<br />
defined. However, the current existence of several definitions<br />
of dietary fibre, reflecting different physiological and<br />
botanical properties or health effects of a range of naturally<br />
occurring and synthetic carbohydrates and their associated<br />
substances has resulted in confusion. The Scientific Update<br />
considered that the term ‘dietary fibre’ should be reserved for<br />
the cell wall polysaccharides of vegetables, fruits and wholegrains,<br />
the health benefits of which have been clearly<br />
established, rather than synthetic, isolated or purified<br />
oligosaccharides and polysaccharides with diverse, and in<br />
some cases unique, physiological effects. Thus, the Scientific<br />
Update agreed to define ‘dietary fibre’ as ‘intrinsic plant cell<br />
wall polysaccharides’.<br />
It is acknowledged that certain fibre rich whole foods (for<br />
example, pulses) can affect glycaemic control in diabetes,
and lipid levels, to a greater extent than cereal-based fibrecontaining<br />
foods. All forms of dietary fibre influence bowel<br />
habit, and other aspects of large bowel function. However,<br />
the analytical distinction between soluble and insoluble<br />
forms of dietary fibre may not always be useful since the<br />
separation of soluble and insoluble fractions is pH dependent<br />
and the link with specific physiological properties is<br />
inconsistent. Further research is needed to determine the<br />
exact properties of different non-starch polysaccharides<br />
and their food sources, to explain their metabolic and<br />
physiological effects. The whole-grain concept, along with<br />
fruit and vegetables is central to the healthy diet message,<br />
but the term whole-grain requires much clearer definition.<br />
In particular, the extent to which health properties are<br />
influenced by milling as compared with consumption of the<br />
intact grain should be established.<br />
Characterization and measurement<br />
Carbohydrate determinations should describe chemical<br />
composition accurately, and provide information of nutritional<br />
relevance (Englyst et al., 2007). The traditional<br />
calculation of carbohydrate ‘by difference’ does not conform<br />
to either of these criteria as it combines the analytical<br />
uncertainties of the other macronutrient measures and any<br />
unidentified material present, and a single value for<br />
carbohydrate cannot reflect the range of carbohydrate<br />
components or their diverse nutritional properties.<br />
The first principle of chemical analysis is to ensure that the<br />
fraction of interest is completely extracted from the food<br />
matrix in its native form (for example, sugars), or dispersed<br />
to such an extent that it can be hydrolysed (for example,<br />
total starch and non-starch polysaccharide). Once appropriately<br />
isolated, oligosaccharides and polysaccharides may<br />
be subjected to enzymatic (adds specificity) or acidic (when<br />
appropriate enzyme is unavailable) hydrolysis to release their<br />
constituent sugars. Detection is then by gas chromatography<br />
or high-performance liquid chromatography, which can be<br />
used to measure specific monosaccharides, disaccharides and<br />
small oligosaccharides. More rapid colorimetric assays can be<br />
used to measure sugars with reducing groups, and individual<br />
sugar species can be determined with enzyme-linked assays.<br />
There is more diversity of opinion regarding measurement<br />
of dietary components defined on the basis of functionality<br />
rather than chemical composition. However, the scientific<br />
update did recognize the nutritional importance of considering<br />
both chemical and food matrix aspects of carbohydrate-containing<br />
foods. Fundamental to any approach,<br />
where categorization is based on physiological or nutritional<br />
properties, is that they should be measured as chemically<br />
identified components. Such nutritional categories can<br />
reflect physiological fate (e.g. resistant starch), specific<br />
functionalities (e.g. prebiotics) or botanical origin (e.g. free<br />
sugars, dietary fibre).<br />
Scientific Update on carbohydrate in human diet<br />
J Mann et al<br />
In view of the considerable interest in the health effects of<br />
dietary fibre, much discussion centred around the various<br />
approaches to its measurement. Indigestibility in the small<br />
intestine was not considered to be a satisfactory basis for the<br />
definition of dietary fibre. It was agreed that the term<br />
‘dietary fibre’ be limited to polysaccharides that are intrinsic<br />
to the plant cell wall, and the methods for measuring dietary<br />
fibre are, therefore, those which can reliably quantify the<br />
component polysaccharides. Direct chemical measurement<br />
was favoured over empirical gravimetric methods for this<br />
purpose.<br />
Physiology<br />
Carbohydrates are the principal energy source in the diets of<br />
most people and have a special role to play in energy<br />
metabolism and homoeostasis. Despite this the energy<br />
values of some carbohydrates continue to be debated. This<br />
is because of the use of different energy systems such as<br />
combustible, digestible and metabolizable. Furthermore,<br />
ingested macronutrients may not be fully available to tissues<br />
and the tissues themselves may not be fully able to oxidize<br />
substrates made available to them. Therefore, for certain<br />
carbohydrates the discrepancies between combustible energy,<br />
digestible energy, metabolizable energy (ME) and net<br />
metabolizable energy (NME) may be considerable.<br />
In defining the role that carbohydrate plays in metabolism<br />
it is important to realize that the site, rate and extent of<br />
carbohydrate digestion in and absorption from the gut is key<br />
to understanding the many roles that this group of<br />
chemically related compounds and their metabolic products<br />
play in the body. However, even the concept of digestibility<br />
has different meanings. Within the nutrition community it<br />
is an accepted convention that digestion occurs in the small<br />
(upper) bowel, while fermentation occurs in the large (lower)<br />
bowel. Although both processes result in the breakdown of<br />
food and absorption of energy yielding substrates, the term<br />
digestibility is reserved for events occurring in the upper gut.<br />
However, in the discussion of the energy value of foods<br />
digestibility is defined as the proportion of combustible<br />
energy that is absorbed over the entire length of the<br />
gastrointestinal tract. For the sake of determining energy<br />
values of carbohydrate that are of practical use, and of<br />
ascribing health benefits to individual classes of them, some<br />
coherence needs to be brought to the use of the terms<br />
digestible, digestion and digestibility and to integrating the<br />
whole of the gut process into the equation of energy balance.<br />
Three food energy systems are in use in food tables and for<br />
food labelling in different countries and regions in the world<br />
based on selective interpretation of the digestive physiology<br />
and metabolism of food carbohydrates. These are the<br />
systems which employ the Atwater specific factors; the<br />
Atwater general factors (17, 17, 37 kJ/g for carbohydrate,<br />
protein and fat, respectively); NME factors (typically applied<br />
to polyols) (Elia and Cummings, 2007). This is clearly<br />
S133<br />
European Journal of Clinical Nutrition
S134<br />
unsatisfactory and confusing to the consumer. Food labelling<br />
policy should aim to establish a system that avoids bias as far<br />
as possible using a practical user-friendly system. While it<br />
has been suggested that an enormous amount of work would<br />
have to be undertaken to change the current ME system into<br />
an NME system the additional changes may not be as great as<br />
anticipated. The key issues are the extent to which the<br />
underlying physiological considerations are sound, the<br />
extent to which they should drive food-labelling policy and<br />
the extent to which food energy system(s) should become<br />
consistent within and between regional jurisdictions.<br />
The role of carbohydrate as a regulator of appetite and<br />
energy expenditure is a subject for intensive study, propelled<br />
by the rise in obesity in many countries. Carbohydrate is<br />
generally more satiating than fat, but less satiating than<br />
protein. However, studies of eating behaviour indicate that<br />
appetite regulation does not unconditionally depend on the<br />
oxidation of one nutrient and argues against the operation<br />
of a simple carbohydrate oxidation or storage model of<br />
feeding behaviour to the exclusion of other macronutrients.<br />
The control of appetite operates through a system with many<br />
redundancies that does not rely overwhelmingly on one or<br />
two major factors, such as energy density or on a specific<br />
macronutrient. Rather it depends on multiple factors that<br />
can interact, compensate or override each other, depending<br />
on environmental exposures and their duration. These<br />
include sensory factors, diet composition and variety of<br />
available food items, eating environment and individual<br />
subject characteristics, such as age, habitual dietary intake<br />
and prior social conditioning. It has been difficult to<br />
establish the relative importance of these factors, which are<br />
likely to differ with the environmental setting. In the light of<br />
this evidence, the role of different types of carbohydrates on<br />
eating behaviour might not be expected to have large effects<br />
on long-term energy homoeostasis and intervention studies<br />
are generally consistent with this view.<br />
Carbohydrates that reach the large bowel enter a very<br />
different type of metabolism, determined by the anaerobic<br />
microbiota of this organ and in so doing exert an important<br />
influence on its function. However, uncertainty remains<br />
regarding the exact amounts and types of carbohydrate that<br />
reach the caecum and are available for fermentation, largely<br />
because of the difficulties of studying this area of the gut and<br />
of variations in food processing, stage of maturity at which<br />
plant foods are eaten, post harvest changes, day to day<br />
fluctuations in food intake and individual differences in gut<br />
function. Current estimates of the amount of non-starch<br />
polysaccharide þ resistant starch þ non-a-glucan oligosaccharides<br />
þ polyols þ lactose that reach the large bowel are between<br />
20 and 40 g/day in countries with ‘westernised’ diets, while<br />
they may reach 50 g/day where traditional staples are largely<br />
cereal or diets are high in fruit and/or vegetables.<br />
Since the 1997 FAO/WHO Expert Consultation (FAO, 1998),<br />
there has been progress in understanding the role of these<br />
‘unavailable’, but fermented, carbohydrates in the large bowel.<br />
Non-starch polysaccharide clearly affect bowel habit and so<br />
European Journal of Clinical Nutrition<br />
Scientific Update on carbohydrate in human diet<br />
J Mann et al<br />
does resistant starch, but to a lesser extent. However, the non-aglucan<br />
oligosaccharides or non-digestible oligosaccharides have<br />
little laxative role, if any, although they do affect the<br />
composition of the flora. This latter property has led to the<br />
invention of the term ‘prebiotic’, which designates the selective<br />
effect of these carbohydrates on the flora, in particular their<br />
capacity to increase numbers of Bifidobacteria and Lactobacilli<br />
without growth of other genera. This now well-established<br />
physiological property has not so far led through to clear health<br />
benefits. There is some evidence that use of prebiotic supplements<br />
increases absorption of calcium, but this has not been<br />
consistently observed. Prebiotics are incorporated into some<br />
brands of infant formulae, and a range of food for adults.<br />
Overweight and obesity<br />
The prevalence of overweight and obesity has increased<br />
rapidly worldwide during recent decades reaching epidemic<br />
proportions in children and adults in both industrialized and<br />
developing countries, in particular those which are going<br />
through rapid economic transition. Carbohydrates are<br />
among the macronutrients that provide energy and can<br />
thus contribute to weight gain when consumed in excess of<br />
energy requirements. If energy intake is strictly controlled,<br />
macronutrient composition of the diet (energy percentages<br />
of fat and carbohydrates) does not substantially affect body<br />
weight or fat mass. However, an important issue is whether,<br />
among free-living individuals, the macronutrient composition<br />
of the diet affects the likelihood of passive overconsumption.<br />
There is no clear evidence that altering the<br />
proportion of total carbohydrate in the diet is an important<br />
determinant of energy intake. However, there is evidence<br />
that sugar-sweetened beverages do not induce satiety to the<br />
same extent as solid forms of carbohydrate and that increases<br />
in consumption of sugar-sweetened soft drinks are associated<br />
with weight gain (van Dam and Seidell, 2007). Thus, there is<br />
justification for the recommendation to restrict the consumption<br />
of beverages high in free sugars to reduce the risk<br />
of excessive weight gain. Solid foods high in free sugars tend<br />
to be energy dense and there is some evidence from<br />
intervention studies that reduction of solid foods high in<br />
free sugars can contribute to weight loss. Thus, the outcomes<br />
of the Scientific Update support the population nutrient<br />
intake goals on free sugars (that is, o10% of total energy)<br />
that were recommended by the 2002 WHO/FAO Expert<br />
Consultation (WHO, 2003). A high content of dietary fibre<br />
in whole-grain, vegetables, legumes and fruits is associated<br />
with relatively low energy density, promotion of satiety and<br />
in observational studies a lesser degree of weight gain than<br />
among those with lower intakes. Although it is difficult<br />
to establish with certainty that dietary fibre rather than<br />
other dietary attributes are responsible, it is considered<br />
appropriate to recommend that whole-grain cereals, vegetables,<br />
legumes and fruits are the most appropriate sources of<br />
dietary carbohydrate. The available evidence is considered
insufficient for the use of glycaemic index (GI) of carbohydrate-containing<br />
foods to predict the likelihood of their<br />
ability to reduce the risk of obesity in normal weight<br />
individuals or promote weight loss in those who are overweight<br />
or obese.<br />
Glycaemic index and glycaemic load<br />
The 1997 FAO/WHO Expert Consultation suggested that the<br />
concept of GI might provide a useful means of helping to<br />
select the most appropriate carbohydrate-containing foods<br />
for the maintenance of health and the treatment of several<br />
diseases (FAO, 1998). It is acknowledged that choice of<br />
carbohydrate-containing foods should not be based solely on<br />
GI since low-GI foods may be energy dense and contain<br />
substantial amounts of sugars, fat or undesirable fatty acids<br />
that contribute to the diminished glycaemic response but<br />
not necessarily to good health outcomes. The inter-individual<br />
variation in glycaemic responses to foods is a further<br />
limitation of the GI concept and underlines the need to<br />
study a larger number of subjects under standard conditions<br />
than have been investigated previously to obtain more<br />
precise estimates of the GI of individual foods. In addition<br />
to the inter-individual variation, responses in a single<br />
individual are not necessarily consistent. Despite these<br />
reservations it does appear that distinguishing between<br />
foods with appreciable differences in the indices may<br />
produce some benefit in terms of glycaemic control in<br />
diabetes and lipid management. The benefits demonstrated<br />
in randomized-controlled trials are smaller than those<br />
conferred by other dietary and lifestyle changes especially<br />
those which facilitate weight loss in the overweight and<br />
obese (Venn and Green, 2007). Although some data<br />
suggest that the dietary fibre content of the foods does not<br />
explain the low-GI effect it remains conceivable that food<br />
structure or composition explain some of the health<br />
benefits.<br />
The limitation of the GI concept may apply especially to<br />
some of the manufactured products that have been GI tested<br />
and are available in many countries. Given that most of the<br />
studies which have demonstrated a health benefit of low GI<br />
involved the use of naturally occurring and minimally<br />
processed foods, it would seem to be appropriate for<br />
manufactured foods to be further examined rather than to<br />
assume health benefits only on the basis of their functionality<br />
(that is, a low-glycaemic response).<br />
GI is perhaps most appropriately used to guide food<br />
choices when considering similar carbohydrate-containing<br />
foods, for example bread with a low GI may be preferable to a<br />
higher GI bread, with a resultant lower glycaemic load (GL).<br />
Ideally, GI should be measured in a relatively larger group of<br />
individuals, but even then should be interpreted in the<br />
knowledge of the inter- and intra-individual variation.<br />
Furthermore, GI and GL should always be considered in<br />
the context of other nutritional indicators.<br />
Scientific Update on carbohydrate in human diet<br />
J Mann et al<br />
Carbohydrates in the aetiology of diabetes and<br />
cardiovascular disease<br />
The Scientific Update also considered the relationship<br />
between dietary carbohydrate and cardiovascular disease,<br />
disorders of carbohydrate metabolism and cancer. A wide<br />
range of intakes of carbohydrate-containing foods is acceptable<br />
in the context of dietary patterns, which are protective<br />
against cardiovascular disease, diabetes and prediabetic<br />
states. The nature of carbohydrate eaten is important.<br />
Whole-grains, legumes, vegetables and intact fruits are the<br />
most appropriate sources of carbohydrate. There is impressive<br />
evidence that they are associated with a reduced risk of<br />
cardiovascular disease, although inconsistencies with regard<br />
to the definition of whole-grain explain why the cardiovascular<br />
effect of fruits and vegetables was described by the 2002<br />
WHO/FAO Expert Consultation (WHO, 2003) as ‘convincing’<br />
whereas the protective effect of whole-grains was<br />
graded as ‘probable’. These carbohydrate-containing foods<br />
are rich sources of dietary fibre (defined as non-starch<br />
polysaccharide in the 2002 WHO/FAO Expert Consultation),<br />
which protects against type II diabetes, and other cardioprotective<br />
components. However, there is no good evidence of<br />
protection against cardiovascular disease and diabetes when<br />
various oligosaccharides or polysaccharides or other isolated<br />
components of whole-grains, fruits, vegetables and legumes<br />
are added to functional and manufactured foods. This<br />
provides further justification for defining dietary fibre as<br />
‘intrinsic plant cell wall polysaccharide’ as developed<br />
through this Scientific Update. Both the 1997 FAO/WHO<br />
Expert Consultation and the 2002 WHO/FAO Expert Consultation<br />
recommended that total carbohydrate should<br />
provide 55–75% total energy and that intake of fruits and<br />
vegetables (excluding tubers, for example, potatoes and<br />
cassava) should be 400 g/day or more. Precise amounts of<br />
dietary fibre as non-starch polysaccharide were not recommended<br />
by the 2002 WHO/FAO Expert Consultation (WHO,<br />
2003). It was considered that the recommended intakes of<br />
fruit, vegetables, legumes and regular consumption of<br />
whole-grain cereals would provide adequate intakes of total<br />
dietary fibre. These recommendations of the 2002 WHO/<br />
FAO Expert Consultation are compatible with the outcomes<br />
of the Scientific Update, although some caveats are<br />
suggested. Given that a wide range of carbohydrate intakes<br />
is compatible with cardioprotection and that many western<br />
countries have average intakes that are below 55% of total<br />
energy intakes, the conclusion of the Scientific Update was<br />
that a lower limit of around 50% total energy was acceptable.<br />
Several national guidelines suggest a lower limit of 50%. It is<br />
more important to be prescriptive with regard to the nature<br />
of dietary carbohydrate, especially when total carbohydrate<br />
intakes are at the upper end of the recommended range.<br />
Failure to emphasize the need for carbohydrates to be<br />
derived principally from whole-grain cereals, fruits, vegetables<br />
and legumes may result in increased lipoproteinmediated<br />
risk of coronary heart disease, especially with an<br />
S135<br />
European Journal of Clinical Nutrition
S136<br />
increase in the ratio of total low-density lipoprotein<br />
cholesterol to high-density lipoprotein cholesterol and an<br />
increase in triglycerides. This may apply particularly to<br />
overweight and obese individuals who are insulin-resistant.<br />
A low-dietary GL may reduce the risk of type II diabetes and<br />
cardiovascular disease but similar caveats to those described<br />
for GI apply when interpreting such observations.<br />
Carbohydrates in the treatment of diabetes and<br />
cardiovascular risk factors<br />
Similar issues to those described above relating to dietary<br />
carbohydrate and disease prevention apply to the management<br />
of people with diabetes and to those with risk factors<br />
for cardiovascular disease, especially to those with abnormal<br />
lipid profiles. While legumes, pulses and certain fruits,<br />
vegetables and cereal grains appear to confer particular<br />
benefit in terms of reducing glycaemia and lowering lowdensity<br />
lipoprotein cholesterol, difficulties of measurement<br />
and the possibility that other constituents of plant foods<br />
may be involved preclude the definitive conclusion that the<br />
content of ‘soluble’ dietary fibre is the determinant of this<br />
effect (Mann, 2007). Low-GI foods may confer benefits in<br />
terms of improving glycaemic control in people with<br />
diabetes. However, it is not clear whether these benefits are<br />
fully independent of the effects of dietary fibre or the fact<br />
that foods with intact plant cell walls tend to have low GI.<br />
Furthermore, it is uncertain whether functional and manufactured<br />
foods with a low GI confer the same long-term<br />
benefits as low GI predominantly plant-based foods.<br />
Cancer<br />
The review relating to cancer concluded that the most<br />
frequently observed association with carbohydrates was that<br />
between low intakes of dietary fibre and increased risk for<br />
colorectal cancer. However, it was noted that the data were<br />
not entirely consistent. The possible links between high<br />
intakes of sucrose and colorectal cancer and high intakes of<br />
lactose and ovarian cancer were considered to be rather more<br />
tenuous. The link between obesity and several cancers was<br />
considered to be convincing (Key and Spencer, 2007), thus,<br />
nutritional determinants of obesity may be regarded as<br />
causally related to all obesity-related cancers. Key and Spencer<br />
(2007) noted that the World Cancer Research Fund Report<br />
(WCRF) on Diet and Cancer to be published in November<br />
2007 was likely to generate more definitive data on nutritional<br />
determinants of cancer than had previously been available.<br />
Discussion<br />
The Scientific Update has enabled us to draw a number of<br />
important conclusions. The importance of improving the<br />
definition of dietary fibre was discussed and it was agreed<br />
European Journal of Clinical Nutrition<br />
Scientific Update on carbohydrate in human diet<br />
J Mann et al<br />
that the definition should be based on well-established<br />
health benefits and the ability to fulfill regulatory requirements.<br />
We, therefore, proposed that dietary fibre should be<br />
defined as intrinsic plant cell wall polysaccharides. Thus the<br />
method(s), which enable the measuring of the component<br />
polysaccharides would be appropriate for determining dietary<br />
fibre as defined above. The three food energy systems<br />
currently used in food tables and for labelling continue to<br />
create confusion for the consumer. There is an urgent need<br />
for an internationally agreed readily understood system, and<br />
further consideration of the net metabolizable energy<br />
approach is suggested. Review of the recent literature<br />
endorses the recommendations of the 2002 WHO/FAO<br />
Expert Consultation concerning the restriction of beverages<br />
high in free sugars and the limitation of total intake of free<br />
sugars to reduce the risk of overweight and obesity. The<br />
positive messages of that consultation are also endorsed,<br />
notably the potential of whole-grains, legumes, vegetables<br />
and intact fruits to protect against diabetes and cardiovascular<br />
disease. Many of these foods, high in dietary fibre, help<br />
to improve glycaemic control in people with diabetes and to<br />
reduce cardiovascular risk factors. However, while foods with<br />
a low GI may also confer benefit in some of these contexts,<br />
the Scientific Update suggested caution regarding the use of<br />
the GI as the sole determinant of the quality of carbohydrate-containing<br />
foods. Given the association between<br />
obesity and cancer at several sites and the possibility that<br />
dietary fibre may reduce the risk of colorectal cancer, the<br />
dietary messages aimed at reducing the risk of obesity,<br />
diabetes and cardiovascular disease have the potential to also<br />
reduce cancer risk.<br />
Finally, the need to review the current recommended<br />
range for dietary carbohydrate intake (55–75% total energy)<br />
was identified. There appeared to be insufficient justification<br />
for the recommended lower limit, therefore a possible<br />
revision to 50% was suggested. A wide range of intakes, as<br />
a proportion of total energy intake, is compatible with low<br />
risk of chronic diseases although excess intake of any<br />
macronutrient is likely to lead to obesity. The nature of<br />
dietary carbohydrate appears to be a more important<br />
determinant of health outcomes than the proportion of<br />
total energy derived from carbohydrate intake. It is hoped<br />
that these papers will stimulate discussion among the<br />
scientific community and relevant health professions and<br />
inform the formal Expert Consultation on Carbohydrate to<br />
be convened in the foreseeable future.<br />
Conflict of interest<br />
During the preparation and peer-review of this paper in 2006,<br />
the authors and peer-reviewers declared the following interests.<br />
Experts<br />
Professor John Cummings: Chairman, Biotherapeutics<br />
Committee, Danone; Member, Working Group on Foods<br />
with Health Benefits, Danone; funding for research work at<br />
the University of Dundee, ORAFTI (2004).
Dr Hans Englyst: Director and share-holder of Englyst<br />
Carbohydrates Ltd—a small research-oriented company working<br />
on dietary carbohydrates and health within the Medical<br />
Research Council. The UK Food Standards Agency is the main<br />
research partner and sponsor. In addition, Englyst Carbohydrates<br />
provide analytical assistance and reagents<br />
to universities and food industry worldwide, albeit on a small<br />
scale. The complete independence of Englyst Carbohydrates is<br />
maintained by not entering into any consultancy agreement.<br />
Professor Timothy J Key: None declared.<br />
Professor Simin Liu: None declared.<br />
Professor Jim Mann: None declared.<br />
Dr Gabriele Riccardi: None declared.<br />
Professor Carolyn Summerbell: None declared.<br />
Professor Ricardo Uauy: Scientific Adviser on a temporary<br />
basis for Unilever and Wyeth; Scientific Editorial/Award<br />
Adviser for Danone, DSM, Kelloggs, and Knowles and Bolton<br />
on a ad hoc basis.<br />
Dr Rob M van Dam: None declared.<br />
Dr Bernard Venn: None declared.<br />
Dr HH Vorster: Member and Director of the Africa Unit for<br />
Transdisciplinary health Research (AUTHeR), Research grant<br />
from the South African Sugar Association.<br />
Dr Martin Wiseman: None declared.<br />
FAO/WHO Secretariat members<br />
Dr Denise Costa Coitinho: None declared.<br />
Mr Frank Martinez Nocito: None declared.<br />
Scientific Update on carbohydrate in human diet<br />
J Mann et al<br />
Dr Chizuru Nishida: None declared.<br />
Dr Kraisid Tontisirin: None declared.<br />
References<br />
Cummings JH, Stephen AM (2007). Carbohydrate terminology and<br />
classification. Eur J Clin Nutr 61 (Suppl 1), S5–S18.<br />
Elia M, Cummings JH (2007). Physiological aspects of energy<br />
metabolism and gastrointestinal effects of carbohydrates. Eur<br />
J Clin Nutr 61 (Suppl 1), S40–S74.<br />
Englyst K, Liu S, Englyst H (2007). Nutritional characterisation<br />
of dietary carbohydrates providing defined measurements<br />
for labeling and research. Eur J Clin Nutr 61 (Suppl 1),<br />
S19–S39.<br />
FAO (1998). Carbohydrates in Human Nutrition. Report of a Joint FAO/<br />
WHO Expert Consultation (FAO Food and Nutrition Paper 66)<br />
Food and Agriculture Organization: Rome.<br />
Key TJ, Spencer EA (2007). Carbohydrates and cancer: an overview<br />
of the epidemiological evidence. Eur J Clin Nutr 61 (Suppl 1),<br />
S112–S121.<br />
Mann J (2007). Dietary carbohydrate: relationship to cardiovascular<br />
disease and disorders of carbohydrate metabolism. Eur J Clin Nutr<br />
61 (Suppl 1), S100–S111.<br />
van Dam RM, Seidell JC (2007). Carbohydrate intake and obesity. Eur<br />
J Clin Nutr 61 (Suppl 1), S75–S99.<br />
Venn BJ, Green TJ (2007). Glycemic index and glycemic load:<br />
measurement issues and their effect on diet-disease relationships.<br />
Eur J Clin Nutr 61 (Suppl 1), S122–S131.<br />
WHO (2003). Diet, Nutrition and the Prevention of Chronic<br />
Diseases. Report of a Joint WHO/FAO Expert Consultation<br />
(WHO Technical Report Series 916) World Health Organization:<br />
Geneva.<br />
S137<br />
European Journal of Clinical Nutrition
Annex 1.3: Council Directive 90/496/EEC on Nutrition<br />
Labelling of Foodstuffs.
Annex 1.4: US‐FDA GRAS Notification No. GRN 00184<br />
(Isomaltulose).
FDA/CFSAN/OFAS: Agency Response Letter: GRAS Notice No. GRN 000184<br />
FDA Home Page | CFSAN Home | Search/Subject Index | Q & A | Help<br />
CFSAN/Office of Food Additive Safety<br />
March 20, 2006<br />
Agency Response Letter<br />
GRAS Notice No. GRN 000184<br />
William A. Olson, Ph.D.<br />
Center for Regulatory Services, Inc.<br />
5200 Wolf Run Shoals Road<br />
Woodbridge, VA 22192-5755<br />
Dear Dr. Olson:<br />
Re: GRAS Notice No. GRN 000184<br />
The Food and Drug Administration (FDA) is responding to the notice, dated October 31,<br />
2005, that you submitted on behalf of S‹DZUCKER AG Mannheim/Ochsenfurt<br />
(S‹DZUCKER) in accordance with the agency's proposed regulation, proposed 21 CFR<br />
170.36 (62 FR 18938; April 17, 1997; Substances Generally Recognized as Safe (GRAS);<br />
the GRAS proposal). FDA received the notice on November 1, 2005, filed it on November<br />
4, 2005, and designated it as GRAS Notice No. GRN 000184.<br />
The subject of the notice is isomaltulose. The notice informs FDA of the view of<br />
S‹DZUCKER that isomaltulose is GRAS, through scientific procedures, for use as a<br />
nutritive sweetener in a variety of foods as described in Table 1.<br />
Table 1<br />
Conditions of use proposed by S‹DZUCKER<br />
Food Category Use levels (percent)]<br />
Baked goods and baking mixes (21 CFR 170.3(n)(1)) 10-25<br />
Beverages (21 CFR 170.3(n)(2), 21 CFR 170.3(n)(3)) 1-10<br />
Cereal-based products (21 CFR 170.3(n)(4))<br />
cereals 20-35;<br />
bars 5-20<br />
Confectionery and frostings (21 CFR 170.3(n)(9)) 15-99<br />
Chewing gum (21 CFR 170.3(n)(6)) 5-35<br />
Frozen dairy desserts and mixes (21 CFR 170.3(n)(20)) 30<br />
Fruit and water ices (21 CFR 170.3(n)(21)) 15<br />
Gelatins, desserts, puddings, etc. (21 CFR 170.3(n)(22)) 15-30<br />
http://www.cfsan.fda.gov/~rdb/opa-g184.html<br />
Seite 1 von 3<br />
19.02.2008
FDA/CFSAN/OFAS: Agency Response Letter: GRAS Notice No. GRN 000184<br />
Jams, jellies and spreads (21 CFR 170.3(n)(28)) 25-40<br />
Nuts and peanut spreads (21 CFR 170.3(n)(32)) 45<br />
Milk products (21 CFR 170.3(n)(31)) 3-20<br />
Processed fruit and fruit juices or vegetable juices<br />
(21 CFR 170.3(n)(35)), (21 CFR 170.3(n)(36))<br />
The subject of GRN 000184 is 6-O-·-D-glucopyranosyl-D-fructofuranose, monohydrate<br />
(CAS Reg No. 13718-94-0; molecular formula C 12 H 22 O 11 , referred to as isomaltulose.<br />
Isomaltulose is a reducing disaccharide consisting of one glucose and one fructose moiety<br />
linked by an ·-1,6- glycosidic bond, and is a water soluble, white or colorless crystalline<br />
powder.<br />
S‹DZUCKER describes the method of manufacture and provides product specifications for<br />
isomaltulose. Isomaltulose is manufactured from food-grade sucrose. An aqueous sucrose<br />
solution is applied to a column with an immobilized enzyme preparation consisting of nonviable<br />
cells of Protaminobacter rubrum (strain designated by the Dutch culture collection<br />
(Centraalbureau voor Schimmelcultures (CBS)) as CBS 574.77). (1) The enzyme sucrose-6glucosylmutase<br />
(EC 5.4.99.11) converts the ·-1,2 glycosidic bond of sucrose into the ·-1,6<br />
bond of isomaltulose. The resultant isomaltulose is crystallized, dried, then purified by<br />
filtration and ion exchange. Specifications include an assay content of at least 98 % 6-O-·-<br />
D-glucopyranosyl- D-fructofuranose and limits on lead (less than 0.1 milligrams per<br />
kilogram). S‹DZUCKER intends isomaltulose to be used as a nutritive sweetener that<br />
would totally or partially replace sucrose or other highly digestible carbohydrates.<br />
Isomaltulose provides a moderate sweetness, bulk, and texture to foods. S‹DZUCKER<br />
considers that the greater cost and lower solubility in water of isomaltulose compared with<br />
sucrose would limit those foods in which it would replace sucrose.<br />
The notice includes a published review summarizing published in vivo and in vitro studies<br />
demonstrating that isomaltulose is completely hydrolyzed and absorbed in the small<br />
intestine as glucose and fructose. The notifer concludes that the safety of isomaltulose is,<br />
therefore, equivalent to that of sucrose, which, like isomaltulose, is a disaccharide composed<br />
of glucose and fructose. The review discusses biological data, toxicological studies,<br />
metabolic studies, and studies on gastrointestinal tolerance, and concludes that the use of<br />
isomaltulose would not be a health concern.<br />
S‹DZUCKER used the reported per capita refined sugar consumption in the United States<br />
and assumed a five-to-ten percent market share replacement of isomaltulose for sucrose to<br />
estimate daily intake of isomaltulose at approximately 3 to 6 grams (g)/person per day.<br />
S‹DZUCKER notes that isomaltulose has been found at low concentrations in honey and<br />
cane sugar juice. Dietary intake of isomaltulose from consumption of honey would likely be<br />
1-10<br />
Snack foods (21 CFR 170.3(n)(37)) 10-25<br />
Sugar substitutes (21 CFR 170.3(n)(42)) 2 - >99<br />
Sweet sauces, toppings, syrups (21 CFR 170.3(n)(43)) 15-30<br />
Other categories:<br />
nutritive formula<br />
energy-reduced foods<br />
meal replacements/slimming foods<br />
http://www.cfsan.fda.gov/~rdb/opa-g184.html<br />
†<br />
5-20<br />
5-40<br />
5-20<br />
Seite 2 von 3<br />
19.02.2008
FDA/CFSAN/OFAS: Agency Response Letter: GRAS Notice No. GRN 000184<br />
less than one gram. S‹DZUCKER notes that isomaltulose has been in use as a food<br />
ingredient in Japan since 1985 and has recently been authorized as a novel food or food<br />
ingredient in Europe. (2)<br />
Based on the information provided by S‹DZUCKER, as well as other information available<br />
to FDA, the agency has no questions at this time regarding S‹DZUCKER's conclusion that<br />
isomaltulose is GRAS under the intended conditions of use. The agency has not, however,<br />
made its own determination regarding the GRAS status of the subject use of isomaltulose.<br />
As always, it is the continuing responsibility of S‹DZUCKER to ensure that food<br />
ingredients that the firm markets are safe, and are otherwise in compliance with all<br />
applicable legal and regulatory requirements.<br />
In accordance with proposed 21 CFR 170.36(f), a copy of the text of this letter, as well as a<br />
copy of the information in your notice that conforms to the information in proposed 21 CFR<br />
170.36(c)(1), is available for public review and copying on the homepage of the Office of<br />
Food Additive Safety (on the Internet at http://www.cfsan.fda.gov/~lrd/foodadd.html).<br />
Sincerely,<br />
Laura M. Tarantino, Ph.D.<br />
Director<br />
Office of Food Additive Safety<br />
Center for Food Safety and Applied Nutrition<br />
(1) Non-viable cells of P. rubrum are immobilized by entrapment in beads of calcium<br />
alginate gel, formed from calcium chloride (21 CFR 184.1193) and sodium alginate (21<br />
CFR 184.1724). S‹DZUCKER notes that the immobilization system is consistent with 21<br />
CFR 173.357.<br />
(2) (European Commission decision of 25 July 2005 authorizing the placing on the market of<br />
isomaltulose as a novel food or novel food ingredient under Regulation (EC) No 258/97 of<br />
the European Parliament and of the Council).<br />
Food Ingredients and Packaging † | † Summary of all GRAS Notices<br />
CFSAN Home | CFSAN Search/Subject†Index | CFSAN Disclaimers†&†Privacy†Policy | CFSAN Accessibility/Help<br />
FDA Home Page | Search FDA Site | FDA A-Z Index | Contact FDA<br />
http://www.cfsan.fda.gov/~rdb/opa-g184.html<br />
FDA/Center for Food Safety & Applied Nutrition<br />
Hypertext updated by rxm April 24, 2006<br />
Seite 3 von 3<br />
19.02.2008
Annex 1.5: US Health Claims Regulation on Dietary<br />
Noncariogenic Carbohydrate Sweeteners and Dental<br />
Caries, Fed. Reg. Vol. 73, No. 102, May 27, 2008, 30299‐<br />
30301.
jlentini on PROD1PC65 with RULES<br />
Federal Register / Vol. 73, No. 102 / Tuesday, May 27, 2008 / Rules and Regulations<br />
manure and litter from the infected<br />
premises must be moved to the<br />
composting site at the same time;<br />
(5) Following the composting process,<br />
the composted manure or litter remains<br />
undisturbed for an additional 15 days<br />
before movement;<br />
(6) After this 15-day period, all of the<br />
composted manure or litter from the<br />
infected site is removed at the same<br />
time;<br />
(7) The resulting compost must be<br />
transported either in a previously<br />
unused container or in a container that<br />
has been cleaned and disinfected, since<br />
last being used, in accordance with part<br />
71 of this chapter;<br />
(8) The vehicle in which the resulting<br />
compost is to be transported has been<br />
cleaned and disinfected, since last being<br />
used, in accordance with part 71 of this<br />
chapter; and<br />
(9) Copies of the permit<br />
accompanying the compost derived<br />
from the manure and the litter are<br />
submitted so that a copy is received by<br />
the State animal health official and the<br />
veterinarian in charge for the State of<br />
destination within 72 hours of arrival of<br />
the compost at the destination listed on<br />
the permit.<br />
■ 7. Section 82.8 is amended as follows:<br />
■ a. In paragraph (a)(2), by removing the<br />
citation ‘‘7 CFR part 59’’ and adding the<br />
citation ‘‘9 CFR part 590’’ in its place.<br />
■ b. By revising paragraph (a)(3) to read<br />
as set forth below.<br />
§ 82.8 Interstate movement of eggs, other<br />
than hatching eggs, from a quarantined<br />
area.<br />
(a) * * *<br />
(3) The establishment that processes<br />
the eggs, other than hatching eggs, for<br />
sale establishes procedures adequate to<br />
ensure that the eggs are free of END,<br />
including:<br />
(i) The establishment separates<br />
processing and layer facilities, the<br />
incoming and outgoing eggs at the<br />
establishment, and any flocks that may<br />
reside at the establishment;<br />
(ii) The establishment implements<br />
controls to ensure that trucks, shipping<br />
companies, or other visitors do not<br />
expose the processing plant to END;<br />
(iii) Equipment used in the<br />
establishment is cleaned and disinfected<br />
in accordance with part 71 of this<br />
chapter at intervals determined by the<br />
Administrator to ensure that the<br />
equipment cannot transmit END to the<br />
eggs, other than hatching eggs, being<br />
processed; and<br />
(iv) The eggs are packed either in<br />
previously unused flats or cases, or in<br />
used plastic flats that were cleaned or<br />
disinfected since last being used, in<br />
accordance with part 71 of this chapter;<br />
* * * * *<br />
■ 8. Section 82.9 is amended as follows:<br />
■ a. In paragraph (b), by removing the<br />
word ‘‘and’’ at the end of the paragraph.<br />
■ b. By redesignating paragraph (c) as<br />
paragraph (d).<br />
■ c. By adding a new paragraph (c) to<br />
read as set forth below.<br />
§ 82.9 Interstate movement of hatching<br />
eggs from a quarantined area.<br />
* * * * *<br />
(c) The hatching eggs have been kept<br />
in accordance with the sanitation<br />
practices specified in § 147.22 and<br />
§ 147.25 of the National Poultry<br />
Improvement Plan; and<br />
* * * * *<br />
■ 9. Section 82.14 is amended as<br />
follows:<br />
■ a. In paragraph (c)(2), in the<br />
introductory text, by revising the second<br />
sentence to read as set forth below.<br />
■ b. In paragraph (e)(2), by removing the<br />
first sentence and by adding two new<br />
sentences in its place to read as set forth<br />
below.<br />
■ c. By adding a new paragraph (i) to<br />
read as set forth below.<br />
§ 82.14 Removal of quarantine.<br />
* * * * *<br />
(c) * * *<br />
(2) * * * The birds and poultry must<br />
be composted according to the following<br />
instructions or according to another<br />
procedure approved by the<br />
Administrator as being adequate to<br />
prevent the dissemination of END:<br />
* * * * *<br />
(e) * * *<br />
(2) Composting. If the manure and<br />
litter is composted, the manure and<br />
litter must be composted in the<br />
quarantined area. The manure and litter<br />
must be composted according to the<br />
following method, or according to<br />
another procedure approved by the<br />
Administrator as being adequate to<br />
prevent the dissemination of END: Place<br />
the manure and litter in rows 3 to 5 feet<br />
high and 5 to 10 feet at the base. * * *<br />
* * * * *<br />
(i) After the other conditions of this<br />
section are fulfilled, an area will not be<br />
released from quarantine until followup<br />
surveillance over a period of time<br />
determined by the Administrator<br />
indicates END is not present in the<br />
quarantined area.<br />
* * * * *<br />
VerDate Aug2005 16:07 May 23, 2008 Jkt 214001 PO 00000 Frm 00029 Fmt 4700 Sfmt 4700 E:\FR\FM\27MYR1.SGM 27MYR1<br />
30299<br />
Done in Washington, DC, this 20th day of<br />
May 2008.<br />
Kevin Shea,<br />
Acting Administrator, Animal and Plant<br />
Health Inspection Service.<br />
[FR Doc. E8–11741 Filed 5–23–08; 8:45 am]<br />
BILLING CODE 3410–34–P<br />
DEPARTMENT OF HEALTH AND<br />
HUMAN SERVICES<br />
Food and Drug Administration<br />
21 CFR Part 101<br />
[Docket No. FDA–2006–P–0404] (Formerly<br />
Docket No. 2006P–0487)<br />
Food Labeling: Health Claims; Dietary<br />
Noncariogenic Carbohydrate<br />
Sweeteners and Dental Caries<br />
AGENCY: Food and Drug Administration,<br />
HHS.<br />
ACTION: Final rule.<br />
SUMMARY: The Food and Drug<br />
Administration (FDA) is adopting as a<br />
final rule, without change, the<br />
provisions of the interim final rule that<br />
amended the regulation authorizing a<br />
health claim on noncariogenic<br />
carbohydrate sweeteners and dental<br />
caries, i.e., tooth decay, to include<br />
isomaltulose as a substance eligible for<br />
the health claim. FDA is taking this<br />
action to complete the rulemaking<br />
initiated with the interim final rule.<br />
DATES: This rule is effective May 27,<br />
2008.<br />
FOR FURTHER INFORMATION CONTACT:<br />
Jillonne Kevala, Center for Food Safety<br />
and Applied Nutrition (HFS–830), Food<br />
and Drug Administration, 5100 Paint<br />
Branch Pkwy., College Park, MD 20740–<br />
3835, 301–436–1450.<br />
SUPPLEMENTARY INFORMATION:<br />
I. Background<br />
In the Federal Register of September<br />
17, 2007 (72 FR 52783), FDA published<br />
an interim final rule to amend the<br />
regulation in part 101 (21 CFR part 101)<br />
that authorizes a health claim on the<br />
relationship between noncariogenic<br />
carbohydrate sweeteners and dental<br />
caries (§ 101.80) to include the<br />
noncariogenic sugar isomaltulose.<br />
Under section 403(r)(3)(B)(i) and section<br />
403(r)(7) of the Federal Food, Drug, and<br />
Cosmetic Act (the act) (21 U.S.C.<br />
343(r)(3)(B)(i) and 343(r)(7)), FDA<br />
issued this interim final rule in response<br />
to a petition filed under section<br />
403(r)(4) of the act. Section<br />
403(r)(3)(B)(i) of the act states that the<br />
Secretary of Health and Human Services<br />
(and, by delegation, FDA) shall issue a
jlentini on PROD1PC65 with RULES<br />
30300 Federal Register / Vol. 73, No. 102 / Tuesday, May 27, 2008 / Rules and Regulations<br />
regulation authorizing a health claim if<br />
he or she ‘‘determines, based on the<br />
totality of publicly available scientific<br />
evidence (including evidence from welldesigned<br />
studies conducted in a manner<br />
which is consistent with generally<br />
recognized scientific procedures and<br />
principles), that there is significant<br />
scientific agreement, among experts<br />
qualified by scientific training and<br />
experience to evaluate such claims, that<br />
the claim is supported by such<br />
evidence’’ (see also § 101.14(c)). Section<br />
403(r)(4) of the act sets out the<br />
procedures that FDA is to follow upon<br />
receiving a health claim petition.<br />
Section 403(r)(7) of the act permits FDA<br />
to make a proposed regulation issued<br />
under section 403(r) effective upon<br />
publication pending consideration of<br />
public comment and publication of a<br />
final regulation if the agency determines<br />
that such action is necessary for public<br />
health reasons.<br />
On August 31, 2006, Cargill, Inc.<br />
(petitioner), submitted a health claim<br />
petition to FDA requesting that the<br />
agency amend the ‘‘dietary<br />
noncariogenic carbohydrate sweeteners<br />
and dental caries’’ claim at § 101.80 to<br />
authorize a noncariogenic dental health<br />
claim for isomaltulose. FDA filed the<br />
petition for comprehensive review in<br />
accordance with section 403(r)(4) of the<br />
act on December 8, 2006. The petitioner<br />
requested that FDA grant an interim<br />
final rule by which foods containing<br />
isomaltulose could bear the health claim<br />
prior to publication of the final rule.<br />
FDA and the petitioner mutually agreed<br />
to extend the deadline for the agency’s<br />
decision on the petition to September 5,<br />
2007.<br />
As part of its review of the scientific<br />
literature on isomaltulose and dental<br />
caries, FDA considered the scientific<br />
evidence presented in the petition as<br />
well as information previously<br />
considered by the agency on the<br />
etiology of dental caries and the effects<br />
of slowly fermentable carbohydrates.<br />
The agency summarized this evidence<br />
in the interim final rule (72 FR 52783<br />
at 52784 to 52786). Based on the<br />
available evidence, FDA concluded that<br />
isomaltulose, like other noncariogenic<br />
carbohydrate sweeteners listed in<br />
§ 101.80(c)(2)(ii), does not promote<br />
dental caries. Consequently, FDA<br />
amended § 101.80(c)(2)(ii) to broaden<br />
the health claim to include isomaltulose<br />
as an additional substance eligible for<br />
the health claim.<br />
II. Summary of Comments and the<br />
Agency’s Response<br />
FDA solicited comments on the<br />
interim final rule. The comment period<br />
closed on December 3, 2007. The agency<br />
received four letters of response, three<br />
from consumers and one from a<br />
manufacturer. The manufacturer<br />
supported the interim rule. Two of the<br />
consumers’ comments addressed issues<br />
that are outside the scope of this<br />
rulemaking and will not be addressed<br />
here. The remaining comment suggested<br />
that there had been insufficient testing<br />
to demonstrate the safety of<br />
isomaltulose, but did not provide any<br />
information or analysis to support<br />
revision of the agency’s conclusion.<br />
Given the absence of contrary<br />
evidence on the agency’s decisions<br />
announced in the interim final rule,<br />
FDA is adopting as a final rule, without<br />
change, the interim final rule that<br />
amended § 101.80 to include<br />
isomaltulose as a substance eligible for<br />
the dental caries health claim.<br />
III. Analysis of Impacts<br />
FDA has examined the impacts of the<br />
final rule under Executive Order 12866,<br />
the Regulatory Flexibility Act (5 U.S.C.<br />
601–612), and the Unfunded Mandates<br />
Reform Act of 1995 (Public Law 104–4).<br />
Executive Order 12866 directs agencies<br />
to assess all costs and benefits of<br />
available regulatory alternatives and,<br />
when regulation is necessary, to select<br />
regulatory approaches that maximize<br />
net benefits (including potential<br />
economic, environmental, public health<br />
and safety, and other advantages;<br />
distributive impacts; and equity). The<br />
agency believes that this final rule is not<br />
a significant regulatory action under the<br />
Executive order.<br />
The Regulatory Flexibility Act<br />
requires agencies to analyze regulatory<br />
options that would minimize any<br />
significant impact of a rule on small<br />
entities. Because this final rule allows<br />
new voluntary behavior and imposes no<br />
additional restrictions on current<br />
practices, the agency certifies that the<br />
final rule will not have a significant<br />
economic impact on a substantial<br />
number of small entities.<br />
Section 202(a) of the Unfunded<br />
Mandates Reform Act of 1995 requires<br />
that agencies prepare a written<br />
statement which includes an assessment<br />
of anticipated costs and benefits before<br />
proposing ‘‘any rule that includes any<br />
Federal mandate that may result in the<br />
expenditure by State, local, and tribal<br />
governments, in the aggregate, or by the<br />
private sector, of $100,000,000 or more<br />
(adjusted annually for inflation) in any<br />
one year.’’ The current threshold after<br />
adjustment for inflation is $127,000,000,<br />
using the most current (2006) Implicit<br />
Price Deflator for the Gross Domestic<br />
Product. FDA does not expect this final<br />
rule to result in any one-year<br />
VerDate Aug2005 16:07 May 23, 2008 Jkt 214001 PO 00000 Frm 00030 Fmt 4700 Sfmt 4700 E:\FR\FM\27MYR1.SGM 27MYR1<br />
expenditure that would meet or exceed<br />
this amount.<br />
FDA received no comments relevant<br />
to economic impact. The costs and<br />
benefits of available regulatory<br />
alternatives analyzed in the interim<br />
final rule (72 FR 52783 at 52787 to<br />
52788) are adopted without change in<br />
this final rule. By now affirming that<br />
interim final rule, FDA has not imposed<br />
any new requirements. Therefore, there<br />
are no additional costs and benefits<br />
associated with this final rule.<br />
IV. Environmental Impact<br />
The agency has determined under 21<br />
CFR 25.32(p) that this action is of a type<br />
that does not individually or<br />
cumulatively have a significant effect on<br />
the human environment. Therefore,<br />
neither an environmental assessment<br />
nor an environmental impact statement<br />
is required.<br />
V. Paperwork Reduction Act<br />
FDA concludes that the labeling<br />
provisions of this final rule are not<br />
subject to review by the Office of<br />
Management and Budget because they<br />
do not constitute a ‘‘collection of<br />
information’’ under the Paperwork<br />
Reduction Act of 1995 (44 U.S.C. 3501–<br />
3520). Rather, the food labeling health<br />
claim on the association between<br />
consumption of isomaltulose and the<br />
nonpromotion of dental caries is a<br />
‘‘public disclosure of information<br />
originally supplied by the Federal<br />
Government to the recipient for the<br />
purpose of disclosure to the public’’ (5<br />
CFR 1320.3(c)(2)).<br />
VI. Federalism<br />
FDA has analyzed this final rule in<br />
accordance with the principles set forth<br />
in Executive Order 13132. FDA has<br />
determined that the rule will have a<br />
preemptive effect on State law. Section<br />
4(a) of the Executive order requires<br />
agencies to ‘‘construe * * * a Federal<br />
statute to preempt State law only where<br />
the statute contains an express<br />
preemption provision or there is some<br />
other clear evidence that the Congress<br />
intended preemption of State law, or<br />
where the exercise of State authority<br />
conflicts with the exercise of Federal<br />
authority under the Federal statute.’’<br />
Section 403A of the act (21 U.S.C. 343–<br />
1) is an express preemption provision.<br />
Section 403A(a)(5) of the act provides<br />
that:<br />
* * * no State or political subdivision of<br />
a State may directly or indirectly establish<br />
under any authority or continue in effect as<br />
to any food in interstate commerce—* * *(5)<br />
any requirement respecting any claim of the<br />
type described in section 403(r)(1) made in<br />
the label or labeling of food that is not
jlentini on PROD1PC65 with RULES<br />
Federal Register / Vol. 73, No. 102 / Tuesday, May 27, 2008 / Rules and Regulations<br />
identical to the requirement of section 403(r)<br />
* * *<br />
On September 17, 2007, FDA<br />
published an interim final rule which<br />
imposed requirements under section<br />
403(r) of the act. This final rule affirms<br />
the September 17, 2007, amendment to<br />
the existing food labeling regulations to<br />
add isomaltulose to the authorized<br />
health claim for noncariogenic<br />
carbohydrate sweeteners and dental<br />
caries. Although this rule has a<br />
preemptive effect in that it precludes<br />
States from issuing any health claim<br />
labeling requirements for isomaltulose<br />
and the nonpromotion of dental caries<br />
that are not identical to those required<br />
by this final rule, this preemptive effect<br />
is consistent with what Congress set<br />
forth in section 403A of the act. Section<br />
403A(a)(5) of the act displaces both<br />
State legislative requirements and State<br />
common law duties. Riegel v.<br />
Medtronic, 128 S. Ct. 999 (2008).<br />
FDA believes that the preemptive<br />
effect of this final rule is consistent with<br />
Executive Order 13132. Section 4(e) of<br />
the Executive order provides that ‘‘when<br />
an agency proposes to act through<br />
adjudication or rulemaking to preempt<br />
State law, the agency shall provide all<br />
affected State and local officials notice<br />
and an opportunity for appropriate<br />
participation in the proceedings.’’ On<br />
August 1, 2007, FDA’s Division of<br />
Federal and State Relations provided<br />
notice via fax and e-mail transmission to<br />
State health commissioners, State<br />
agriculture commissioners, food<br />
program directors, and drug program<br />
directors, as well as FDA field<br />
personnel, of FDA’s intent to amend the<br />
health claim regulation authorizing<br />
health claims for noncariogenic<br />
carbohydrate sweeteners and dental<br />
caries (§ 101.80). FDA received no<br />
comments from any States in response<br />
to this notice.<br />
In addition, the agency sought input<br />
from all stakeholders through<br />
publication of the interim final rule in<br />
the Federal Register on September 17,<br />
2007 (72 FR 52783). FDA received no<br />
comments from any States on the<br />
interim final rule.<br />
In conclusion, the agency believes<br />
that it has complied with all of the<br />
applicable requirements of Executive<br />
Order 13132 and has determined that<br />
the preemptive effects of this rule are<br />
consistent with the Executive order.<br />
List of Subjects in 21 CFR Part 101<br />
Food labeling, Nutrition, Reporting<br />
and Recordkeeping requirements.<br />
■ Therefore, under the Federal Food,<br />
Drug, and Cosmetic Act and under<br />
authority delegated to the Commissioner<br />
of Food and Drugs, 21 CFR part 101 is<br />
amended as follows:<br />
PART 101—FOOD LABELING<br />
■ Accordingly, the interim final rule<br />
amending § 101.80 that was published<br />
in the Federal Register of September 17,<br />
2007 (72 FR 52783), is adopted as a final<br />
rule without change.<br />
Dated: May 19, 2008.<br />
Jeffrey Shuren,<br />
Associate Commissioner for Policy and<br />
Planning.<br />
[FR Doc. E8–11802 Filed 5–23–08; 8:45 am]<br />
BILLING CODE 4160–01–S<br />
DEPARTMENT OF THE TREASURY<br />
Internal Revenue Service<br />
26 CFR Part 1<br />
[TD 9400]<br />
RIN 1545–BG97<br />
Treatment of Property Used To Acquire<br />
Parent Stock in Certain Triangular<br />
Reorganizations Involving Foreign<br />
Corporations<br />
AGENCY: Internal Revenue Service (IRS),<br />
Treasury.<br />
ACTION: Final and temporary<br />
regulations.<br />
SUMMARY: This document contains final<br />
and temporary regulations under section<br />
367(b) of the Internal Revenue Code<br />
(Code). The final regulations revise an<br />
existing final regulation and add a crossreference.<br />
The temporary regulations<br />
implement the rules described in Notice<br />
2006–85 and Notice 2007–48. The<br />
regulations affect corporations engaged<br />
in certain triangular reorganizations<br />
involving one or more foreign<br />
corporations. The text of the temporary<br />
regulations serves as the text of the<br />
proposed regulations (REG–136020–07)<br />
set forth in the notice of proposed<br />
rulemaking on this subject published in<br />
the Proposed Rules section in this issue<br />
of the Federal Register.<br />
DATES: Effective Date: These regulations<br />
are effective May 27, 2008.<br />
Applicability Dates: For dates of<br />
applicability, see § 1.367(a)–<br />
3T(b)(2)(i)(C) and 1.367(b)–14T(e).<br />
FOR FURTHER INFORMATION CONTACT:<br />
Daniel McCall, (202) 622–3860 (not a<br />
toll-free number).<br />
SUPPLEMENTARY INFORMATION:<br />
Background<br />
On September 22, 2006, the IRS and<br />
Treasury Department issued Notice<br />
VerDate Aug2005 16:07 May 23, 2008 Jkt 214001 PO 00000 Frm 00031 Fmt 4700 Sfmt 4700 E:\FR\FM\27MYR1.SGM 27MYR1<br />
30301<br />
2006–85 (2006–41 IRB 677), which<br />
announced that regulations would be<br />
issued under section 367(b) to address<br />
certain triangular reorganizations under<br />
section 368(a) involving one or more<br />
foreign corporations. On May 31, 2007,<br />
the IRS and Treasury Department issued<br />
Notice 2007–48 (2007–25 IRB 1428),<br />
which amplified Notice 2006–85 and<br />
announced that additional regulations<br />
would be issued under section 367(b).<br />
Each notice describes transactions the<br />
IRS and Treasury Department believe<br />
raise significant policy concerns.<br />
Notice 2006–85 describes triangular<br />
reorganizations in which a subsidiary<br />
(S) purchases stock of its parent<br />
corporation (P) from P in exchange for<br />
property, and then exchanges the P<br />
stock for the stock or assets of a target<br />
corporation (T), but only if P or S (or<br />
both) is foreign. Notice 2006–85<br />
announced that regulations to be issued<br />
under section 367(b) would make<br />
adjustments that would have the effect<br />
of a distribution of property from S to<br />
P under section 301 (deemed<br />
distribution). Notice 2006–85 further<br />
announced that regulations would<br />
address similar transactions where S<br />
acquires the P stock from a related party<br />
that purchased the P stock in a related<br />
transaction.<br />
Notice 2007–48 describes transactions<br />
in which S purchases all or a portion of<br />
the P stock exchanged in the<br />
reorganization from a person other than<br />
P (such as from public shareholders on<br />
the open market). Notice 2007–48<br />
announced that regulations to be issued<br />
under section 367(b) would also make<br />
adjustments that would have the effect<br />
of a distribution of property from S to<br />
P (under section 301) followed by a<br />
deemed contribution of such property<br />
by P to S. Notice 2007–48 further<br />
announced that the regulations would<br />
take into account the earnings and<br />
profits of other corporations, as<br />
appropriate, if a principal purpose of<br />
creating, organizing, or funding S is to<br />
avoid the adjustments to be made by the<br />
regulations.<br />
These temporary regulations set forth<br />
the regulations described in Notices<br />
2006–85 and 2007–48. The existing final<br />
regulations under § 1.367(b)–13 are<br />
revised to conform the definitions of the<br />
terms P, S, and T in those regulations to<br />
the definitions of such terms in these<br />
temporary regulations. The existing<br />
final regulations under § 1.367(b)–2 are<br />
revised to clarify that the definition of<br />
earnings and profits in § 1.367(b)–2(l)(8)<br />
applies only for purposes of §§ 1.367(b)–<br />
7 and 1.367(b)–9.
Annex 1.6: “PalatinoseTM (isomaltulose) – a new<br />
innovative carbohydrate”
PALATINOSEô - a new innovative carbohydrate<br />
What is PALATINOSEô?<br />
Palatinoseô is a new innovative carbohydrate. While providing the glucose-based energy to the body in<br />
a prolonged, slow and low glycemic way, it is fully available and is toothfriendly. It further supports the<br />
body in burning fat. This ingredient profile enables the development of products for a healthy lifestyle.<br />
More detailed information is given below.<br />
PALATINOSEô (generic name: isomaltulose) was approved for use as a novel food/novel food<br />
ingredient in the EU in 2005 1 . In the U.S. Palatinoseô is GRAS (GRAS notification # 184 accepted by<br />
FDA in March 2006). The food status was confirmed by many other countries worldwide.<br />
PALATINOSEô ñ nutritional/physiological properties<br />
Isomaltuloseís nutritional and physiological properties differ distinctly from those of sugar, as a result of this<br />
-1,6-linkage:<br />
The enzymes in the small intestine split isomaltulose down about 4 to 5 times more slowly than sucrose,<br />
as demonstrated by enzyme kinetic studies. This means that a smaller amount of glucose and fructose<br />
from isomaltulose is absorbed into the blood per time unit, compared to the more rapid rate at which the<br />
monosaccharides from sucrose or cooked starches are absorbed.<br />
Furthermore, this absorption does not only take place in the upper parts of the small intestine (as is the<br />
case for quickly absorbed sugars), but along the entire small intestine. This means that isomaltulose still<br />
supplies glucose as energy for the body at a time when sucrose has already been digested and would<br />
no longer supply energy. The overall digestion in the small intestine is virtually complete, as<br />
demonstrated by recovery studies.<br />
Complete absorption in the small intestine means that isomaltulose provides the same amount of<br />
calories as all digestible carbohydrates (sugars and starches 4 kcal/g) and is equally well tolerated (as<br />
no significant amount reaches the large intestine no gastrointestinal distress occurs).<br />
The slow but complete hydrolysis and absorption leads to a low blood glucose response (Glycemic Index<br />
= 32) and a low insulinemic response (Insulinemic<br />
Index = 30). This provides a tool for food<br />
manufacturers to prepare low glycemic food<br />
products (e.g. beverages etc) that help the<br />
consumers in their food choice to achieve a lower<br />
insulin day-profile which is desirable as explained in<br />
the following: The hormone insulin has many<br />
functions in the body, e.g. it down-regulates high<br />
blood glucose levels by ìopening the doorî for<br />
cellular glucose uptake. At the same time insulin<br />
promotes fat storage and inhibits fat burning. High<br />
levels of insulin over a long period of time are<br />
discussed to contribute to obesity and the<br />
development of diabetes.<br />
Consistent with the lower insulin response after<br />
intake of isomaltulose, it was demonstrated that fat<br />
oxidation was increased (measurements of the<br />
respiratory quotient). This may have an effect on<br />
body fat.<br />
0 30 60 90 120<br />
-1<br />
BENEO GmbH68165 MannheimGermanywww.BENEO-Group.comGeneral Management: Hildegard BauerDr. Matthias MoserYves Servotte<br />
Court of Registration: County Court MannheimNo. HRB 701800VAT Identification Number DE 253 691 060Bank Details: Deutsche Bank AG Mannheim<br />
Acc. 40651200 Bank Code 670 700 10SWIFT: DEUT DE SMIBAN DE94 6707 0010 0040 6512 00<br />
Plasma glucose change (mmol/L)<br />
5<br />
4<br />
3<br />
2<br />
1<br />
0<br />
-2<br />
Time (min)<br />
Sucrose<br />
Palatinoseô<br />
Blood glucose curves of Palatinoseô or sucrose (50g)<br />
determined in 10 healthy volunteers at the Sydney Universityís<br />
Glycaemic Index Research Service (2002), (mean±SD).<br />
1 Commission Decision 2005/581/EC of 25 July 2005 authorising the placing on the market of isomaltulose as a novel food or novel<br />
food ingredient under Regulation (EC) No 258/97 of the European Parliament and of the Council (notified under document number<br />
C(2005) 2776). OJ L 199, 29.7.2005, p. 90ñ91.
Isomaltulose is tooth friendly, unlike starches or other sugars. Isomaltulose is not used by the oral micro<br />
flora as a nutrient source. Therefore no significant amount of harmful acids that lead to cariogenic<br />
lesions are produced from isomaltulose, as demonstrated in vivo by pH-telemetry tests.<br />
PALATINOSEô as an ingredient in food production<br />
Isomaltulose is derived from sugar (sucrose) by enzymatic conversion of the 1,2-linkage of glucose and<br />
fructose into the more stable -1,6-bond. A commercial process was developed by S‹DZUCKER.<br />
Isomaltulose is a carbohydrate providing 4 kcal/g. It has a natural sugar-like taste with a mild sweetness that<br />
is about half that of sucrose. 2 It is used to replace sucrose in recipes but it is used for other nutritional<br />
reasons as well (e.g. in sports drinks for longer energy supply). Because of its low hygroscopicity and good<br />
flowability it is used in powder applications (e.g. instant powder drink applications), its high stability under<br />
acidic conditions is important in liquid applications. The main area of application is in drinks. Other categories<br />
of use are, e.g. cereals and cereal products, milk-based products, confectionery/baked goods etc.<br />
Products with Palatinoseô contribute to a healthy lifestyle.<br />
Contact:<br />
Anke Sentko<br />
Vice President Regulatory Affairs & Nutrition Communication<br />
BENEO Group<br />
ORAFTI-PALATINIT-REMY<br />
Phone +49 621 421 144<br />
Fax +49 621 421 165<br />
Mobil +49160905820008<br />
anke.sentko@beneo-group.com<br />
2 Being half as sweet as sugar does not result in higher uses compared to sucrose but in less sweet products. Double the amount does<br />
not lead to the same sweetness of sugar! To use the simple model of a candy of 3 gram: Doubling the amount of isomaltulose means<br />
doubling the size and weight of the candy and it still would not be as sweet as a sucrose candy.<br />
BENEO GmbH68165 MannheimGermanywww.BENEO-Group.comGeneral Management: Hildegard BauerDr. Matthias MoserYves Servotte<br />
Court of Registration: County Court MannheimNo. HRB 701800VAT Identification Number DE 253 691 060Bank Details: Deutsche Bank AG Mannheim<br />
Acc. 40651200 Bank Code 670 700 10SWIFT: DEUT DE SMIBAN DE94 6707 0010 0040 6512 00
Annex 1.7: “Dossier for the Scientific Substantiation of<br />
Claims related to PalatinoseTM and its Nutritional<br />
Physiological Properties”
CONFIDENTIAL<br />
Regulatory Affairs &<br />
Nutrition Communication – AJ/Se<br />
28 May 2008<br />
Page 1 of 16<br />
Dossier for the Scientific Substantiation of Claims related to Palatinose<br />
(isomaltulose) and its Nutritional / Physiological Properties<br />
Table of Content<br />
Summary<br />
1. Isomaltulose – What it is!<br />
2. Its Physiology – Digestion, Absorption & Metabolism of Isomaltulose<br />
3. Studies on the Effect of Isomaltulose on Blood Glucose and Insulin Levels and<br />
its Prolonged Energy Supply<br />
4. Discussion: General Characteristics of the Gycemic and Insulinemic Properties<br />
of Isomaltulose as compared to Sucrose<br />
5. Conclusions<br />
Summary<br />
Isomaltulose is a disaccharide and – like sucrose – consists of glucose and fructose. But<br />
unlike sucrose, isomaltulose has low glycemic and low insulinemic properties. It is<br />
characterised by an α-1,6 glucosidic linkage between the glucose and fructose moieties<br />
which is more stable than the α-1,2 glucosidic linkage in sucrose.<br />
Isomaltulose is almost completely hydrolysed in the small intestine into its components<br />
glucose and fructose which are absorbed and metabolised in the same pathway as if<br />
derived from sucrose. Therefore, isomaltulose provides the same amount of calories as<br />
other fully available carbohydrates do (4 kcal/g in food labelling). The difference to sucrose<br />
is that isomaltulose is hydrolysed at a much lower rate which is reflected in its glycemic and<br />
insulinemic properties. The rise in blood glucose concentrations after isomaltulose intake is<br />
slower and remains at a lower level while it lasts for a longer period of time compared to<br />
sucrose. The insulin response corresponds, which results in a lower insulin demand. As no<br />
significant amounts of isomaltulose reach the large intestine, isomaltulose is tolerated as<br />
well as sucrose.<br />
Reflecting these characteristics in digestion and absorption, the uniqueness of isomaltulose<br />
when compared to sucrose and other available carbohydrates (e.g. maltodextrin) becomes<br />
obvious: Isomaltulose provides glucose, the fuel or energy for the body, in a more balanced<br />
and prolonged way.<br />
WHO recommends following a high-carbohydrate-based but low glycemic diet for a healthy<br />
lifestyle. Isomaltulose can contribute significantly to reach such a healthy lifestyle.
CONFIDENTIAL<br />
Regulatory Affairs &<br />
Nutrition Communication – AJ/Se<br />
28 May 2008<br />
Page 2 of 16<br />
1. Isomaltulose - What it is!<br />
Isomaltulose is a carbohydrate which occurs in minor amounts naturally in honey and sugar<br />
cane juice (Siddiqui and Furgala 1967; Eggleston and Grisham 2003). In 1957,<br />
SÜDZUCKER discovered and described isomaltulose for the first time (Weidenhagen and<br />
Lorenz 1957). This was the basis for the commercial, large scale production of<br />
isomaltulose, which takes place in Offstein, Germany. An enzyme (non-GMO) transfers the<br />
α-1,2 linkage in sucrose to an α-1,6 linkage. This glucose-fructose combination is<br />
isomaltulose (6-O-α-D-glucopyranosyl-D-fructofuranose) (Figure 1).<br />
HO<br />
HO<br />
Sucrose<br />
OH<br />
O<br />
OH<br />
1 O<br />
OH<br />
1<br />
O<br />
2 HO<br />
OH<br />
[glucose] [fructose]<br />
OH<br />
6<br />
Enzyme<br />
HO<br />
HO<br />
PalatinoseTM PalatinoseTM OH<br />
O<br />
OH<br />
[glucose]<br />
1<br />
6<br />
O<br />
(isomaltulose)<br />
OH<br />
OH<br />
OH<br />
O<br />
OH<br />
2<br />
1<br />
[fructose]<br />
Figure 1: Enzymatic rearrangement of sucrose to isomaltulose (Palatinose).<br />
Isomaltulose is a food / food ingredient (like e.g. sugar, starch or maltodextrin). It has been<br />
used as such in Japan and other Asian countries since 1985. Its food status was confirmed<br />
in the European Union as well after undergoing the novel food approval process.<br />
SÜDZUCKER / PALATINIT’s Isomaltulose was approved as a novel food / novel food<br />
ingredient for use in food in the EU by Commission Decision 2005/251/EC of 25 th July<br />
2005. And it received GRAS status by FDA acknowledgement in March 2006 (FDA 2006).<br />
Compared to sucrose, isomaltulose has different key physiological properties, though:<br />
• It is hydrolysed by the same enzyme complex as is necessary for sucrose hydrolysis<br />
in the small intestine, but hydrolysis takes place at a much lower rate.<br />
• It is fully digested (as sucrose) yet slowly (and thus is not a low digestible but a SLOW<br />
digestible carbohydrate).<br />
• Its characteristic stable bond (α-1,6) is well known from starch, rather than from<br />
sugars.<br />
• Isomaltulose provides the same amount of energy yet in a more constant flow and<br />
within a lower insulin profile. Isomaltulose has a low effect on blood glucose and<br />
insulin levels.<br />
• Extreme blood glucose fluctuations and in particular a drastic fall below fasting<br />
glucose concentrations into the so-called relative hypoglycaemia, physiological
CONFIDENTIAL<br />
General or usual name: Isomaltulose<br />
Trade Name: Palatinose<br />
Chemical name: 6-O-α-D-glucopyranosyl-D-fructose<br />
Chemical classification: Carbohydrate (Disaccharide)<br />
CAS Reg. No. 13718-94-0<br />
Total molecular formula: C12H22O11 x H2O<br />
Molecular weight: 360.32 (monohydrate)<br />
Figure 2: Chemical description of isomaltulose.<br />
Regulatory Affairs &<br />
Nutrition Communication – AJ/Se<br />
28 May 2008<br />
Page 3 of 16<br />
reactions typical for highly digestible sugars and starches (sucrose, glucose or<br />
dextrose, maltodextrin etc.), can be avoided with isomaltulose.<br />
• Isomaltulose provides energy in form of blood glucose continuously over a longer<br />
period of time,<br />
Isomaltulose’s names and chemical description are summarised in Figure 2.<br />
In the following, the physiology of isomaltulose is described in more detail.<br />
2. Its Physiology - Digestion, Absorption & Metabolism of Isomaltulose<br />
Due to the more stable bonding between glucose and fructose, isomaltulose is more<br />
resistant to acid hydrolysis and enzymatic splitting by oral bacteria or by digestive enzymes<br />
in the small intestine than sucrose is. This means, isomaltulose is hydrolysed slowly to<br />
glucose and fructose and then absorbed, virtually completely, in the small intestine.<br />
Isomaltulose does not lead to gastrointestinal discomfort as no significant amount reaches<br />
the large intestine. Isomaltulose provides the same amount of calories as other full<br />
digestible carbohydrates do.<br />
These basic characteristics of isomaltulose have been demonstrated in a number of<br />
studies:<br />
Isomaltulose is slowly hydrolysed into glucose and fructose<br />
Sucrose and isomaltulose are hydrolysed by the same sucrase / isomaltase enzyme<br />
complex located in the brush border of the small intestine. However, this occurs at different<br />
sites within this enzyme complex. While sucrose is hydrolysed at the sucrase site (for α-1,2<br />
bonds), isomaltulose is hydrolysed by the isomaltase site (for α-1,6 bonds) of the complex<br />
(Figure 3). (Heinz 1987; Heymann and Heinz 1987; Günther and Heymann 1998; Dahlqvist<br />
et al 1963). Heinz (1987) demonstrated with human enzymes that the rate of hydrolysis<br />
slowed down by a factor of 5 with isomaltulose as a substrate compared to sucrose.
CONFIDENTIAL<br />
Regulatory Affairs &<br />
Nutrition Communication – AJ/Se<br />
28 May 2008<br />
Page 4 of 16<br />
Various in vitro studies with material from different species (rat, pig, human) addressed the<br />
rate of hydrolysis of isomaltulose versus sucrose or maltose and showed a rate of<br />
hydrolysis of typically less than 25 % that of sucrose (Table 1).<br />
Table 1: Rate of hydrolysis of isomaltulose in vitro<br />
Species Rate of hydrolysis of isomaltulose (%)<br />
Reference<br />
Versus sucrose Versus maltose<br />
Pig 10 – 20 2 – 5 Dahlqvist, 1961<br />
Pig 5.6 4.7 Heinz, 1987<br />
Rat 11.8 4.4 Yamada et al., 1985<br />
Rat 11.4 2.4 Tsuji et al., 1986<br />
Rat 1.8 3.7 Heinz, 1987<br />
Human 44.7 11 Grupp & Siebert, 1978<br />
Human 12.7 9 Ziesenitz, 1986a<br />
Human 26* 8* Ziesenitz, 1986b<br />
Human 16 18 Heinz, 1987<br />
*5 sugars added in a mixed preparation; in all other studies sugars added individually.<br />
Isomaltulose is virtually completely absorbed in the small intestine<br />
The absorption of isomaltulose was observed using various study designs and species.<br />
Recovery of radio labelled isomaltulose was compared to labelled sucrose in a rat study<br />
that showed a similar metabolism of both sugars (Macdonald and Daniel 1983).<br />
Absorption in the small intestine was examined in a study using pigs (60-70 kg bw) with a<br />
re-entrant fistula at the end of the small intestine. With this fistula it was possible to collect<br />
the chyme that arrived at the end of the small intestine. This chyme was analysed for its<br />
content of sugars. The pigs received 20% sucrose or isomaltulose as part of their diet. It<br />
was demonstrated that there was hardly any passage of isomaltulose at the terminal end of<br />
the ileum. Recovery of ingested isomaltulose was less than 3%. Both sugars were almost<br />
completely digested and absorbed in the small intestine. The amounts of end products<br />
(short chain fatty acids) of bacterial fermentation were similar for both sucrose and<br />
isomaltulose, indicating that fermentation in the large intestine was not a significant factor.<br />
Moreover, the flow of wet ileal chyme was identical in the sucrose and isomaltulose group,<br />
demonstrating the absence of non-absorbed and thus osmotically active nutrients (van<br />
Weerden et al 1983).<br />
An ileostomy study performed at the University of Würzburg, Germany, examined digestion<br />
and absorption of isomaltulose in humans in vivo (Gostner et al 2006). The 10 ileostomy<br />
patients consumed 50g isomaltulose in form of a drink (500ml) or a combination of a drink
CONFIDENTIAL<br />
Regulatory Affairs &<br />
Nutrition Communication – AJ/Se<br />
28 May 2008<br />
Page 5 of 16<br />
(250ml) and biscuits (140g) for breakfast after overnight fasting, followed by hourly<br />
collection of the ileostoma bags over an 8-hour period. On average, 96% (drinks) or 99%<br />
(drinks + biscuits) of the 50g isomaltulose intake was digested (hydrolysed), and 94%<br />
(drinks) or 96% (drinks + biscuits) was absorbed in the small intestine. There was no<br />
significant effect of the food type. This study confirms that isomaltulose is a fully digestible<br />
carbohydrate.<br />
Its gastrointestinal tolerance is similar to sucrose<br />
While low-digestible carbohydrates are known to have the potential to cause<br />
gastrointestinal discomfort as they are osmotically active and fermented in the large<br />
intestine to short chain fatty acids and gases, isomaltulose shows a slow but virtually<br />
complete absorption and is therefore tolerated well, similar to sucrose.<br />
In conclusion, the totality of in vitro and in vivo data shows that isomaltulose is a<br />
well tolerated carbohydrate that is absorbed slowly but virtually completely in form<br />
of glucose and fructose.
CONFIDENTIAL<br />
Regulatory Affairs &<br />
Nutrition Communication – AJ/Se<br />
28 May 2008<br />
Page 6 of 16<br />
3. Studies on the Effect of Isomaltulose on Blood Glucose and Insulin Levels and its<br />
Prolonged Energy Supply<br />
The slower hydrolysis of isomaltulose and subsequent slower absorption of glucose and<br />
fructose compared to sucrose are reflected in its characteristic blood glucose response with<br />
a slow, low and sustained rise in blood glucose levels and corresponding low insulin levels.<br />
Blood glucose and insulin response studies<br />
The effect of isomaltulose on blood glucose and insulin levels was studied in healthy and<br />
diabetic humans (Macdonald & Daniel 1983; Kawai et al 1985 and 1989, Sydney<br />
University’s Glycaemic Index Research Service (SUGiRS), 2002). In all the studies similar<br />
study designs were used for blood glucose and insulin measurements e.g. intake of the test<br />
and control substances dissolved in water and after overnight fasting.<br />
The most recent study at Sydney University’s Glycaemic Research Service (SUGiRS,<br />
2002) – one of the leading research institutes in this scientific area - was performed to<br />
determine the Glycemic Index (GI) and the Insulinemic Index (II) of isomaltulose according<br />
to internationally recognised standard methodology 1 . In this study, 10 healthy volunteers<br />
(Caucasian, 18-24 years old, BMI of 19-24 kg/m 2 ) received 50 g isomaltulose or sucrose,<br />
maltodextrine, or glucose (control) dissolved in 250 ml water after overnight fasting. Blood<br />
glucose and insulin concentrations were determined over a period of 120 minutes. The<br />
blood glucose and insulin curves for isomaltulose and sucrose are shown in Figures 3 and<br />
4.<br />
Blood glucose concentration after sucrose intake increased by a maximum of almost 4<br />
mmol/l (76 mg/dl) within 30 minutes, while they returned to baseline after about 60 minutes<br />
followed by a phase below baseline (relative hypoglycaemia) for the most of the second<br />
hour of the measurement. In contrast, blood glucose concentrations after isomaltulose<br />
increased by less than a third of that of sucrose (1,2 mmol/l or 22 mg/dl) and remained<br />
above baseline for most of the duration of the two hour experiment. The insulin curves<br />
corresponded. The overall blood glucose and insulin responses were lower for isomaltulose<br />
than for sucrose as reflected by the corresponding GI and II values shown in Table 2.<br />
1 The Glycemic Index (GI) is defined by FAO/WHO (1998) as the incremental area under the blood glucose<br />
response curve (IAUC) of a 50g carbohydrate portion of a test food expressed as a percentage of the<br />
response to the same amount of carbohydrate from a standard food (typically glucose or white bread) taken<br />
by the same subject. The Insulinemic Index (II) can be determined for the insulin curve, respectively.
CONFIDENTIAL<br />
Plasma glucose change (mmol/L)<br />
5<br />
4<br />
3<br />
2<br />
1<br />
0<br />
-1<br />
-2<br />
Regulatory Affairs &<br />
Nutrition Communication – AJ/Se<br />
28 May 2008<br />
Page 7 of 16<br />
0 30 60 90 120<br />
Time (min)<br />
Sucrose<br />
Palatinose<br />
Figure 3: Blood glucose curves of isomaltulose (Palatinose or sucrose (50g) determined in 10<br />
healthy volunteers at the Sydney University’s Glycaemic Index Research Service (2002),<br />
(mean±SD).<br />
Plasma insulin change (pmol/L)<br />
350<br />
300<br />
250<br />
200<br />
150<br />
100<br />
50<br />
0<br />
-50<br />
0 30 60 90 120<br />
Time (min)<br />
Sucrose<br />
Palatinose<br />
Figure 4: Plasma insulin curves of isomaltulose (Palatinose) or sucrose (50g) determined in 10<br />
healthy volunteers at the Sydney University’s Glycaemic Index Research Service (2002),<br />
(mean±SD).
CONFIDENTIAL<br />
Regulatory Affairs &<br />
Nutrition Communication – AJ/Se<br />
28 May 2008<br />
Page 8 of 16<br />
Table 2: GI and II values (based on glucose as reference) for isomaltulose, sucrose and maltodextrin<br />
determined at the Sydney University’s Glycaemic Index Research Service (2002).<br />
Carbohydrate GI II<br />
Isomaltulose 32 30<br />
Sucrose 68 64<br />
Maltodextrin 86 79<br />
Glucose 100 100<br />
Similar findings were made in previous studies. In the study of Macdonald and Daniel<br />
(1983), ten healthy volunteers (age 18-35), who were adapted to isomaltulose by 8 test<br />
meals, were given varying doses of up to 1 g/kg body weight of isomaltulose or sucrose<br />
dissolved in water after overnight fasting. Blood glucose samples were taken before and at<br />
certain intervals for a period of 90 minutes after intake for the determination of glucose,<br />
fructose and insulin concentrations.<br />
Blood glucose and insulin levels increased more slowly and reached lower peaks after<br />
isomaltulose than after sucrose intake. While the blood glucose level typically returned to<br />
baseline within 60 minutes after sucrose intake, it had not returned to baseline by 80<br />
minutes after isomaltulose intake at the higher concentrations. Also plasma insulin and<br />
fructose levels were only about half with isomaltulose compared with sucrose.<br />
Livesey (2004) reanalysed the blood glucose and insulin curves of this study and calculated<br />
GI values between 34 and 49 and II values between 17 and 31 from them.<br />
Kawai et al (1985, 1989) compared changes in blood glucose and insulin levels in response<br />
to the consumption of isomaltulose or sucrose (50g in 150 ml water, after overnight fasting)<br />
in healthy (n=8 resp. n=10) and non-insulin dependent type 2 diabetic volunteers (n=10)<br />
over 120 minutes (healthy) or 180 minutes (diabetics), respectively. In healthy subjects,<br />
plasma glucose after isomaltulose intake gradually increased and maintained plateau until<br />
120 minutes after intake. After sucrose intake, as opposed to isomaltulose, blood glucose<br />
levels showed a significantly higher increase with a distinct peak at 30 minutes and<br />
returned to the initial baseline level within 120 minutes. The corresponding insulin curves<br />
followed these patterns, respectively. The overall blood glucose and insulin responses were<br />
lower after isomaltulose than after sucrose.<br />
Livesey (2004) calculated a GI of 32 (both times) and II values of 22 and 26, respectively,<br />
for these blood glucose and insulin curves of isomaltulose in healthy volunteers.<br />
In diabetics, the blood glucose and insulin levels following isomaltulose and sucrose<br />
increased more gradually than in healthy subjects. However, as with the healthy, the blood<br />
glucose rise after isomaltulose occurred more slowly and was lower than after sucrose.
CONFIDENTIAL<br />
Regulatory Affairs &<br />
Nutrition Communication – AJ/Se<br />
28 May 2008<br />
Page 9 of 16<br />
The data demonstrate that isomaltulose has a lower glycemic response than sucrose in<br />
healthy subjects as well as in diabetics.<br />
Similar results were reported by Liao et al (2001) after intake of 75 g isomaltulose or<br />
sucrose in an aqueous solution in diabetic and non-diabetic volunteers (n=10 in each<br />
group). Blood glucose, insulin and lipid levels were measured over 180 minutes and<br />
significantly lower peak values and areas under the curves of blood glucose and insulin<br />
after isomaltulose than after sucrose were reported in both groups.<br />
In all studies mentioned above isomaltulose was consumed as an aqueous solution,<br />
accordingly these studies reflect the intake in drinks/beverages. In the more complex food<br />
matrixes of solid food, other factors that have an influence on blood glucose and insulin<br />
levels may play a role. Examples of influencing factors are given in Table 3.<br />
Table 3: Factors also influencing the glycemic effect of a food<br />
Factors influencing GI<br />
(Examples)<br />
Decreasing effects Increasing effects<br />
Nature of starch High amylose part High amylopectin part<br />
Nature of mono-, di- and<br />
oligosaccharides<br />
Isomaltulose, fructose,<br />
oligofructose<br />
Dietary fibres Guar, ß-glucan, inulin<br />
Glucose, sucrose<br />
Method of processing Parboiling, cold extrusion Conv. cooking, HTHS 2<br />
extrusion, flaking, puffing<br />
Particle size Large particles Small particles<br />
Ripeness and food storage Unripeness, cooling Ripeness<br />
Alpha-amylase inhibitors Lectins, phytates<br />
Interactions with other nutrients Fat / protein (high) Fat / protein (low)<br />
2 HTHS: High Temperature High Shear
CONFIDENTIAL<br />
Regulatory Affairs &<br />
Nutrition Communication – AJ/Se<br />
28 May 2008<br />
Page 10 of 16<br />
4. Discussion: General Characteristics of the Glycemic and Insulinemic Properties of<br />
Isomaltulose as compared to Sucrose<br />
After more than 20 years of research, in the past years there has been increasing<br />
awareness and attention within the nutrition and health community as well as on a<br />
consumer level towards the role of low glycemic carbohydrate foods within a healthy diet. A<br />
steadily growing body of research shows that the carbohydrate-based diet recommended<br />
for the general population should be based on mainly low-glycemic carbohydrates, as<br />
parameters associated with the development of typical Western chronic diseases like<br />
obesity, diabetes, coronary heart disease and possibly some types of cancer are influenced<br />
beneficially, as compared to a carbohydrate-based high-glycemic diet. In other words, the<br />
low-fat high-carbohydrate diet as advocated by WHO as well as health organisations in<br />
Western countries could be further improved by switching from high glycemic to low<br />
glycemic food choices. In this respect, WHO recommended in their expert consultation<br />
paper on carbohydrates in 1998 to also consider the glycemic effect of food carbohydrates<br />
when choosing between foods of similar composition within food groups. Since then, a<br />
number of publications reviewed the scientific literature of the last 20 years of research in<br />
this field in detail and strengthened the “good evidence” mentioned above (e.g. Augustin et<br />
al 2002; Ludwig 2002; Jenkins 2002; Leeds 2002; Willett et al 2002; Brand-Miller et al<br />
2003; Oppermann et al 2004; Berg et al 2005).<br />
While high glycemic carbohydrates are characterised by a fast release and higher blood<br />
glucose levels resulting in greater insulin demand, low glycemic carbohydrates cause only<br />
a slower and overall low increase in blood glucose and corresponding insulin levels.<br />
Further influencing factors are summarized earlier in this paper (Table 3).<br />
Typical blood glucose and insulin changes in response to 50 g intake of isomaltulose and<br />
sucrose are shown in Figures 5 and 6. These curves are based on a retrospective analysis<br />
by Livesey (2004) taking the above mentioned studies (see under point 3) into account.
CONFIDENTIAL<br />
Rise in blood glucose (mmol/L)<br />
3,00<br />
2,50<br />
2,00<br />
1,50<br />
1,00<br />
0,50<br />
0,00<br />
0 30 60 90 120<br />
-0,50<br />
Time (min)<br />
Regulatory Affairs &<br />
Nutrition Communication – AJ/Se<br />
28 May 2008<br />
Page 11 of 16<br />
Sucrose<br />
Palatinose<br />
Figure 5: Retrospective analysis (Livesey 2004) - Typical blood glucose curves in response to isomaltulose<br />
(Palatinose) and sucrose, as mean values of blood glucose and insulin measurements after intake of 50 g<br />
isomaltulose or sucrose in healthy adults.<br />
Rise in blood insulin (pmol/L)<br />
120<br />
100<br />
80<br />
60<br />
40<br />
20<br />
0<br />
0 30 60 90 120<br />
Time (min)<br />
Sucrose<br />
Palatinose<br />
Figure 6: Retrospective analysis (Livesey 2004) - Typical insulin curves in response to isomaltulose<br />
(Palatinose) and sucrose, as mean values of blood glucose and insulin measurements after intake of 50 g<br />
isomaltulose or sucrose in healthy adults.
CONFIDENTIAL<br />
Regulatory Affairs &<br />
Nutrition Communication – AJ/Se<br />
28 May 2008<br />
Page 12 of 16<br />
In this retrospective analysis, Livesey also calculated the corresponding GI and II values for<br />
the individual studies (Table 6). He obtained GI values between 32 and 49 with a mean GI<br />
of 37 and II values between 17 and 31 with a mean II of 25.<br />
Table 4: Average GI and II values of isomaltulose (intake as drink solution) calculated by Livesey<br />
(2004) in a retrospective data analysis of published blood glucose measurements.<br />
Study Dose [g] Type of subjects GI II<br />
SUGiRS 50 Healthy 32 27<br />
Macdonald and Daniel<br />
1983<br />
0,25 g/kg b.w. (~17,5) Healthy 45 17<br />
0,5 g/kg b.w. (~35) Healthy 49 28<br />
0,75 g/kg b.w. (~52,5) Healthy 37 31<br />
1,0 g/kg b.w. (~70) Healthy 34 25<br />
Kawai et al 1985 50 Healthy 32 22<br />
Kawai et al 1989 50 Healthy 32 26<br />
GI 37<br />
(32 – 49)<br />
II 25<br />
(17 – 31)<br />
Sucrose is known to cause a fast and high increase in blood glucose and insulin levels<br />
followed by a fast decrease which might include a drop down below baseline as an<br />
overreaction (hypoglycaemic reaction). This is a common pattern for medium to high<br />
glycemic carbohydrates. The physiological characteristics of isomaltulose differ significantly<br />
from those of sucrose.<br />
Isomaltulose is low glycemic<br />
Blood glucose measurements with both healthy and diabetic volunteers showed that – as a<br />
consequence of the lower rate of hydrolysis and subsequent slower absorption from the<br />
small intestine – isomaltulose exerts an overall low blood glucose rise over a longer period<br />
of time. The maximum rise in blood glucose concentration (peak) after isomaltulose was<br />
typically less than half that of sucrose. And also the total blood glucose response to the<br />
consumption of isomaltulose, as reflected by its GI, was significantly lower (about 32% of<br />
glucose) than sucrose (about 68% of glucose), (Sydney University’s Glycaemic Research<br />
Service (SUGiRS) 2002).<br />
For the purpose of comparison, foods or individual carbohydrates are classified – based on<br />
their GI – into high glycemic (GI of 70 or more), medium glycemic (GI of 56-69), and low<br />
glycemic (GI of 55 or less), (Brand-Miller et al 1999, Livesey 2003). A further class of very<br />
low glycemic (GI of 40 or less) was defined as well (Livesey 2003). According to this<br />
classification, isomaltulose is low or even very low glycemic and has the potential to reduce<br />
the glycemic properties of a food.
CONFIDENTIAL<br />
Regulatory Affairs &<br />
Nutrition Communication – AJ/Se<br />
28 May 2008<br />
Page 13 of 16<br />
Isomaltulose is low insulinemic<br />
Blood glucose concentrations are tightly regulated by a hormonal regulatory system in<br />
order to facilitate constant glucose supply. A rise in blood glucose concentrations following<br />
a meal (hyperglycemia) stimulates the release of the hormone insulin (and inhibits the<br />
release of the antagonist glucagons and others). Insulin promotes the uptake of glucose<br />
(and other nutrients) by the muscles and adipose tissue bringing blood glucose levels back<br />
to normal.<br />
The low rise in blood glucose concentrations after isomaltulose intake is associated with a<br />
low insulin demand, respectively. The insulin response to isomaltulose ingestion, according<br />
to the II value, was 30% of that of glucose, while the insulin response to sucrose was 64%<br />
of that of glucose (Sydney University’s Glycaemic Research Service (SUGiRS) 2002).<br />
Isomaltulose is not associated with a pronounced relative hypoglycemia<br />
Typical blood glucose curves of sucrose show a pronounced phase of relative<br />
hypoglycemia. Sucrose is rapidly digested and absorbed from the small intestine. The<br />
corresponding rapid and high rise in blood glucose concentrations exerts a strong<br />
stimulation on insulin release. While nutrient absorption from sucrose rapidly declines<br />
shortly after, the effects of high insulin and low glucagon levels still remain causing blood<br />
glucose levels to drop rapidly and below baseline into a state of relative hypoglycemia.<br />
Isomaltulose, unlike sucrose, is not associated with a pronounced hypoglycaemic phase.<br />
Isomaltulose provides glucose over a longer period of time (prolonged energy<br />
supply)<br />
After sucrose ingestion, blood glucose levels returned to near baseline levels (or even<br />
below baseline) after 1 hour in most of the studies with healthy volunteers. In contrast,<br />
blood glucose levels after isomaltulose remained elevated at a lower level but for a longer<br />
period of time, typically lasting for most of the entire measurement of 90 minutes<br />
(Macdonald and Daniel 1983) or 120 minutes (Kawai et al 1985, 1989; SUGiRS 2002). This<br />
means, the phase during which glucose is supplied to the cells is longer after isomaltulose<br />
than after sucrose. Glucose delivery time to the cells is prolonged by isomaltulose.<br />
Glucose is ‘fuel’ for the body, it is the energy supply to the cells, e.g. in the brain and<br />
muscles. An extended glucose supply means an extended energy supply in the form of<br />
glucose to the cells.
CONFIDENTIAL<br />
Regulatory Affairs &<br />
Nutrition Communication – AJ/Se<br />
28 May 2008<br />
Page 14 of 16<br />
5. Conclusion<br />
Isomaltulose is a ‘slow release carbohydrate’. Due to its digestion properties, isomaltulose<br />
is a well tolerated ‘available carbohydrate’. It is a glucose provider for the body and an<br />
energy provider as well, supplying glucose at a lower level (avoiding pronounced<br />
hyperglycaemic and hypoglycaemic phases) for a prolonged time compared to sucrose.<br />
Isomaltulose is low glycemic and low insulinemic whilst providing the same total calories as<br />
sucrose.<br />
Having these physiological properties in mind, isomaltulose is a carbohydrate for<br />
people following a healthy and active lifestyle. Isomaltulose is a useful tool to bring a<br />
carbohydrate-based low-glycemic diet into practice.
CONFIDENTIAL<br />
References<br />
Regulatory Affairs &<br />
Nutrition Communication – AJ/Se<br />
28 May 2008<br />
Page 15 of 16<br />
Augustin, L.S., Franceschi, S., Jenkins, D.J.A., Kendall, C.W.C. , La Vecchia, C. (2002) Glycemic index in<br />
chronic disease - a review. Eur J Clin Nutr 56, 1049-1071.<br />
Brand-Miller, J., Wolever, T.M.S., Colagiuri, S., Foster-Powell, K. (1999) The Glucose Revolution. Marlow<br />
and Company, New York.<br />
Brand-Miller, J., Wolever, T.M.S., Colagiuri, S., Foster-Powell, K. (1999) The Glucose Revolution. Marlow<br />
and Company, New York.<br />
Brand-Miller, J., Hayne, S., Petocz, P., Colagiuri, S. (2003) Low glycemic index diets in the management of<br />
diabetes: a meta-analysis of randomised controlled trials. Diabetes Care 26, 2261-2267.<br />
Dahlqvist, A. (1961) Hydrolysis of Palatinose (isomaltulose) by pig intestinal glycosidases. Acta Chem Scan<br />
15, 808-816.<br />
Dahlquist, A., Auricchio, S., Semenza, G., Prader,A. (1963) Human intestinal disaccharidases and heriditary<br />
disaccaride intolerance. The hydrolysis of sucrose, isomaltulose, Palatinose (isomaltulose) and a<br />
1,6-α-oligosaccharide (isomalto-oligosaccharide) preparation. J Clin Invest, 42, 556-562.<br />
Eggleston, G., Grisham, M. (2003) Oligosacchrides in cane and their formation on cane deterioration. In:<br />
ACS Symposium Series 849,Chapter 16, 211-232.<br />
EU Commission Decision 2005/581/EC of 25 th July 2005 authorising the placing on the market of<br />
isomaltulose as a novel food or novel food ingredient under Regulation (EC) No 258/97of the European<br />
Parliament and of the Council. Official Journal of the European Union of 29.7.2005, L199/90 – 91.<br />
FAO/WHO (1998) Carbohydrates in human nutrition. In FAO Nutrition Paper No.66. Rome, FAO.<br />
FDA (2006) – US GRAS Notification No 0184 on isomaltulose.<br />
Gostner, A., Holub, S., Theis, S., Volk, A., Kozianowski, G., Scheppach, W. (2006) Intestinal digestibility of<br />
isomaltulose (Palatinose) in patients with ileostoma [Intestinale Verdaulichkeit von Palatinose bei<br />
Patienten mit Ileostoma]. Z. Gastroenterol 44, 1073-1094. [Abstract P 18; poster presented at the 34 th<br />
Congress of the German Society of Gastroenterology (Gesellschaft für Gastroenterologie), 26.-<br />
28.10.2006, Rosenheim].<br />
Grupp, U., Siebert, G. (1978) Metabolism of hydrogenated isomaltulose, an equimolar mixture of alpha-Dglucopyranosido-1,6-sorbitol<br />
and alpha-D-glucopyranosido-1,6-mannitol. Res Exp Med (Berl.) 173, 261-<br />
278.<br />
Günther, S., Heymann, H. (1998) Di- and oligosaccharide substrate specificities and subsite binding<br />
energies of pig intestinal glucoamylase-maltase. Arch Biochem Biophys 354, 111-116.<br />
Heinz, F. (1987) Enzymatische Spaltung von Zuckeraustauschstoffen durch isolierte Enzyme und<br />
Enzymkomplexe der Dünndarmmukosa. Medizinische Hochschule Hannover, Zentrum Biochemie,<br />
Universität Hannover, Forschungsvorhaben 6539.<br />
Heymann, H., Heinz,F. (1987) Kinetic studies on glucoamylase/maltase and sucrase/isomaltase complex of<br />
human, pig and rat intestinal mucosa. 4 th European Carbohydrate Symposium, Darmstadt, (12.-<br />
17.07.87).<br />
Jenkins, D.J.A., Kendall, C.W.C., Augustin, L.S.A., Franceschi, S., Hamidi, M., Marchie, A., Jenkins, A.L.,<br />
Axelsen, M. (2002) Glycemic index: overview of implications in health and disease. Am J Clin Nutr 76,<br />
266S-273S.
CONFIDENTIAL<br />
Regulatory Affairs &<br />
Nutrition Communication – AJ/Se<br />
28 May 2008<br />
Page 16 of 16<br />
Kawai, K., Okuda, Y., Yamashita, K. (1985) Changes in blood glucose and insulin after an oral Isomaltulose<br />
administration in normal subjects. Endocrinol Jpn 32, 933-936.<br />
Kawai, K., Yoshikawa, H., Muryama, Y., Okuda, Y., Yamashita, K. (1989) Usefulness of Isomaltulose as a<br />
caloric sweetener for diabetic patients. Horm Metabol Res 21, 338-340.<br />
Leeds, A.R. (2002) Glycemic index and heart disease. Am J Clin Nutr 76 (1) 286S-189S.<br />
Liao, Z.H., Li, Y.B., Yao, B., Fan, H.D., Hu, G.L., Weng, J.P. (2001). The effects of isomaltulose on blood<br />
glucose and lipids for diabetic subjects. Diabetes 50 Suppl., 1530-P, A366.<br />
Lina, B.A.R., Jonker, D., Kozianowski, G. (2002) Isomaltulose (Palatinose): a review of biological and<br />
toxicological studies. Food Chem Tox 40, 1375-1381.<br />
Livesey, G. (2003) Health potential of polyols as sugar replacers, with emphasis on low glyaemic properties.<br />
Nutr Res Rev 16, 163-191.<br />
Livesey, G. (2004) Retrospective analysis on the glycemic and insulinemic response curves to isomaltulose<br />
in healthy humans. Expert opinion within personal communication.<br />
Ludwig (2002) The gylcemic index – physiological mechanisms relating to obesity, diabetes, and<br />
cardiovascular disease. JAMA 287, 2414-2423.<br />
Macdonald, M., Daniel, J.W. (1983) The bio-availability of isomaltulose in man and rat. Nutr Rep Int 28,<br />
1083-1090.<br />
Oppermann, A.M., Venter, C.S., Oosthuizen, W., Thompson, R.L., Vorster, H.H. (2004) Meta-analysis of the<br />
health effects of using the glycaemic index in meal-planning. Br J Nutr 92, 367-81.<br />
Siddiqui, I.R., Furgala, B. (1967) Isolation and characterization of oligosaccharides from honey. Part I:<br />
Disaccharides. J Agric Res 6, 139-145.<br />
Sydney University’s Glycaemic Research Service (SUGiRS) (2002) Glycaemic Index Report – Isomaltulose.<br />
Unpublished. See also: Sydney University: GI Database at www.glycemicindex.com<br />
Tsuji, Y., Yamada,K., Hosoya, N., Moriuchi, S. (1986) Digestion and absorption of sugars and sugar<br />
substitutes in rat small intestine. J Nutr Sci Vitaminol 32, 93-100.<br />
Van Weerden, E:J:, Huisman, J., Van Leeuwen, P. (1983) Digestion processes of isomaltulose and<br />
saccharose in the small and large intestine of the pig. ILOB-Report No. 520.<br />
Weidenhagen, R., Lorenz, S. (1957) Isomaltulose TM (6-α-Glucopyranosido-fructofuranose), ein neues<br />
bakterielles Umwandlungsprodukt der Saccharose. Zeitschrift für die Zuckerindustrie 7 (11), 533-534.<br />
Willet, W., Manson, J., Liu, S. (2002) Glycemic index, glycemic load, and risk of type 2 diabetes. Am J Clin<br />
Nutr 76 (suppl) 274S-280S.<br />
Yamada, K., Shinohara, H. Hosoya, N. (1985) Hydrolysis of 1-0-alpha-D-glucopyranosyl-D-fructofuranose<br />
(Trehalulose) by rat intestinal sucrase-isomaltase complex. Nutr Rep Int 32, 1211-1220.<br />
Ziesenitz, S.C. (1986a) Zur Verwertung des Zuckeraustauschstoffs Palatinit® im Stoffwechsel. Beiträge zu<br />
Infusionstherapie und Klinische Ernährung 16, 120-132.<br />
Ziesenitz, S.C. (1986b) Stufenweises Prüfschema für Zuckeraustauschstoffe – Vorprüfung mittels<br />
Enzymen. 3. Carbohydrasen aus Jejunalmucosa des Menschen. Z Ernährungswiss 25, 253-258.
Annex 1.8: Report from Imfeld (University of Zürich): “Pilot<br />
Study on the Dental Care Properties of Isomaltulose<br />
(PalatinoseTM)”.
Annex 2.1: “The Determination of a Caloric Value for Inulin<br />
and Oligofructose”, Cantox Inc., 1999.
Annex 2.2: Roberfroid, M.B., 1999; “Caloric Value of Inulin<br />
and Oligofructose”.
Annex 3.1: Scientific Evaluation by FASEB, 1994;<br />
“Evaluation of the Energy of Certain Sugar Alcohols used as<br />
Food Ingredients”
Annex 3.2: “Letter of no objection” from USA for the<br />
caloric value of 2.0 kcal/g for isomalt.
Annex 4.1: Codex Alimentarius CAC/GL 23‐1997<br />
“Guidelines for Use of Nutrition and Health Claims”, Table<br />
of Conditions for Nutrient Content.
1 Nutrition and Health Claims (CAC/GL 23-1997)<br />
1. SCOPE<br />
GUIDELINES FOR USE OF NUTRITION AND HEALTH CLAIMS<br />
Adopted in 1997. Revised in 2004. Amended in 2001, 2008 and 2009.<br />
CAC/GL 23-1997<br />
Nutrition claims should be consistent with national nutrition policy and support that policy. Only nutrition claims<br />
that support national nutrition policy should be allowed.<br />
Health claims should be consistent with national health policy, including nutrition policy, and support such<br />
policies where applicable. Health claims should be supported by a sound and sufficient body of scientific<br />
evidence to substantiate the claim, provide truthful and non-misleading information to aid consumers in<br />
choosing healthful diets and be supported by specific consumer education. The impact of health claims on<br />
consumers’ eating behaviours and dietary patterns should be monitored, in general, by competent authorities.<br />
Claims of the type described in section 3.4 of the Codex General Guidelines on Claims are prohibited.<br />
1.1 These guidelines relate to the use of nutrition and health claims in food labelling and, where required by the<br />
authorities having jurisdiction, in advertising 1 .<br />
1.2 These guidelines apply to all foods for which nutrition and health claims are made without prejudice to specific<br />
provisions under Codex standards or Guidelines relating to Foods for Special Dietary Uses and Foods for<br />
Special Medical Purposes.<br />
1.3 These guidelines are intended to supplement the Codex General Guidelines on Claims and do not supersede<br />
any prohibitions contained therein.<br />
1.4 Nutrition and health claims shall not be permitted for foods for infants and young children except where<br />
specifically provided for in relevant Codex standards or national legislation.<br />
2. DEFINITIONS<br />
2.1 Nutrition claim means any representation which states, suggests or implies that a food has particular<br />
nutritional properties including but not limited to the energy value and to the content of protein, fat and<br />
carbohydrates, as well as the content of vitamins and minerals. The following do not constitute nutrition claims:<br />
(a) the mention of substances in the list of ingredients;<br />
(b) the mention of nutrients as a mandatory part of nutrition labelling;<br />
(c) quantitative or qualitative declaration of certain nutrients or ingredients on the label if required by national<br />
legislation.<br />
2.1.1 Nutrient content claim is a nutrition claim that describes the level of a nutrient contained in a food.<br />
(Examples: “source of calcium”; “high in fibre and low in fat”.)<br />
2.1.2 Nutrient comparative claim is a claim that compares the nutrient levels and/or energy value of two or more<br />
foods.<br />
(Examples: “reduced”; “less than”; “fewer”; “increased”; “more than”.)<br />
2. 2 Health claim means any representation that states, suggests, or implies that a relationship exists between a<br />
food or a constituent of that food and health. Health claims include the following:<br />
2.2.1 Nutrient function claims – a nutrition claim that describes the physiological role of the nutrient in growth,<br />
development and normal functions of the body.<br />
1 Advertising means any commercial communication to the public, by any means other than labelling, in order to promote directly or indirectly, the sale or<br />
intake of a food through the use of nutrition and health claims in relation to the food and its ingredients.
2 Nutrition and Health Claims (CAC/GL 23-1997)<br />
Example:<br />
“Nutrient A (naming a physiological role of nutrient A in the body in the maintenance of health and<br />
promotion of normal growth and development). Food X is a source of/ high in nutrient A.”<br />
2.2.2 Other function claims – These claims concern specific beneficial effects of the consumption of foods or their<br />
constituents, in the context of the total diet on normal functions or biological activities of the body. Such claims<br />
relate to a positive contribution to health or to the improvement of a function or to modifying or preserving<br />
health.<br />
Examples:<br />
“Substance A (naming the effect of substance A on improving or modifying a physiological function or<br />
biological activity associated with health). Food Y contains x grams of substance A.”<br />
2.2.3 Reduction of disease risk claims – Claims relating the consumption of a food or food constituent, in the<br />
context of the total diet, to the reduced risk of developing a disease or health-related condition.<br />
Risk reduction means significantly altering a major risk factor(s) for a disease or health-related condition.<br />
Diseases have multiple risk factors and altering one of these risk factors may or may not have a beneficial<br />
effect. The presentation of risk reduction claims must ensure, for example, by use of appropriate language and<br />
reference to other risk factors, that consumers do not interpret them as prevention claims.<br />
Examples:<br />
“A healthful diet low in nutrient or substance A may reduce the risk of disease D.<br />
Food X is low in nutrient or substance A.”<br />
“A healthful diet rich in nutrient or substance A may reduce the risk of disease D.<br />
Food X is high in nutrient or substance A.”<br />
3. NUTRITION LABELLING<br />
Any food for which a nutrition or health claim is made should be labelled with a nutrient declaration in accordance<br />
with Section 3 of the Codex Guidelines on Nutrition Labelling.<br />
4. NUTRITION CLAIMS<br />
4.1 The only nutrition claims permitted shall be those relating to energy, protein, carbohydrate, and fat and<br />
components thereof, fibre, sodium and vitamins and minerals for which Nutrient Reference Values (NRVs)<br />
have been laid down in the Codex Guidelines for Nutrition Labelling.<br />
5. NUTRIENT CONTENT CLAIMS<br />
5.1 When a nutrient content claim that is listed in the Table to these Guidelines or a synonymous claim is made,<br />
the conditions specified in the Table for that claim should apply.<br />
5.2 Where a food is by its nature low in or free of the nutrient that is the subject of the claim, the term describing<br />
the level of the nutrient should not immediately precede the name of the food but should be in the form “a low<br />
(naming the nutrient) food” or “a (naming the nutrient)-free food”.<br />
6. COMPARATIVE CLAIMS<br />
Comparative claims should be permitted subject to the following conditions and based on the food as sold,<br />
taking into account further preparation required for consumption according to the instructions for use on the<br />
label:<br />
6.1 The foods being compared should be different versions of the same food or similar foods. The foods being<br />
compared should be clearly identified.<br />
6.2 A statement of the amount of difference in the energy value or nutrient content should be given. The following<br />
information should appear in close proximity to the comparative claim:<br />
6.2.1 The amount of difference related to the same quantity, expressed as a percentage, fraction, or an absolute<br />
amount. Full details of the comparison should be given.<br />
6.2.2 The identity of the food(s) to which the food is being compared. The food(s) should be described in such a<br />
manner that it (they) can be readily identified by consumers.
3 Nutrition and Health Claims (CAC/GL 23-1997)<br />
6.3 The comparison should be based on a relative difference of at least 25% in the energy value or nutrient<br />
content, except for micronutrients where a 10% difference in the NRV would be acceptable, between the<br />
compared foods and a minimum absolute difference in the energy value or nutrient content equivalent to the<br />
figure defined as “low” or as a “source” in the Table to these Guidelines.<br />
6.4 The use of the word “light” should follow the same criteria as for “reduced” and include an indication of the<br />
characteristics which make the food “light”.<br />
7. HEALTH CLAIMS<br />
7.1 Health claims should be permitted provided that all of the following conditions are met:<br />
7.1.1 Health claims must be based on current relevant scientific substantiation and the level of proof must be<br />
sufficient to substantiate the type of claimed effect and the relationship to health as recognized by generally<br />
accepted scientific review of the data and the scientific substantiation should be reviewed as new knowledge<br />
becomes available. 2 The health claim must consist of two parts:<br />
1) Information on the physiological role of the nutrient or on an accepted diet-health relationship; followed by<br />
2) Information on the composition of the product relevant to the physiological role of the nutrient or the<br />
accepted diet-health relationship unless the relationship is based on a whole food or foods whereby the<br />
research does not link to specific constituents of the food.<br />
7.1.2 Any health claim must be accepted by or be acceptable to the competent authorities of the country where the<br />
product is sold.<br />
7.1.3 The claimed benefit should arise from the consumption of a reasonable quantity of the food or food constituent<br />
in the context of a healthy diet.<br />
7.1.4 If the claimed benefit is attributed to a constituent in the food, for which a Nutrient Reference value is<br />
established, the food in question should be:<br />
(i) a source of or high in the constituent in the case where increased consumption is recommended; or,<br />
(ii) low in, reduced in, or free of the constituent in the case where reduced consumption is recommended.<br />
Where applicable, the conditions for nutrient content claims and comparative claims will be used to<br />
determine the levels for “high”, “low”, “reduced”, and “free”.<br />
7.1.5 Only those essential nutrients for which a Nutrient Reference Value (NRV) has been established in the Codex<br />
Guidelines on Nutrition Labelling or those nutrients which are mentioned in officially recognized dietary<br />
guidelines of the national authority having jurisdiction, should be the subject of a nutrient function claim.<br />
7.2 Health claims should have a clear regulatory framework for qualifying and/or disqualifying conditions for<br />
eligibility to use the specific claim, including the ability of competent national authorities to prohibit claims<br />
made for foods that contain nutrients or constituents in amounts that increase the risk of disease or an<br />
adverse health-related condition. The health claim should not be made if it encourages or condones excessive<br />
consumption of any food or disparages good dietary practice.<br />
7.3 If the claimed effect is attributed to a constituent of the food, there must be a validated method to quantify the<br />
food constituent that forms the basis of the claim.<br />
7.4 The following information should appear on the label or labelling of the food bearing health claims:<br />
7.4.1 A statement of the quantity of any nutrient or other constituent of the food that is the subject of the claim.<br />
7.4.2 The target group, if appropriate.<br />
7.4.3 How to use the food to obtain the claimed benefit and other lifestyle factors or other dietary sources, where<br />
appropriate.<br />
7.4.4 If appropriate, advice to vulnerable groups on how to use the food and to groups, if any, who need to avoid the<br />
food.<br />
7.4.5 Maximum safe intake of the food or constituent where necessary.<br />
2 Reference to the Scientific Criteria for Health Related Claims being developed by the Codex Committee on Nutrition and Foods for Special Dietary Uses<br />
should be inserted here.
4 Nutrition and Health Claims (CAC/GL 23-1997)<br />
7.4.6 How the food or food constituent fits within the context of the total diet.<br />
7.4.7 A statement on the importance of maintaining a healthy diet.<br />
8. CLAIMS RELATED TO DIETARY GUIDELINES OR HEALTHY DIETS<br />
Claims that relate to dietary guidelines or “healthy diets” should be permitted subject to the following<br />
conditions:<br />
8.1 Only claims related to the pattern of eating contained in dietary guidelines officially recognized by the<br />
appropriate national authority.<br />
8.2 Flexibility in the wording of claims is acceptable, provided the claims remain faithful to the pattern of eating<br />
outlined in the dietary guidelines.<br />
8.3 Claims related to a “healthy diet” or any synonymous term are considered to be claims about the pattern of<br />
eating contained in dietary guidelines and should be consistent with the guidelines.<br />
8.4 Foods which are described as part of a healthy diet, healthy balance, etc., should not be based on selective<br />
consideration of one or more aspects of the food. They should satisfy certain minimum criteria for other major<br />
nutrients related to dietary guidelines.<br />
8.5 Foods should not be described as “healthy” or be represented in a manner that implies that a food in and of<br />
itself will impart health.<br />
8.6 Foods may be described as part of a “healthy diet” provided that the label carries a statement relating the food<br />
to the pattern of eating described in the dietary guidelines.<br />
Table of conditions for nutrient contents<br />
COMPONENT CLAIM CONDITIONS (not more than)<br />
Energy<br />
Fat<br />
Saturated Fat<br />
Cholesterol<br />
Low<br />
40 kcal (170 kJ) per 100 g (solids)<br />
or<br />
20 kcal (80 kJ) per 100 ml (liquids)<br />
Free 4 kcal per 100 ml (liquids)<br />
Low<br />
3 g per 100 g (solids)<br />
1.5 g per 100 ml (liquids)<br />
Free 0.5 g per 100 g (solids) or 100 ml (liquids)<br />
Low 3<br />
Free<br />
Low 3<br />
Free<br />
Sugars Free<br />
1.5 g per 100 g (solids)<br />
0.75 g per 100 ml (liquids)<br />
and 10% of energy<br />
0.1 g per 100 g (solids)<br />
0.1 g per 100 ml (liquids)<br />
0.02 g per 100 g (solids)<br />
0.01 g per 100 ml (liquids)<br />
0.005 g per 100 g (solids)<br />
0.005 g per 100 ml (solids)<br />
and, for both claims, less than:1.5 g saturated fat per 100 g (solids)<br />
0.75 g saturated fat per 100 ml (liquids)<br />
and 10% of energy of saturated fat<br />
0.5 g per 100 g (solids)<br />
0.5 g per 100 ml (liquids)<br />
3<br />
In the case of the claim “low in saturated fat”, trans fatty acids should be taken into account where applicable. This provision consequentially applies to<br />
foods claimed to be “low in cholesterol” and “cholesterol free”.
5 Nutrition and Health Claims (CAC/GL 23-1997)<br />
COMPONENT CLAIM CONDITIONS (not less than)<br />
Sodium<br />
Protein<br />
Vitamins and Minerals<br />
Dietary Fibre<br />
Low 0.12 g per 100 g<br />
Very Low 0.04 g per 100 g<br />
Free 0.005 g per 100 g<br />
Source<br />
10% of NRV per 100 g (solids)<br />
5% of NRV per 100 ml (liquids)<br />
or 5% of NRV per 100 kcal (12% of NRV per 1 MJ)<br />
or 10% of NRV per serving<br />
High 2 times the values for “source”<br />
Source<br />
15% of NRV per 100 g (solids)<br />
7.5% of NRV per100 ml (liquids)<br />
or 5% of NRV per 100 kcal (12% of NRV per 1 MJ)<br />
or 15% of NRV per serving<br />
High 2 times the value for “source”<br />
Source<br />
High<br />
3 g per 100 g 4 or 1.5 g per 100 kcal<br />
or 10 % of daily reference value per serving 5<br />
6 g per 100 g 4 or 3 g per 100 kcal<br />
or 20 % of daily reference value per serving 5<br />
4 Conditions for nutrient content claims for dietary fibre in liquid foods to be determined at national level.<br />
5 Serving size and daily reference value to be determined at national level.
Annex 3.1: Scientific Evaluation by FASEB, 1994;<br />
“Evaluation of the Energy of Certain Sugar Alcohols used as<br />
Food Ingredients”
Annex 3.2: “Letter of no objection” from USA for the<br />
caloric value of 2.0 kcal/g for isomalt.
Annex 4.1: Codex Alimentarius CAC/GL 23‐1997<br />
“Guidelines for Use of Nutrition and Health Claims”, Table<br />
of Conditions for Nutrient Content.
1 Nutrition and Health Claims (CAC/GL 23-1997)<br />
1. SCOPE<br />
GUIDELINES FOR USE OF NUTRITION AND HEALTH CLAIMS<br />
Adopted in 1997. Revised in 2004. Amended in 2001, 2008 and 2009.<br />
CAC/GL 23-1997<br />
Nutrition claims should be consistent with national nutrition policy and support that policy. Only nutrition claims<br />
that support national nutrition policy should be allowed.<br />
Health claims should be consistent with national health policy, including nutrition policy, and support such<br />
policies where applicable. Health claims should be supported by a sound and sufficient body of scientific<br />
evidence to substantiate the claim, provide truthful and non-misleading information to aid consumers in<br />
choosing healthful diets and be supported by specific consumer education. The impact of health claims on<br />
consumers’ eating behaviours and dietary patterns should be monitored, in general, by competent authorities.<br />
Claims of the type described in section 3.4 of the Codex General Guidelines on Claims are prohibited.<br />
1.1 These guidelines relate to the use of nutrition and health claims in food labelling and, where required by the<br />
authorities having jurisdiction, in advertising 1 .<br />
1.2 These guidelines apply to all foods for which nutrition and health claims are made without prejudice to specific<br />
provisions under Codex standards or Guidelines relating to Foods for Special Dietary Uses and Foods for<br />
Special Medical Purposes.<br />
1.3 These guidelines are intended to supplement the Codex General Guidelines on Claims and do not supersede<br />
any prohibitions contained therein.<br />
1.4 Nutrition and health claims shall not be permitted for foods for infants and young children except where<br />
specifically provided for in relevant Codex standards or national legislation.<br />
2. DEFINITIONS<br />
2.1 Nutrition claim means any representation which states, suggests or implies that a food has particular<br />
nutritional properties including but not limited to the energy value and to the content of protein, fat and<br />
carbohydrates, as well as the content of vitamins and minerals. The following do not constitute nutrition claims:<br />
(a) the mention of substances in the list of ingredients;<br />
(b) the mention of nutrients as a mandatory part of nutrition labelling;<br />
(c) quantitative or qualitative declaration of certain nutrients or ingredients on the label if required by national<br />
legislation.<br />
2.1.1 Nutrient content claim is a nutrition claim that describes the level of a nutrient contained in a food.<br />
(Examples: “source of calcium”; “high in fibre and low in fat”.)<br />
2.1.2 Nutrient comparative claim is a claim that compares the nutrient levels and/or energy value of two or more<br />
foods.<br />
(Examples: “reduced”; “less than”; “fewer”; “increased”; “more than”.)<br />
2. 2 Health claim means any representation that states, suggests, or implies that a relationship exists between a<br />
food or a constituent of that food and health. Health claims include the following:<br />
2.2.1 Nutrient function claims – a nutrition claim that describes the physiological role of the nutrient in growth,<br />
development and normal functions of the body.<br />
1 Advertising means any commercial communication to the public, by any means other than labelling, in order to promote directly or indirectly, the sale or<br />
intake of a food through the use of nutrition and health claims in relation to the food and its ingredients.
2 Nutrition and Health Claims (CAC/GL 23-1997)<br />
Example:<br />
“Nutrient A (naming a physiological role of nutrient A in the body in the maintenance of health and<br />
promotion of normal growth and development). Food X is a source of/ high in nutrient A.”<br />
2.2.2 Other function claims – These claims concern specific beneficial effects of the consumption of foods or their<br />
constituents, in the context of the total diet on normal functions or biological activities of the body. Such claims<br />
relate to a positive contribution to health or to the improvement of a function or to modifying or preserving<br />
health.<br />
Examples:<br />
“Substance A (naming the effect of substance A on improving or modifying a physiological function or<br />
biological activity associated with health). Food Y contains x grams of substance A.”<br />
2.2.3 Reduction of disease risk claims – Claims relating the consumption of a food or food constituent, in the<br />
context of the total diet, to the reduced risk of developing a disease or health-related condition.<br />
Risk reduction means significantly altering a major risk factor(s) for a disease or health-related condition.<br />
Diseases have multiple risk factors and altering one of these risk factors may or may not have a beneficial<br />
effect. The presentation of risk reduction claims must ensure, for example, by use of appropriate language and<br />
reference to other risk factors, that consumers do not interpret them as prevention claims.<br />
Examples:<br />
“A healthful diet low in nutrient or substance A may reduce the risk of disease D.<br />
Food X is low in nutrient or substance A.”<br />
“A healthful diet rich in nutrient or substance A may reduce the risk of disease D.<br />
Food X is high in nutrient or substance A.”<br />
3. NUTRITION LABELLING<br />
Any food for which a nutrition or health claim is made should be labelled with a nutrient declaration in accordance<br />
with Section 3 of the Codex Guidelines on Nutrition Labelling.<br />
4. NUTRITION CLAIMS<br />
4.1 The only nutrition claims permitted shall be those relating to energy, protein, carbohydrate, and fat and<br />
components thereof, fibre, sodium and vitamins and minerals for which Nutrient Reference Values (NRVs)<br />
have been laid down in the Codex Guidelines for Nutrition Labelling.<br />
5. NUTRIENT CONTENT CLAIMS<br />
5.1 When a nutrient content claim that is listed in the Table to these Guidelines or a synonymous claim is made,<br />
the conditions specified in the Table for that claim should apply.<br />
5.2 Where a food is by its nature low in or free of the nutrient that is the subject of the claim, the term describing<br />
the level of the nutrient should not immediately precede the name of the food but should be in the form “a low<br />
(naming the nutrient) food” or “a (naming the nutrient)-free food”.<br />
6. COMPARATIVE CLAIMS<br />
Comparative claims should be permitted subject to the following conditions and based on the food as sold,<br />
taking into account further preparation required for consumption according to the instructions for use on the<br />
label:<br />
6.1 The foods being compared should be different versions of the same food or similar foods. The foods being<br />
compared should be clearly identified.<br />
6.2 A statement of the amount of difference in the energy value or nutrient content should be given. The following<br />
information should appear in close proximity to the comparative claim:<br />
6.2.1 The amount of difference related to the same quantity, expressed as a percentage, fraction, or an absolute<br />
amount. Full details of the comparison should be given.<br />
6.2.2 The identity of the food(s) to which the food is being compared. The food(s) should be described in such a<br />
manner that it (they) can be readily identified by consumers.
3 Nutrition and Health Claims (CAC/GL 23-1997)<br />
6.3 The comparison should be based on a relative difference of at least 25% in the energy value or nutrient<br />
content, except for micronutrients where a 10% difference in the NRV would be acceptable, between the<br />
compared foods and a minimum absolute difference in the energy value or nutrient content equivalent to the<br />
figure defined as “low” or as a “source” in the Table to these Guidelines.<br />
6.4 The use of the word “light” should follow the same criteria as for “reduced” and include an indication of the<br />
characteristics which make the food “light”.<br />
7. HEALTH CLAIMS<br />
7.1 Health claims should be permitted provided that all of the following conditions are met:<br />
7.1.1 Health claims must be based on current relevant scientific substantiation and the level of proof must be<br />
sufficient to substantiate the type of claimed effect and the relationship to health as recognized by generally<br />
accepted scientific review of the data and the scientific substantiation should be reviewed as new knowledge<br />
becomes available. 2 The health claim must consist of two parts:<br />
1) Information on the physiological role of the nutrient or on an accepted diet-health relationship; followed by<br />
2) Information on the composition of the product relevant to the physiological role of the nutrient or the<br />
accepted diet-health relationship unless the relationship is based on a whole food or foods whereby the<br />
research does not link to specific constituents of the food.<br />
7.1.2 Any health claim must be accepted by or be acceptable to the competent authorities of the country where the<br />
product is sold.<br />
7.1.3 The claimed benefit should arise from the consumption of a reasonable quantity of the food or food constituent<br />
in the context of a healthy diet.<br />
7.1.4 If the claimed benefit is attributed to a constituent in the food, for which a Nutrient Reference value is<br />
established, the food in question should be:<br />
(i) a source of or high in the constituent in the case where increased consumption is recommended; or,<br />
(ii) low in, reduced in, or free of the constituent in the case where reduced consumption is recommended.<br />
Where applicable, the conditions for nutrient content claims and comparative claims will be used to<br />
determine the levels for “high”, “low”, “reduced”, and “free”.<br />
7.1.5 Only those essential nutrients for which a Nutrient Reference Value (NRV) has been established in the Codex<br />
Guidelines on Nutrition Labelling or those nutrients which are mentioned in officially recognized dietary<br />
guidelines of the national authority having jurisdiction, should be the subject of a nutrient function claim.<br />
7.2 Health claims should have a clear regulatory framework for qualifying and/or disqualifying conditions for<br />
eligibility to use the specific claim, including the ability of competent national authorities to prohibit claims<br />
made for foods that contain nutrients or constituents in amounts that increase the risk of disease or an<br />
adverse health-related condition. The health claim should not be made if it encourages or condones excessive<br />
consumption of any food or disparages good dietary practice.<br />
7.3 If the claimed effect is attributed to a constituent of the food, there must be a validated method to quantify the<br />
food constituent that forms the basis of the claim.<br />
7.4 The following information should appear on the label or labelling of the food bearing health claims:<br />
7.4.1 A statement of the quantity of any nutrient or other constituent of the food that is the subject of the claim.<br />
7.4.2 The target group, if appropriate.<br />
7.4.3 How to use the food to obtain the claimed benefit and other lifestyle factors or other dietary sources, where<br />
appropriate.<br />
7.4.4 If appropriate, advice to vulnerable groups on how to use the food and to groups, if any, who need to avoid the<br />
food.<br />
7.4.5 Maximum safe intake of the food or constituent where necessary.<br />
2<br />
Reference to the Scientific Criteria for Health Related Claims being developed by the Codex Committee on Nutrition and Foods for Special Dietary Uses<br />
should be inserted here.
4 Nutrition and Health Claims (CAC/GL 23-1997)<br />
7.4.6 How the food or food constituent fits within the context of the total diet.<br />
7.4.7 A statement on the importance of maintaining a healthy diet.<br />
8. CLAIMS RELATED TO DIETARY GUIDELINES OR HEALTHY DIETS<br />
Claims that relate to dietary guidelines or “healthy diets” should be permitted subject to the following<br />
conditions:<br />
8.1 Only claims related to the pattern of eating contained in dietary guidelines officially recognized by the<br />
appropriate national authority.<br />
8.2 Flexibility in the wording of claims is acceptable, provided the claims remain faithful to the pattern of eating<br />
outlined in the dietary guidelines.<br />
8.3 Claims related to a “healthy diet” or any synonymous term are considered to be claims about the pattern of<br />
eating contained in dietary guidelines and should be consistent with the guidelines.<br />
8.4 Foods which are described as part of a healthy diet, healthy balance, etc., should not be based on selective<br />
consideration of one or more aspects of the food. They should satisfy certain minimum criteria for other major<br />
nutrients related to dietary guidelines.<br />
8.5 Foods should not be described as “healthy” or be represented in a manner that implies that a food in and of<br />
itself will impart health.<br />
8.6 Foods may be described as part of a “healthy diet” provided that the label carries a statement relating the food<br />
to the pattern of eating described in the dietary guidelines.<br />
Table of conditions for nutrient contents<br />
COMPONENT CLAIM CONDITIONS (not more than)<br />
Energy<br />
Fat<br />
Saturated Fat<br />
Cholesterol<br />
Low<br />
40 kcal (170 kJ) per 100 g (solids)<br />
or<br />
20 kcal (80 kJ) per 100 ml (liquids)<br />
Free 4 kcal per 100 ml (liquids)<br />
Low<br />
3 g per 100 g (solids)<br />
1.5 g per 100 ml (liquids)<br />
Free 0.5 g per 100 g (solids) or 100 ml (liquids)<br />
Low 3<br />
Free<br />
Low 3<br />
Free<br />
Sugars Free<br />
1.5 g per 100 g (solids)<br />
0.75 g per 100 ml (liquids)<br />
and 10% of energy<br />
0.1 g per 100 g (solids)<br />
0.1 g per 100 ml (liquids)<br />
0.02 g per 100 g (solids)<br />
0.01 g per 100 ml (liquids)<br />
0.005 g per 100 g (solids)<br />
0.005 g per 100 ml (solids)<br />
and, for both claims, less than:1.5 g saturated fat per 100 g (solids)<br />
0.75 g saturated fat per 100 ml (liquids)<br />
and 10% of energy of saturated fat<br />
0.5 g per 100 g (solids)<br />
0.5 g per 100 ml (liquids)<br />
3<br />
In the case of the claim “low in saturated fat”, trans fatty acids should be taken into account where applicable. This provision consequentially applies to<br />
foods claimed to be “low in cholesterol” and “cholesterol free”.
5 Nutrition and Health Claims (CAC/GL 23-1997)<br />
COMPONENT CLAIM CONDITIONS (not less than)<br />
Sodium<br />
Protein<br />
Vitamins and Minerals<br />
Dietary Fibre<br />
Low 0.12 g per 100 g<br />
Very Low 0.04 g per 100 g<br />
Free 0.005 g per 100 g<br />
Source<br />
10% of NRV per 100 g (solids)<br />
5% of NRV per 100 ml (liquids)<br />
or 5% of NRV per 100 kcal (12% of NRV per 1 MJ)<br />
or 10% of NRV per serving<br />
High 2 times the values for “source”<br />
Source<br />
15% of NRV per 100 g (solids)<br />
7.5% of NRV per100 ml (liquids)<br />
or 5% of NRV per 100 kcal (12% of NRV per 1 MJ)<br />
or 15% of NRV per serving<br />
High 2 times the value for “source”<br />
Source<br />
High<br />
3 g per 100 g 4 or 1.5 g per 100 kcal<br />
or 10 % of daily reference value per serving 5<br />
6 g per 100 g 4 or 3 g per 100 kcal<br />
or 20 % of daily reference value per serving 5<br />
4 Conditions for nutrient content claims for dietary fibre in liquid foods to be determined at national level.<br />
5 Serving size and daily reference value to be determined at national level.