Mercury in Fish 1.45 Mb - Arnika
Mercury in Fish 1.45 Mb - Arnika
Mercury in Fish 1.45 Mb - Arnika

You also want an ePaper? Increase the reach of your titles
YUMPU automatically turns print PDFs into web optimized ePapers that Google loves.
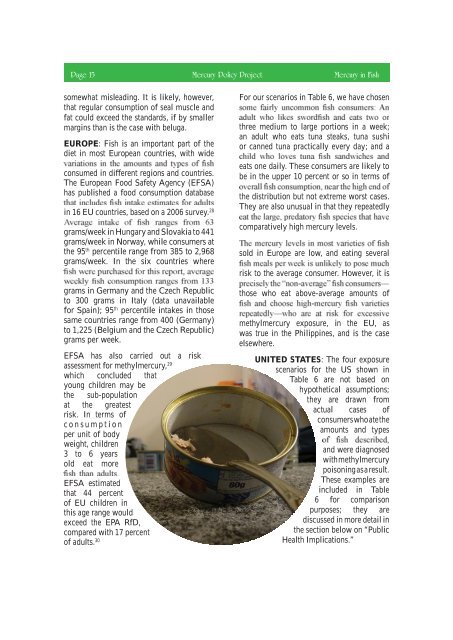
Page 15 <strong>Mercury</strong> Policy Project<br />
<strong>Mercury</strong> <strong>in</strong> <strong>Fish</strong><br />
somewhat mislead<strong>in</strong>g. It is likely, however,<br />
that regular consumption of seal muscle and<br />
fat could exceed the standards, if by smaller<br />
marg<strong>in</strong>s than is the case with beluga.<br />
EUROPE: <strong>Fish</strong> is an important part of the<br />
diet <strong>in</strong> most European countries, with wide<br />
consumed <strong>in</strong> different regions and countries.<br />
The European Food Safety Agency (EFSA)<br />
has published a food consumption database<br />
<strong>in</strong> 16 EU countries, based on a 2006 survey. 28<br />
grams/week <strong>in</strong> Hungary and Slovakia to 441<br />
grams/week <strong>in</strong> Norway, while consumers at<br />
the 95 th percentile range from 385 to 2,968<br />
grams/week. In the six countries where<br />
grams <strong>in</strong> Germany and the Czech Republic<br />
to 300 grams <strong>in</strong> Italy (data unavailable<br />
for Spa<strong>in</strong>); 95 th percentile <strong>in</strong>takes <strong>in</strong> those<br />
same countries range from 400 (Germany)<br />
to 1,225 (Belgium and the Czech Republic)<br />
grams per week.<br />
EFSA has also carried out a risk<br />
assessment for methylmercury, 29<br />
which concluded that<br />
young children may be<br />
the sub-population<br />
at the greatest<br />
risk. In terms of<br />
consumption<br />
per unit of body<br />
weight, children<br />
3 to 6 years<br />
old eat more<br />
EFSA estimated<br />
that 44 percent<br />
of EU children <strong>in</strong><br />
this age range would<br />
exceed the EPA RfD,<br />
compared with 17 percent<br />
of adults. 30<br />
For our scenarios <strong>in</strong> Table 6, we have chosen<br />
three medium to large portions <strong>in</strong> a week;<br />
an adult who eats tuna steaks, tuna sushi<br />
or canned tuna practically every day; and a<br />
eats one daily. These consumers are likely to<br />
be <strong>in</strong> the upper 10 percent or so <strong>in</strong> terms of<br />
the distribution but not extreme worst cases.<br />
They are also unusual <strong>in</strong> that they repeatedly<br />
comparatively high mercury levels.<br />
sold <strong>in</strong> Europe are low, and eat<strong>in</strong>g several<br />
risk to the average consumer. However, it is<br />
those who eat above-average amounts of<br />
methylmercury exposure, <strong>in</strong> the EU, as<br />
was true <strong>in</strong> the Philipp<strong>in</strong>es, and is the case<br />
elsewhere.<br />
UNITED STATES: The four exposure<br />
scenarios for the US shown <strong>in</strong><br />
Table 6 are not based on<br />
hypothetical assumptions;<br />
they are drawn from<br />
actual cases of<br />
consumers who ate the<br />
amounts and types<br />
and were diagnosed<br />
with methylmercury<br />
poison<strong>in</strong>g as a result.<br />
These examples are<br />
<strong>in</strong>cluded <strong>in</strong> Table<br />
6 for comparison<br />
purposes; they are<br />
discussed <strong>in</strong> more detail <strong>in</strong><br />
the section below on “Public<br />
Health Implications.”