environmental setting, water quality, and ecological indicators of
environmental setting, water quality, and ecological indicators of
environmental setting, water quality, and ecological indicators of

Create successful ePaper yourself
Turn your PDF publications into a flip-book with our unique Google optimized e-Paper software.
73<br />
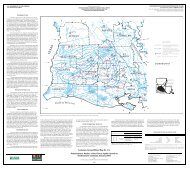
Appendix 9. Loadings <strong>of</strong> <strong>environmental</strong> variables on the first two principal components (PC) derived from principal components analysis (PCA) <strong>of</strong> <strong>ecological</strong><br />
data-collection sites in southwestern Louisiana, 2001<br />
[Environmental variables with boldface values were selected for use in canonical correspondence analysis based on multiple iterations <strong>of</strong> PCA <strong>and</strong>/or considered important for describing <strong>water</strong> <strong>quality</strong><br />
<strong>and</strong> aquatic invertebrate communities in an agricultural l<strong>and</strong>-use <strong>setting</strong> in southwestern Louisiana. mi 2 , square mile; mg/L, milligrams per liter; µS/cm, microsiemens per centimeter at 25 degrees Celsius;<br />
NTU, nephelometric turbidity units; ºC, degrees Celsius; µg/L, micrograms per liter; m, meter; ft/s, feet per second; RBP, Rapid Bioassessment Protocols (Barbour <strong>and</strong> others, 1999)]<br />
Number <strong>and</strong> description <strong>of</strong><br />
<strong>environmental</strong> variable<br />
PC1 PC2 Correlations*<br />
Number <strong>and</strong> description <strong>of</strong><br />
<strong>environmental</strong> variable<br />
* Environmental variables with variable number(s) are correlated with these variables based on a Spearmann-rank correlation test with an alpha value <strong>of</strong> 0.05.<br />
** Separate principal components analysis was performed on stream habitat measurements.<br />
PC1 PC2 Correlations*<br />
SITE CHARACTERISTICS WATER QUALITY (Cont.)<br />
General Herbicides <strong>and</strong> degradation products (Cont.)<br />
1 Drainage basin area (mi 2 ) 0.55 0.42 49, 53 31 Molinate -0.24 0.70 33<br />
2 Rice agriculture by basin (percent) -0.45 0.81 32 Tebuthiuron -0.36 0.49<br />
33 Herbicides, cumulative -0.63 0.68<br />
WATER QUALITY Insecticides <strong>and</strong> degradation products<br />
Physiochemical Data 34 Desulfinyl -0.81 -0.47 35<br />
Dissolved oxygen (mg/L) 35 Fipronil -0.90 -0.31 37, 38<br />
3 Time <strong>of</strong> biological sampling 0.19 0.09 36 Fipronil, maximum -0.76 0.06<br />
4 1-month low -0.32 0.37 37 Sulfide -0.74 -0.43 38<br />
pH 38 Sulfone -0.90 -0.37<br />
5 Time <strong>of</strong> biological sampling -0.53 0.20 6, 9, 10, 15, 27<br />
Specific conductance (µS/cm) STREAM HABITAT**<br />
6 Time <strong>of</strong> biological sampling -0.71 -0.03 9, 10, 13, 15, 27, 66 Quantitative measurements (mean values)<br />
Turbidity (NTU’s) 39 Bank angle (degrees) -0.57 -0.56<br />
7 Time <strong>of</strong> biological sampling -0.79 0.25 18, 24, 28, 44, 48 40 Bank erosion score -0.55 -0.42<br />
Water temperature (°C): 41 Bank height (m) -0.29 -0.83 42<br />
8 Time <strong>of</strong> biological sampling 0.03 0.12 42 Bank stability index -0.29 -0.85<br />
Water-Quality Data (mg/L) 43 Bank vegetative cover (percent availability) -0.66 -0.43<br />
9 Alkalinity (as calcium carbonate) -0.62 0.06 10, 15, 27 44 Euphotic zone depth (m) 0.44 -0.41 48<br />
10 Calcium, dissolved -0.60 -0.04 15, 27 45 Habitat cover (percent availability) 0.49 0.35<br />
Carbon, organic: 46 Open canopy (percent) -0.06 0.66<br />
11 Dissolved -0.01 -0.06 47 Riparian canopy closure (percent) 0.46 0.04<br />
12 Suspended -0.69 0.19 48 Secchi disk depth (m) 0.45 -0.44<br />
13 Chloride, dissolved -0.85 -0.17 19, 20, 21, 25, 27, 35, 38 49 Stream bankfull channel width (m) -0.60 0.73 53<br />
14 Chlorophyll-a (µg/L) -0.63 0.39 50 Stream depth (m) 0.16 0.64 53<br />
15 Magnesium, dissolved -0.60 -0.02 27 51 Stream open angle (degrees) -0.06 0.66<br />
Nitrogen (as N) 52 Stream velocity (ft/s) -0.09 -0.63<br />
16 Ammonia, dissolved -0.38 0.18 24 53 Stream wetted channel width (m) 0.51 0.68<br />
17 Ammonia + organic, dissolved -0.55 -0.16 54 Visual algae growth (percent availability) -0.19 0.13<br />
18 Ammonia + organic, total -0.85 0.09 24, 28, 44, 48 55 Width-to-depth ratio 0.53 -0.05<br />
19 Nitrite, dissolved 0.28 -0.40 20, 21, 25 56 Woody debris (snag, percent availability) 0.23 0.12<br />
20 Nitrate, dissolved -0.73 -0.28 21 Qualitative measurements<br />
21 Nitrite + nitrate, dissolved -0.74 -0.26 25 RBP parameters (each score, 0-20 )<br />
Phosphorus (as P) 57 Bank stability 0.63 0.13<br />
22 Dissolved -0.13 0.15 23 58 Bank vegetation protection 0.61 0.08<br />
23 Ortho, dissolved -0.19 0.21 59 Channel alteration 0.53 -0.40<br />
24 Total -0.80 0.27 44, 48 60 Channel flow status 0.55 0.07<br />
25 Potassium, dissolved -0.79 -0.06 61 Channel sinuosity 0.72 -0.02<br />
26 Silicon, dissolved 0.08 -0.05 62 Instream cover 0.83 -0.04<br />
27 Sodium, dissolved -0.74 0.03 63 Pool substrate characterization 0.80 -0.19<br />
28 Suspended sediments, total -0.85 0.13 44, 48 64 Pool variability 0.63 -0.06<br />
Herbicides <strong>and</strong> degradation products 65 Riparian vegetative zone width 0.52 0.08<br />
29 Atrazine -0.31 0.42 33 66 Sediment deposition 0.55 -0.40<br />
30 Metolachlor -0.30 -0.09 67 RBP total site score (0-200) 0.91 -0.13