journeys - LTA Academy - Land Transport Authority
journeys - LTA Academy - Land Transport Authority
journeys - LTA Academy - Land Transport Authority

Create successful ePaper yourself
Turn your PDF publications into a flip-book with our unique Google optimized e-Paper software.
© 2008 <strong>LTA</strong> <strong>Academy</strong>, <strong>Land</strong> <strong>Transport</strong> <strong>Authority</strong>, Singapore<br />
All rights reserved. No part of this publication may be reproduced, stored or transmitted in any form or by<br />
any means without the prior written permission of the <strong>LTA</strong> <strong>Academy</strong>, <strong>Land</strong> <strong>Transport</strong> <strong>Authority</strong>, Singapore.<br />
The opinions and views expressed in this publication are those of the authors and do not necessarily reflect<br />
the views of the <strong>LTA</strong> <strong>Academy</strong> or the <strong>Land</strong> <strong>Transport</strong> <strong>Authority</strong>, Singapore.<br />
ISSN: 1793-494X<br />
JOURNEYS<br />
Publisher<br />
<strong>LTA</strong> <strong>Academy</strong><br />
<strong>Land</strong> <strong>Transport</strong> <strong>Authority</strong><br />
1 Hampshire Road<br />
Singapore 219428<br />
Editorial Team<br />
Alison Tan<br />
George Sun<br />
Katherine Krummert<br />
Mageret Ely<br />
All feedback, suggestions and contribution of papers for future issues are welcome.<br />
Please address all correspondences to:<br />
JOURNEYS<br />
<strong>LTA</strong> <strong>Academy</strong><br />
<strong>Land</strong> <strong>Transport</strong> <strong>Authority</strong><br />
1 Hampshire Road<br />
Singapore 219428<br />
Fax: 65 6396 1890<br />
Email: JOURNEYS@lta.gov.sg<br />
JOURNEYS is also available online at www.<strong>LTA</strong>academy.gov.sg
Contents<br />
05. Shaping Urban Journeys<br />
YAM Ah Mee<br />
15. What Colour Is Your Journey<br />
Heather WEBSTER<br />
25. Frequency and Connectivity –<br />
Key Drivers of Reform in Urban<br />
Public <strong>Transport</strong> Provision<br />
David HENSHER<br />
34. Benchmarking –<br />
Productivity and Service<br />
Tony M RIDLEY<br />
44. Achieving Sustainable Urban<br />
<strong>Transport</strong><br />
Anthony D MAY<br />
58. Urban <strong>Transport</strong> Patterns in<br />
Selected Canadian and<br />
Korean Cities: A Comparison<br />
KIM Kwang Sik
Foreword<br />
The <strong>LTA</strong> <strong>Academy</strong> was launched in September 2006 as a Division<br />
within the Singapore <strong>Land</strong> <strong>Transport</strong> <strong>Authority</strong>. The <strong>Academy</strong><br />
aims to be a global hub to develop capacity in urban transport<br />
management and development, and for government officials and<br />
transport professionals around the world to tap on Singapore’s<br />
know-how and exchange international best practices.<br />
JOURNEYS is a new biannual publication of the <strong>Academy</strong>. It enables us to showcase and<br />
share urban transport trends, policies, technologies and challenges in different cities.<br />
JOURNEYS will also serve as a key resource to complement and enhance the learning<br />
experience of participants of the <strong>Academy</strong>’s programmes.<br />
This inaugural issue kicks off with our Chief Executive Yam Ah Mee examining the<br />
key challenges that lie ahead for Singapore, and the strategies we are adopting to<br />
ensure that our land transport system continues to support the economy and the<br />
increasingly diverse needs of our people. Key among these strategies is making<br />
public transport a choice mode. The role of public transport in sustainable urban<br />
transport development is indisputable, and our featured authors discuss essential<br />
aspects of improving public transport, such as branding, benchmarking, key reform<br />
drivers, decision-making tools and drawing on the lessons learnt from other cities.<br />
Finally, I would like to thank the authors for their contribution and making this<br />
inaugural issue possible. I look forward to more collaboration as we share urban<br />
transport solutions and strive for a sustainable urban transport system that<br />
contributes to a liveable environment in all of our cities.<br />
Mohinder Singh<br />
Dean<br />
<strong>LTA</strong> <strong>Academy</strong>
Shaping Urban Journeys<br />
YAM Ah Mee<br />
Abstract<br />
Shaping Urban Journeys | YAM Ah Mee<br />
<strong>Land</strong> transport affects everyone. Besides supporting economic growth, land transport<br />
plays an important social role in providing access to amenities and opportunities for the<br />
community. This paper highlights the key strategic thrusts that will shape Singapore’s<br />
land transport policies and development over the next 10-15 years. Our goal is to build<br />
a people-centred land transport system—one that puts the needs of the commuters at<br />
the forefront, while protecting the environment to ensure that Singapore becomes an<br />
even more vibrant and liveable city.<br />
Introduction<br />
Like many major cities around the world, Singapore faces the challenge of meeting<br />
the increasing mobility needs of its people, while at the same time enhancing the<br />
liveability of its urban environment.<br />
Daily travel demand in Singapore is projected to increase by 60%, from<br />
the current 8.9 million <strong>journeys</strong> a day to 14.3 million by 2020. This is due to<br />
an increase in population and tourist arrivals, as well as increased economic<br />
activities generated by a buoyant economy. Being a small and densely built-up<br />
city-state with limited land, it is not sustainable for us to build more roads<br />
indefinitely to cater to the increased travel demand. At the moment, roads<br />
already take up 12% of our land, compared with 15% for housing. Hence, our<br />
transport policies have to make the best use of limited resources to meet the<br />
additional demand.<br />
Besides meeting the travel demand of the masses, our land transport system<br />
must cater to the diverse needs of our people. <strong>Transport</strong> is a basic need and<br />
we must ensure that everyone has access to it—the lower income groups, the<br />
JOURNEYS | Nov 2008<br />
05
06<br />
Shaping Urban Journeys | YAM Ah Mee<br />
elderly, wheelchair users, families with young children and pedestrians. At the<br />
same time, we must take care of the environment for our future generations.<br />
In the light of these challenges, a high reliance on public transport is<br />
fundamental to a sustainable land transport system in a liveable city. As<br />
Mrs Anna Tibaijuka, UN-HABITAT’s Executive Director, said, “Sustainable<br />
urbanization cannot even begin to occur without taking into account the role<br />
public transport plays in securing quality of life in our cities and towns.”<br />
As the result of a year-long comprehensive review, the <strong>Land</strong> <strong>Transport</strong><br />
<strong>Authority</strong> (<strong>LTA</strong>) released the <strong>Land</strong> <strong>Transport</strong> Masterplan: A People-Centred<br />
<strong>Land</strong> <strong>Transport</strong> System 1 earlier this year. The Masterplan spells out 3 strategic<br />
thrusts which will shape the land transport development and policies over<br />
the next 10 to 15 years. These are: Making Public <strong>Transport</strong> A Choice Mode;<br />
Managing Road Usage; and Meeting the Diverse Needs of the People. The end<br />
in mind is a more people-centred land transport system that supports a liveable<br />
and vibrant global city.<br />
Making Public <strong>Transport</strong> A Choice Mode<br />
Public transport is the most efficient people-mover. A mass rapid transit (MRT)<br />
train carries an average of 1,100 passengers at any one time during the peak<br />
period while a single deck bus can carry about 80 passengers. Contrast this<br />
with the average occupancy of about 1.5 persons per car. This means that it<br />
will take more than 50 cars to move 1 bus-load of passengers, and more than<br />
700 cars to move 1 train-load of passengers. Imagine the tremendous strain<br />
on the road network if everyone were to choose to travel by car.<br />
Therefore promoting public<br />
We must plan and build the<br />
transport is our key strategy to<br />
public transport system from our<br />
meet the 60% increase in travel<br />
commuters’ point of view... catering<br />
demand between now and 2020.<br />
to our people’s needs from the time<br />
In the <strong>Land</strong> <strong>Transport</strong> Masterplan,<br />
they leave their homes to the time<br />
we have set a target to increase<br />
they arrive at their destinations.<br />
the public transport modal share<br />
during the morning peak hours from 63% today to 70% by 2020.<br />
JOURNEYS | Nov 2008
Shaping Urban Journeys | YAM Ah Mee<br />
To achieve this, we must plan and build the public transport system from our<br />
commuters’ point of view. This means catering to our people’s needs from the<br />
time they leave their homes to the time they arrive at their destinations. Besides<br />
expanding the system capacity, we will invest in the quality of the public transport<br />
system and services to enhance the total journey experience of commuters and<br />
make public transport a more attractive option.<br />
Enhancing the integration of the public transport network<br />
Today, the bus routes are planned by the public bus operators based largely<br />
on commercial considerations. As a result, we often receive feedback on<br />
circuitous routes and long waiting times. By 2009, <strong>LTA</strong> will take over the<br />
central planning of the bus network. We will adopt a more commuter-centric<br />
approach in planning the bus routes, taking into account the rail and road<br />
infrastructure to improve the integration of the overall transport system.<br />
Feeder bus services will run more direct routes and operate more frequently<br />
to bring commuters quickly to the major transfer hubs—the bus interchanges<br />
and MRT stations.<br />
To complement this,<br />
more integrated transport<br />
hubs, like the ones at Ang<br />
Mo Kio or Toa Payoh (Figure<br />
1), where bus interchanges<br />
are co-located with MRT<br />
stations and commercial<br />
development, will be created.<br />
These integrated hubs<br />
provide greater convenience<br />
Figure 1: Ang Mo Kio Hub<br />
for commuters making transfers between the bus and train. Commuters<br />
can also shop or pick up a drink while waiting for their buses or trains, all<br />
in air-conditioned comfort. The aim is to transform these transport nodes<br />
into fun and exciting places, create more buzz and provide greater comfort<br />
and convenience for the commuters.<br />
JOURNEYS | Nov 2008 07
08<br />
Shaping Urban Journeys | YAM Ah Mee<br />
Expanding the rail network<br />
Given its high carrying capacity, speed and reliability, a comprehensive rail<br />
network is crucial to our efforts to make public transport a mode of choice<br />
for our commuters.<br />
Currently, we have about 138km of rail network. By 2020, we will have<br />
completed three projects now under construction—the Boon Lay Extension,<br />
the Circle Line and Downtown Line. We will also embark on another 4 new<br />
rail projects—the Thomson Line, Eastern Region Line, the Tuas Extension and<br />
the North South Line Extension (Figure 2). This will double the rail network<br />
to 278km by 2020, achieving a rail density of 51km per million persons. This<br />
exceeds today’s rail density in Hong Kong and Tokyo and is comparable to<br />
that in New York and London. What does this mean for our people? There<br />
will be greater connectivity by train and travel times will be reduced. Within<br />
the central area, they will be able to access an MRT station within a short 5minute<br />
walk on average.<br />
Managing Road Usage<br />
Figure 2: Existing and future rail lines<br />
Our second key strategy is to manage the demand for road usage so that traffic<br />
on our roads remains smooth flowing. Congestion results in economic loss as<br />
JOURNEYS | Nov 2008
Shaping Urban Journeys | YAM Ah Mee<br />
well as externalities such as noise and air pollution. Our quality of life will be<br />
affected if daily commute turns into long, arduous <strong>journeys</strong> with constant gridlock<br />
amidst noise and air pollution.<br />
Congestion needs to be managed in a holistic manner. While improving public<br />
transport is key to managing demand on our roads, this alone is not sufficient.<br />
Over the next 15 years, <strong>LTA</strong> will also continue to build new roads to serve new<br />
developments. We have recently opened the new Kallang-Paya Lebar Expressway<br />
to traffic. At 12km with 9km<br />
underground, it is the longest<br />
underground expressway in<br />
Southeast Asia. It provides an<br />
alternative route for residents<br />
in the northeast to reach the<br />
city centre. By 2013, we will<br />
also complete the 5km Marina<br />
Coastal Expressway and by<br />
2020, the 21km North South<br />
Expressway (Figure 3).<br />
However building new roads<br />
alone will not keep our roads smooth<br />
flowing. Additional lanes and new<br />
roads inevitably attract more traffic<br />
which eventually leads to congestion.<br />
Figure 3: Expressway network<br />
Additional lanes and new<br />
roads inevitably attract more<br />
traffic which eventually leads<br />
to congestion.<br />
Hence, we rely on policy tools such as the Vehicle Quota System to control<br />
the growth in vehicle population, and the Electronic Road Pricing (ERP)<br />
system to manage demand on congested roads.<br />
ERP is by far the most effective and direct means of managing congestion.<br />
It causes motorists to be more aware of the cost of congestion to others<br />
as a result of their driving. The aim is to influence the motorist’s decision,<br />
so that he may consider driving during off-peak hours or use alternative<br />
modes of transport. As part of the year-long land transport review, <strong>LTA</strong><br />
has enhanced the ERP system to make it more effective and responsive<br />
JOURNEYS | Nov 2008 09
Shaping Urban Journeys | YAM Ah Mee<br />
to changing traffic conditions. New gantries have also been introduced to<br />
manage the rising congestion in the city area.<br />
Meeting the Diverse Needs of the People<br />
Our third key strategy is to make sure that as our society evolves, our policies<br />
continue to keep in tune with the changing and diverse needs of our people.<br />
Improving accessibility for all<br />
Singapore’s population is ageing. We will improve the accessibility of our<br />
transport system to enable the elderly to remain connected to the community.<br />
At the same time, less mobile groups such as wheelchair users, the visually<br />
impaired as well as the lower income groups, should have access to our land<br />
transport system. This is part of our aim of building a more inclusive society<br />
in Singapore.<br />
Currently, wheelchair-accessible buses and barrier-free facilities in MRT<br />
stations are already available, but more will be done to improve accessibility. By<br />
2010, pedestrian walkways, access to MRT stations, taxi and bus shelters, and<br />
public roads across the island will be barrier-free. By 2020, the public bus fleet<br />
will be fully wheelchair-accessible. Additional lifts will also be installed at MRT<br />
stations so that commuters need not make long detours to look for an entrance<br />
with lift (Figure 4).<br />
As we enhance the quality of our public transport services, we also need to<br />
make sure that public transport remain affordable to the masses, especially the<br />
Figure 4: Accessibility for all<br />
10 JOURNEYS | Nov 2008
Shaping Urban Journeys | YAM Ah Mee<br />
lower income groups. The Government’s policy is to regulate fares to ensure that<br />
public transport remains affordable to the majority. Instead of keeping fares at<br />
artificially low levels, they are allowed to go up in small regular steps to keep pace<br />
with inflation. However, for the lower-income groups who need more help with<br />
their transport costs, more targeted help is available through various government<br />
assistance schemes or community schemes such as the public transport vouchers<br />
that have been given out yearly.<br />
Protecting the environment<br />
<strong>Land</strong> transport plays a significant role in contributing to a high quality and<br />
sustainable living environment, given its wide-ranging impact on air quality,<br />
energy consumption, noise pollution and our urban landscape. Hence we must<br />
consciously design our practices and policies to support environmental objectives.<br />
In addition, <strong>LTA</strong> works closely with other agencies to encourage motorists to<br />
choose cleaner and more energy-efficient vehicles, such as hybrid cars.<br />
We recognize that cycling is an environmentally friendly transport mode<br />
that can link commuters to our public transport network. With the growing<br />
popularity of cycling in Singapore, we will be building more and better bicycle<br />
parking facilities at MRT stations and bus interchanges. A trial will also be<br />
conducted to allow foldable bicycles onboard trains and buses.<br />
A People-Centred System<br />
<strong>Transport</strong> affects people in different<br />
ways. To have a people-centred land<br />
transport system, public feedback<br />
must play an important role as we<br />
formulate and fine-tune our policies.<br />
JOURNEYS | Nov 2008<br />
To have a people-centred land<br />
transport system, public feedback<br />
must play an important role as<br />
we formulate and fine-tune our<br />
policies.<br />
<strong>LTA</strong> regularly engages the public to understand their needs and expectations.<br />
For example, the year-long land transport review has benefited from an extensive<br />
public consultation exercise conducted through various channels—focus group<br />
discussions, online feedback portal and an e-game called the Great <strong>Transport</strong><br />
11
Shaping Urban Journeys | YAM Ah Mee<br />
Challenge 2020. In all, more than 4500 people contributed their time, energy and<br />
ideas to this review.<br />
Besides involving our people in shaping our transport policies, their support<br />
is equally important during the implementation stage. This is especially so given<br />
the major infrastructure works that <strong>LTA</strong> will be undertaking in the next 10 to 15<br />
years and the resulting inconvenience to residents and communities affected by<br />
our works. To this end, we have been actively engaging all stakeholders through<br />
community events, publications, exhibitions, site visits and road shows to keep<br />
them updated of the progress of our projects and seek their feedback.<br />
Our Art in Transit programme provides another channel for <strong>LTA</strong> to engage<br />
the community in producing customised artworks to showcase the unique<br />
culture and history associated with each MRT station. This integration of artwork<br />
and culture with the station design helps to foster greater ownership among<br />
the community and add colour and vibrancy to their daily commute. Examples<br />
include the football imagery on the wall of Stadium Station of the Circle Line<br />
and the flowing Chinese calligraphy built into the platform floor in Chinatown<br />
Station of the North East Line (Figure 5). The Mural Design Competition for<br />
the new Kallang-Paya Lebar Expressway, where<br />
winning mural designs will be installed on KPE<br />
structures, is yet another way to involve the<br />
community and build greater ownership and<br />
support for our initiatives.<br />
A <strong>Land</strong> <strong>Transport</strong> Community Partnership<br />
Division has been established within <strong>LTA</strong> where<br />
dedicated teams are assigned to each constituency<br />
to handle the day-to-day road and traffic<br />
management issues more<br />
effectively, and foster a<br />
closer relationship with the<br />
community. A Community<br />
Outreach Programme was<br />
12 JOURNEYS | Nov 2008<br />
Figure 5: Art in Transit in MRT stations
Shaping Urban Journeys | YAM Ah Mee<br />
also launched to periodically share and discuss land transport policies and plans<br />
with grassroots leaders.<br />
In January this year, <strong>LTA</strong> opened the <strong>Land</strong> <strong>Transport</strong> Gallery which showcases<br />
the development of the Singapore land transport system since 1945. The Gallery<br />
strives to engage our different stakeholders, promote greater awareness of the<br />
intricacies and challenges of land transport policies and encourage an open<br />
exchange of ideas to improve the land transport system.<br />
Through the various engagement efforts, we hope that there will be greater<br />
ownership of the land transport system.<br />
Conclusion<br />
The <strong>Land</strong> <strong>Transport</strong> Masterplan has laid out ambitious goals and the years ahead<br />
will be challenging. Within less than a year from the launch of the Masterplan,<br />
<strong>LTA</strong> has completed several initiatives to improve public transport services. These<br />
include working with the rail operators to increase the frequency of rail services<br />
to reduce passenger loading and provide commuters with a more comfortable<br />
ride; extension of more Full Day Bus Lanes in the city to give buses greater<br />
priority on the roads; expansion of the Premium Bus Service scheme—which<br />
provides better comfort and a more direct journey at higher fares—from about<br />
42 services last year to more than 70 services noww; and introduction of a<br />
common call booking telephone service for taxi services which makes it more<br />
convenient for the public to call for a taxi.<br />
Work on the longer term measures such as taking on the role of central<br />
bus planning and expansion of the rail network is also progressing smoothly.<br />
For example, <strong>LTA</strong> has recently completed the advanced engineering studies<br />
and finalised the alignment of Downtown Line Stage 2, bringing residents in the<br />
north-western area of Singapore one step closer to long-awaited access to the<br />
rail network.<br />
By 2020, Singaporeans will have a more advanced public transport system that<br />
enables them to get to their destination efficiently and safely. Our end in mind is<br />
a land transport system that places the needs of our people firmly in the centre,<br />
and makes it possible for them to enjoy the activities in our vibrant global city.<br />
JOURNEYS | Nov 2008<br />
13
Shaping Urban Journeys | YAM Ah Mee<br />
Notes<br />
1. The full report may be viewed online at http://app.lta.gov.sg/ltmp/index.asp<br />
References<br />
Vuchic, V. R. 1999. <strong>Transport</strong>ation in Livable Cities. Center for Urban Policy Research, New Jersey.<br />
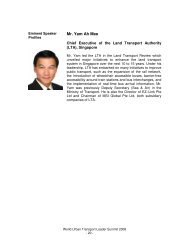
Yam Ah Mee is Chief Executive of the <strong>Land</strong> <strong>Transport</strong> <strong>Authority</strong><br />
(<strong>LTA</strong>), Singapore. He led the <strong>LTA</strong> in the <strong>Land</strong> <strong>Transport</strong> Review which<br />
unveiled major initiatives to enhance the land transport system in<br />
Singapore over the next 10 to 15 years. Under his leadership, <strong>LTA</strong><br />
has embarked on many initiatives to improve public transport, such<br />
as the expansion of the rail network, the introduction of wheelchair-<br />
accessible buses, barrier-free accessibility around train stations and<br />
bus interchanges, and the implementation of real-time bus arrival information. Mr Yam<br />
was previously Deputy Secretary (Sea & Air) in the Ministry of <strong>Transport</strong>. He is also<br />
the Director of EZ–Link Pte Ltd and Chairman of MSI Global Pte Ltd, both subsidiary<br />
companies of <strong>LTA</strong>.<br />
14 JOURNEYS | Nov 2008
What Colour Is Your Journey? | Heather WEBSTER<br />
What Colour Is Your Journey?<br />
Heather WEBSTER<br />
Abstract<br />
This paper looks at the use of colour and branding to position and promote public<br />
transport in Adelaide, South Australia, an extremely competitive transport environment.<br />
Branding is used to ensure that the image of public transport which is presented to<br />
the customer is standard, of high quality and provides the comfort and reassurance of<br />
a known and trusted brand. The same style and themes are repeated in timetables,<br />
kerbside information, websites and advertising to reinforce the brand and build familiarity.<br />
Branding can help achieve the public recognition necessary to meet the worthy aims of<br />
public transport, and attract the resources and support of a community.<br />
Introduction<br />
All around the world, governments invest in public transport in recognition<br />
of the broad benefits it brings to their citizens. These benefits are often<br />
grouped as economic, environmental, social, safety and health benefits. More<br />
importantly, many societies are recognising that well-functioning and accessible<br />
public transport underpins a healthy, equitable and sustainable future for the<br />
cities we would like to live in.<br />
As a community develops and prospers, the demand for travel increases. The<br />
relationships between home, work, family recreation, education and even experiential<br />
travel become more frequent and more complex. Personal travel therefore becomes<br />
an important facilitator, not only of personal well being, but the ability of all people to<br />
contribute to and enjoy the broader wealth of the community.<br />
If we accept, and the evidence is overwhelming, that collective transport<br />
is a more economic and sustainable solution than private travel, the challenge<br />
narrows to positioning public transport to deliver these benefits.<br />
JOURNEYS | Nov 2008<br />
15
What Colour Is Your Journey? | Heather WEBSTER<br />
Like all important problems, the response needs to be well understood,<br />
well thought through and comprehensively delivered. Any effective public<br />
transport system needs to be designed with the knowledge of the shape and<br />
functionality of its city, the needs, aspirations and predilections of its people<br />
and a vision for the future. However, good transport design is not sufficient.<br />
If we are to offer our citizens a public<br />
transport system that is genuinely a<br />
quality part of their lives, I believe we<br />
need to go beyond the conventional<br />
concept of customer service to make<br />
public transport the travel mode of<br />
choice, not just necessity.<br />
This paper looks at one aspect of this approach, namely branding and the<br />
use of colour as basic tools to begin to effectively position and promote public<br />
transport in Adelaide.<br />
Get the Product Right First<br />
Firstly, I offer a word of warning. In marketing terminology, public transport<br />
is a low value, repeat purchase product. We want our customers to make the<br />
choice to purchase our product most, if not all, of the occasions they travel.<br />
This places a strong obligation on the service designers and deliverers to<br />
provide a reliable and predictable product to support repeat purchases. You<br />
might be able to sell a faulty product once, but public transport providers<br />
need to be able to sell this product time after time after time. This means we<br />
not only have a tough job to strive for excellence in service delivery, but we<br />
need to recognise and reward people for routine work of utter predictability.<br />
The ideal may be to deliver exactly the same service, at the same time, every day,<br />
all year.<br />
Marketing cannot compensate for poor<br />
service, poor design or poor delivery. But it<br />
can build awareness, loyalty, appreciation and<br />
16 JOURNEYS | Nov 2008<br />
...we need to go beyond<br />
the conventional concept of<br />
customer service to make<br />
public transport the travel mode<br />
of choice, not just necessity.<br />
Marketing cannot compensate<br />
for poor service, poor design or<br />
poor delivery.
What Colour Is Your Journey? | Heather WEBSTER<br />
increase business on a strong foundation of good service design and good customerfocussed<br />
delivery.<br />
So, task one—get the product right first.<br />
Why Branding?<br />
Before a customer can purchase anything they need to be sufficiently aware<br />
of the product or service to make a choice, and then be motivated to make<br />
a decision. When we began the marketing program in Adelaide, we learned<br />
that many people were generally aware there were public transport services<br />
operating. However they did not have sufficient information to make a decision<br />
to use it, or sufficient incentive to be goaded to make a change from their private<br />
car. While petrol prices and congestion are creating the right environment for<br />
change, lack of information is still one of the important challenges of many<br />
public transport systems. Questions like where do services operate, when,<br />
how do you get and use tickets—all are barriers between potential users and<br />
the system.<br />
The purpose of branding is<br />
to unite and represent all the<br />
information we offer the customer<br />
in a familiar and predictable way to<br />
JOURNEYS | Nov 2008<br />
The brand provides familiarity,<br />
reassurance and hence comfort to<br />
the traveller...<br />
induce them to use and re-use the system. The brand provides familiarity,<br />
reassurance and hence comfort to the traveller, leading to a situation in which<br />
they are likely to choose or use the product more.<br />
Good brands work. We are surrounded by advertising and promotion of<br />
brands which many commercial companies have invested millions of dollars<br />
to develop, protect and promote. That sort of investment is not made and<br />
maintained without detailed research and demonstrable commercial results.<br />
Branding is a concept with which we are all familiar. But what does a brand<br />
mean in public transport?<br />
17
What Colour Is Your Journey? | Heather WEBSTER<br />
Building a Brand Identity<br />
The essence of branding is recognition supported by messages—some direct,<br />
others more subtle. Brands gain power from repeated presentation and frequent<br />
use. In Adelaide, we decided the essence of our brand would be colour, logo<br />
and placement which would be uniformly applied across all the components<br />
of the system. We had built the reliability of the service sufficiently to have a<br />
product worth selling. We had developed a suite of customer information to<br />
assist people to understand the product. Next we needed to build a brand to<br />
increase awareness and product familiarity in order to increase patronage.<br />
So, task two—select your brand identity.<br />
Colour<br />
Colours are very emotive. There is a large body of work on the use of colour<br />
and the emotional responses which are generated by colour. We chose three<br />
colours which would be used together in the same way. At the time of this<br />
choice, we were contracting the provision of services to private sector<br />
companies. One of the major aims of the decision to brand and the choice of<br />
colours was to reassure people that the government was still in control of the<br />
system and that it was a single integrated system even though services might<br />
be delivered by different providers. This was achieved by two strategies. The<br />
first was the choice of colours. The second was to have a strong brand based<br />
on a single logo and uniform application across the system.<br />
The colours chosen are those used by the state government as part of their<br />
branding—yellow, red and blue. These are also the colours of our first football<br />
club to join the national league. So the choice of colour already carries two<br />
messages—state ownership and state pride in one of our national passions.<br />
Another advantage of the colours is strength—these are bold, obvious primary<br />
colours. Yellow is the safest colour on the road. It is most easily seen at dawn<br />
and dusk, or during rain. It is the colour which can be seen at the longest<br />
distance by people with vision impairments. So there are many positives.<br />
18 JOURNEYS | Nov 2008
Creating a Standard Look and Feel<br />
Branding takes the colour choice<br />
and combines it with logo, text and<br />
placement to contribute to a standard<br />
look and feel across all elements of the<br />
system. The task is to use the colours<br />
and styles in prescribed ways across the<br />
entire public transport system.<br />
This covers vehicle livery (Figure 1),<br />
infrastructure, customer information<br />
and all advertising and promotion<br />
JOURNEYS | Nov 2008<br />
What Colour Is Your Journey? | Heather WEBSTER<br />
Figure 1: Livery for Adelaide Metro vehicles<br />
showing uniform branding<br />
materials. The development and effective use of a brand relies on its<br />
controlled and repeated use in predictable ways. Not only does this give<br />
the customer a regular and standard view, it also prevents misuse and brand<br />
diffusion or confusion.<br />
The implementation of standard branding is<br />
best achieved by tight control and prescription.<br />
A style guide showing examples, exact colours,<br />
positioning of colour, information and the use of<br />
text is essential (Figure 2). The logo needed to<br />
be able to be reproduced effectively in black and<br />
white in every size. Mandate its use to ensure<br />
absolute uniformity. This is important, not as an<br />
expression of control, but to ensure that the face<br />
Figure 2: Style Guide<br />
which is presented to the customer is standard,<br />
of high quality and provides the comfort and reassurance that familiarity of a<br />
known and trusted brand brings.<br />
The elements which contribute to the totality of the communication<br />
environment in which a brand is used include not only the livery of vehicles<br />
but the placement of information signs, warnings (for example, the presence of<br />
video surveillance or road rule guidance on the back of buses) and even<br />
advertising from third parties.<br />
19
What Colour Is Your Journey? | Heather WEBSTER<br />
Branding needs to be repeated and reinforced in all the information which<br />
is provided to customers. Timetables, kerbside information, websites, and<br />
advertising which all reflect the same style and themes build familiarity and<br />
lessen the opportunities for confusion.<br />
Uniform branding can reinforce the<br />
integration across a public transport system.<br />
Whether bus, tram or train, the same<br />
ticketing, the same rules, the same sources<br />
of information are seen to apply. This lessens<br />
the uncertainty for customers.<br />
Branding in Customer Information<br />
Branding in customer information needs to cover many types of information<br />
and communication forms. There are vast amounts of information which needs<br />
to be successfully conveyed in small spaces with the least opportunity for<br />
confusion. The easiest illustration of this concept is the use of universal signs<br />
and symbols. The adoption and use of these has shown benefits which are<br />
being extended to road use in many countries.<br />
While we are making progress, I believe there are still many opportunities for<br />
improved “embedded” information in public transport systems. By embedded,<br />
I mean information which is incorporated in the structure of the system itself<br />
which provides information, often without words. The most obvious examples<br />
of this concept are location signs. So often, a place name is displayed on a<br />
board on posts, forming an obstacle, a target for graffiti or simply a place for<br />
birds to perch with the consequent messiness which needs to be cleaned.<br />
With forethought and imagination, place names can be incorporated into<br />
walls, pavements, bus shelters or rooves. This is not only more efficient and<br />
less costly to maintain, it also provides an opportunity for local communities<br />
to interact with creative people to produce works of not just information use<br />
but also beauty. This can be used to develop not only a canvas for art and<br />
creativity, but a sense of local ownership and pride. It can also be a wonderful<br />
vehicle for engaging young people to develop an affinity and respect for public<br />
20 JOURNEYS | Nov 2008<br />
Uniform branding can<br />
reinforce the integration<br />
across a public transport<br />
system.
What Colour Is Your Journey? | Heather WEBSTER<br />
transport. Figure 3 shows some artwork created for Elizabeth Railway Station<br />
by young artists through Carclew Youth Arts programme.<br />
Figure 3: Mural examples at Elizabeth<br />
Railway Station<br />
Red Goes Faster<br />
Branding and colour coding have been used very successfully in many public<br />
transport systems. Notwithstanding that a proportion of our customers<br />
(particularly men) are colour–blind, colour coding of routes is often used<br />
successfully on public transport. This should not be confused with the use of<br />
colour in branding.<br />
We all know that red means fast. In Adelaide we developed a “Go Zone”<br />
system in which we branded service routes which offered high frequency<br />
services with red poles and red information units. Apart from an opportunity<br />
to market a new concept which offered the attribute most valued by customers,<br />
that is frequency, the “red routes” offered a new way of communication with<br />
customers. The ultimate development of this concept is the elimination of the<br />
need for timetables. While many large public transport systems in the world<br />
JOURNEYS | Nov 2008<br />
21
What Colour Is Your Journey? | Heather WEBSTER<br />
(e.g. the metros in Paris, London) do not need timetables, smaller systems<br />
do. This colour coding allows smaller systems to differentiate the parts<br />
of their systems which offer high frequency. Hence they have no need<br />
for a timetable, unlike other parts of the system for which a timetable is<br />
necessary for efficient travel.<br />
There is a dichotomy in the need and benefit of providing information<br />
about public transport services between areas of high frequency and<br />
low frequency. Routes offering high frequency have the lowest need for<br />
information because high frequency involves low risk of not getting a<br />
service. Customers with access only to low frequency services have the<br />
greatest need for information on service timetable. However, in public<br />
transport, we are attracted to providing services (including facilities and<br />
information) to those areas which will benefit the greatest number of people.<br />
Therefore the tendency is to provide the most information to the parts of<br />
the system which carry the most people, although this group may have the<br />
lowest need for information. Colour coding can offer a highly cost-effective<br />
way of communicating frequency. This allows us to concentrate information<br />
services to those most in need, which is in areas of low service supply.<br />
Is Your Brand Working?<br />
Brands need time and repetition to achieve penetration (public recognition)<br />
in the market. Most public transport systems have many opportunities for<br />
exposing a brand, for example, vehicles, infrastructure, web presence, tickets,<br />
timetables. Indeed every element of the system should be thought of as an<br />
opportunity for achieving recognition and reinforcement of the brand. Brand<br />
recognition alone can have value, especially in multiple element systems<br />
(which most public transport systems are) for which the main purpose of the<br />
brand is the message of unification. For example, all these trains and buses<br />
belong to the same network and can be used together. Brand recognition is<br />
easily measured through focus groups. It must also be protected, for it also<br />
represents a risk if de-valued. Product familiarity (brand recognition) is a key<br />
tool in customer reassurance.<br />
22 JOURNEYS | Nov 2008
What Colour Is Your Journey? | Heather WEBSTER<br />
The value of a strong brand can go well beyond recognition to convey<br />
many emotional and practical messages which can be used to influence<br />
behaviour and build customer loyalty. Again, the value of the brand needs to<br />
be supported by the quality of the product. The basic meanings that should<br />
be associated with public transport systems include safety, reliability and<br />
convenience, but this is not sufficient. The brand can be used to carry new<br />
products, to increase patronage, to encourage loyalty, to be known and dare<br />
I say loved. We need to build the value of the brand and the diversity of<br />
the offerings to be highly valued in our communities. I would argue it is not<br />
sufficient for public transport to be functional or even efficient. If public<br />
transport is to be truly valued and supported to meet the worthy aims of<br />
environmental sustainability, healthy and wealthy communities living in socially<br />
inclusive civilized cities, we need to attract the resources and support of our<br />
communities. To do this, we must be recognised and valued, and the first step<br />
in this process is branding.<br />
Conclusion<br />
As the complexity of our world increases, brands offer familiarity. The<br />
dominance of branded products and franchising demonstrates the power of<br />
these concepts in our modern world. Branding provides the basic tool for<br />
building suites of marketing and promotional products to position public<br />
transport beyond basic functionality to offer a combination of community<br />
and personal service and satisfaction. The latter is an element which car<br />
manufacturers exploit so well in their advertisements. Unless we rise to this<br />
challenge, we face unsustainable cities with sharpening divisions between<br />
transport rich and transport poor. This is a challenge worthy of the best<br />
minds and the hardest work.<br />
JOURNEYS | Nov 2008<br />
23
What Colour Is Your Journey? | Heather WEBSTER<br />
Acknowledgement<br />
I wish to acknowledge the work of Paul Littlejohns, Manager of Customer Information and Business<br />
Development, Public <strong>Transport</strong> Division, DTEI, Adelaide in developing the marketing program for<br />
Adelaide Metro and for his tireless advocacy for a customer focus in Adelaide’s public transport<br />
which has been very important in building patronage.<br />
Heather Webster is the Chair of the International Association of<br />
Public <strong>Transport</strong> Australia/New Zealand (UITP ANZ) and Executive<br />
Director of South Australia’s Public <strong>Transport</strong> Division. She has a<br />
passion for the role of public transport in building civilised cities<br />
for the 21st century. She has had a signifi cant role in developing<br />
partnerships with the private sector for service delivery and systems<br />
with the focus on the passengers in Adelaide. Improving the<br />
information available to customers and reducing the barriers that deter users have been<br />
prime strategies in her approach that has delivered consistent growth in patronage against<br />
a negative trend. Ms Heather has degrees in science and librarianship and an MBA.<br />
24 JOURNEYS | Nov 2008
Frequency and Connectivity<br />
Key Drivers of Reform in Urban<br />
Public <strong>Transport</strong> Provision<br />
David HENSHER<br />
Abstract<br />
Frequency and Connectivity | David HENSHER<br />
The selection of appropriate public transport investments that will maximize the<br />
likelihood of delivering the levels of service required to provide a serious alternative to<br />
the automobile is high on the agendas of many metropolitan governments. Mindful of<br />
budget constraints, it is crucial to ensure that such investments offer the greatest value<br />
for money. This paper promotes the view that integrated multi-modal systems that<br />
provide frequency and connectivity in a network-based framework offer the best way<br />
forward. A mix of public transport investments with buses as feeder services and bus<br />
rapid transit (BRT) as trunk services can offer a greater coverage and frequency than<br />
traditional forms of rail, even at capacity levels often claimed the domain of rail.<br />
Introduction<br />
Cities continue to grow for a whole host of reasons, resulting in levels of<br />
traffic congestion that have rarely been observed in the past. The “predict<br />
and provide” approach, so common with urban transport planning, typically<br />
recommends more road building. This, however, does not contribute in the<br />
long term to delivering sustainable city performance that is close to economic<br />
efficiency and distributive justice objectives. There are many other ways of<br />
supporting these objectives, one of which is improved public transport. This<br />
paper takes a strategic look at what are sensible ways to embody improved<br />
public transport into the complex workings of a city.<br />
JOURNEYS | Nov 2008<br />
25
Frequency and Connectivity | David HENSHER<br />
Public transport investment is being touted as a key springboard for<br />
a sustainable future, especially in large metropolitan areas with growing<br />
populations. Public transport, however, is very much multi-modal and should not<br />
be seen as a single mode solution as is so often the case with many ideologues.<br />
Hence, any commitment to improve public transport has a growing number of<br />
options to pursue. Enhancement in rail systems typically loom dominant in many<br />
strategic statements on urban reform (Sislak 2000; Edwards and Mackett 1996),<br />
ranging from heavy rail to metro rail and light rail. However there is a growing<br />
interest worldwide in making better use of the bus as a primary means of public<br />
transport, and not limited as a service that feeds a rail network (Hensher 1999,<br />
2007; Canadian Urban Transit Association 2004; Callaghan and Vincent 2007).<br />
In establishing a role for public<br />
transport, it should be enshrined in<br />
the motto of delivering “frequency,<br />
connectivity and visibility” that is<br />
value for money in terms of net<br />
social benefit per dollar outlaid.<br />
Connectivity refers to the provision of door-to-door services with minimum<br />
delay and almost seamless interchanges. Visibility is predominantly knowing<br />
where the mode is coming from and going to, and when.<br />
There are many ways in which bus transport can be developed as part of an<br />
integrated network-based public transport system (Hensher 2007a). The BRT<br />
systems in South America such as that in Curitiba, Brazil and TransMilenio in<br />
Bogota, Colombia (Menckhoff 2005) are good examples. BRT is “...a high quality<br />
bus-based transit system that delivers fast, comfortable, and cost-effective urban<br />
mobility through the provision of segregated right-of-way infrastructure, rapid<br />
and frequent operations, and excellent marketing and customer service. BRT<br />
essentially emulates the performance and amenity characteristics of a modern<br />
rail-based transit system but at a fraction of the cost. A BRT system will<br />
typically cost 4 to 20 times less than a light rail transit (LRT) system and 10<br />
to100 times less than a metro system.” (Wright and Hook 2007)<br />
26 JOURNEYS | Nov 2008<br />
In establishing a role for public<br />
transport, it should be enshrined in<br />
the motto of delivering “frequency,<br />
connectivity and visibility” that is<br />
value for money...
The Appeal of Bus Rapid Transit Systems<br />
Achieving connectivity and value for money<br />
JOURNEYS | Nov 2008<br />
Frequency and Connectivity | David HENSHER<br />
Recent research by Callaghan and Vincent (2007) shows the appeal of BRT<br />
when comparing the Orange Line BRT in Los Angeles with the Gold Line LRT<br />
in Pasadena, California, both of which connect to the Red Line subway and<br />
have similar service patterns and length. The BRT is performing considerably<br />
better than the LRT. The latter costs considerably more and carries fewer<br />
riders. Capital costs per average weekday boarding for the BRT is US$16,722<br />
in contrast to US$45,762 for the LRT; cost per revenue service hour for BRT<br />
and LRT are respectively US$243.18 and US$552.54; and cost per passenger<br />
mile are respectively US$0.54 and US$1.08. These are impressive evidence<br />
that a BRT system offers better value for money than an LRT system. Metro<br />
and heavy rail would be even more unattractive within the service capacity<br />
range studied.<br />
Cain et al. (2007) review the lessons that can be learnt from the most successful<br />
BRT system—the TransMilenio—in Bogota, Columbia, and its applicability to the<br />
United States. The most important findings relate to connectivity and network<br />
integrity, reinforcing the view that it is all about networks and not corridors<br />
per se. They suggest that BRT is capable of playing a role in the achievement of a<br />
wide set of objectives such as sustainable accessibility and urban renewal when<br />
implemented as part of a holistic package of integrated strategies. Importantly,<br />
it is the commitment to a network of BRT routes (and not a corridor view of<br />
planning per se) which provides the opportunity to enhance the accessibility<br />
and urban renewal benefits from corridor level to metropolitan-wide level.<br />
The relatively low capital costs have made a network of BRT routes possible<br />
within a relatively short time frame (often within 5 years), with examples such<br />
as Brisbane, Philadelphia and Bogota (Hensher and Golob 2008).<br />
BRT, as a high capacity public transport solution for major corridors, forms<br />
the centrepiece for a fully integrated network of bus-based services. The<br />
connectivity deep into the network’s outer fringes is established through a<br />
hierarchy of feeder and trunk routes, with almost seamless transfer points. While<br />
27
Frequency and Connectivity | David HENSHER<br />
it is true that this can allow for light rail<br />
and heavy rail, the hourly capacity needs<br />
in many jurisdictions are such that rail is<br />
unnecessary given it higher capital costs<br />
(and lower value for money) and greater<br />
lifecycle maintenance and operating<br />
costs. The fully integrated and connected<br />
bus hierarchy can be modified for little<br />
cost as markets change, making it very<br />
adaptable to the preservation of connectivity relevant to patronage throughout<br />
the network.<br />
Increasing capacity through high frequency<br />
Whether BRT is part of a transition strategy to other forms of public transport<br />
or an end in itself should be determined by how the market responds. It is<br />
not uncommon to see BRT promoted as a transition to light rail, metro and<br />
even heavy rail (e.g. in Brisbane and Pittsburgh). This is partly to get something<br />
started within constrained budgets, but to also appease anti-bus groups who<br />
see public transport as singularly rail. What is encouraging is that the success of<br />
many of the BRT systems has resulted in its expansion without the need to go<br />
to a rail solution. Carrying capacities of BRT are increasing all the time, moving<br />
the case solely for rail off many agendas (Figure 1).<br />
Figure 1: Changing capacity of the modes<br />
28 JOURNEYS | Nov 2008<br />
The fully integrated and<br />
connected bus hierarchy can<br />
be modified for little cost as<br />
markets change, making it very<br />
adaptable to the preservation<br />
of connectivity relevant to<br />
patronage throughout the<br />
network.
Infrastructure Costs of BRT Systems<br />
JOURNEYS | Nov 2008<br />
Frequency and Connectivity | David HENSHER<br />
Infrastructure cost is one of the key indicators considered by governments<br />
and the media when debating public transport investment options. The<br />
fi gure below shows that the infrastructure costs for BRT systems can vary<br />
from a high of US$53.2m per kilometre in Boston to a low of US$0.35m<br />
per kilometre in Taipei. The signifi cant range indicates the local nature<br />
of costing. In addition, the range depends upon the individual features<br />
sought within each system, e.g. quality of stations, separation from traffi c.<br />
While such univariate comparisons are somewhat limiting and must be<br />
interpreted in the context of input cost differences across nations, what is<br />
surprising is that the variation does not systematically vary by country or<br />
continent, contrary to initial expectation that input costs might be greater<br />
in developed economies. For example, the 7th most expensive BRT is in<br />
Sao Paulo with the 12th in Bogota, both in Latin America. Although the least<br />
costly systems are typically in Asia and Latin America, Taipei is a relatively<br />
prosperous city with GDP per capita of US$29,500, which compares<br />
favourably with Sydney (US$33,000) and Tokyo (US$35,000). Bogota, in<br />
comparison, has a GDP per capita of US$9,000.<br />
Total infrastructure costs per kilometre for BRT systems (2006 US$m)<br />
29
Frequency and Connectivity | David HENSHER<br />
The so-called natural evolution from a bus in mixed traffi c to heavy rail in<br />
terms of passenger capacity per hour (sitting and standing) is no longer strictly<br />
valid. BRT systems such as the TransMilenio have shown that a BRT system can,<br />
if appropriately confi gured, carry more passengers per hour than many rail<br />
systems. The main trunk corridor in Bogota has maximum peak ridership of<br />
35,000 passengers per hour per direction with recent claims of up to 45,000<br />
passengers with maximum peak headways of 3 minutes (5 minute off-peak<br />
headways), average station dwell time of 25 seconds, with articulated buses<br />
having a carrying capacity of 160 passengers and off-vehicle smartcard fare<br />
payment. Curitiba, the forerunner to Bogota, has a maximum peak ridership of<br />
20,000 passengers per hour per direction. This compares to the busiest rail line<br />
in Sydney, for example, of 14,000 passengers per hour per direction. In general<br />
Hidalgo (2005) states “There is a range, between 20,000 and 40,000 passengers<br />
per hour per direction, in which Metros and HBRT 1 are able to provide similar<br />
capacity. Nevertheless, there are large differences in initial costs: US$5-20 million<br />
per kilometre for HBRT, US$30-160 million per kilometre for Metros”.<br />
Figure 2 shows the peak ridership for 26 systems for which data is available.<br />
The 4 South American systems in Bogota, Sao Paulo, Porto Alegre and Curitiba<br />
have peak ridership of 20,000 or more passengers per hour per direction. This<br />
declines to 12,000 for Seoul, with the majority of systems in the range of 2,000<br />
to 8,000 passengers per hour per direction.<br />
Figure 2: Peak ridership of BRT systems (2006)<br />
30 JOURNEYS | Nov 2008
The Preferred BRT Scenario<br />
JOURNEYS | Nov 2008<br />
Frequency and Connectivity | David HENSHER<br />
There is a significant amount of variation in the specifications of the different<br />
BRT systems. Clearly a preferred scenario would support high commercial<br />
speeds, no operating subsidies (unless they are optimal in an economic welfare<br />
sense), low floor buses with at-level boarding, dedicated corridors with no<br />
interference from other modes, smartcard off-vehicle fare payment, seamless<br />
modal interchange, and minimum access and egress time.<br />
There is no one system that comes close to fulfilling all these conditions.<br />
The Australian and US systems deliver the highest commercial speeds, the<br />
Latin American systems are least dependent on operating subsidies, the<br />
Latin American and European systems dominate the provision of at-level<br />
boarding and alighting, the Latin American systems have been most effective<br />
in eliminating the need for signal priority or grade separation at intersections,<br />
and the Latin American, Asian, and French systems have committed to preboard<br />
fare collection and fare verification. Modal integration at stations is<br />
strongest in Australia, Europe, and USA. Finally, the majority of BRT systems<br />
have stations spaced 500 metres apart on average, although this increases to<br />
over 1.5 kilometres for Australian and US systems, including one in China and<br />
in Holland.<br />
Wright and Hook (2007) have compiled details of many BRT systems to<br />
document the inherent advantages and disadvantages in terms of cost and<br />
performance. With a focus on delivering a cost efficient and service effective<br />
transport system, there are opportunities today to evaluate mixtures of bus<br />
and rail systems that can service the full spectrum of capacity requirements<br />
and patronage demands (Cornwell and Cracknell 1990; Hidalgo 2005; Transit<br />
Cooperative Research Program 2007).<br />
Conclusion<br />
This paper reinforces the need to have a broad view on candidate public<br />
transport systems, designed to deliver network-based frequency and<br />
connectivity, while complying with value for money objectives. It is essential<br />
31
Frequency and Connectivity | David HENSHER<br />
to stop thinking in terms of modes alone, but to think in terms of outcomes,<br />
and only then consider the role of specific modes which are a means to an<br />
end and not an end per se. The emotional debate on bus vs. rail has become<br />
somewhat counter-productive. It is time to focus on the real objective of<br />
providing sustainable transport systems that are the most affordable for the<br />
job at hand.<br />
Notes<br />
1. Hidalgo (2005) refers to high level BRT as HBRT, operating on its own right-of-way with high<br />
quality interchanges, integrated smartcard fare payment and efficient throughput of passengers<br />
alighting and boarding at bus stations.<br />
References<br />
Cain, A., Darido, G., Baltes, M., Rodriguez, P. and Barrios, J. 2007. Applicability of TransMilenio<br />
bus rapid transit system of Bogota, Columbia, to the United States. <strong>Transport</strong>ation Research Record<br />
2034, 45-54.<br />
Canadian Urban Transit Association. 2004. Bus rapid transit: A Canadian perspective. Issues Paper<br />
#10, CUTA, Toronto.<br />
Callaghan, L. and Vincent, W. 2007. Preliminary evaluation of Metro Orange Line bus rapid transit<br />
project. <strong>Transport</strong>ation Research Record 2034, 37-44.<br />
Cornwell, P. and Cracknell, J. 1990. The case for busway transit, PTRC 18th Summer Annual<br />
Meeting, 1990. (This paper is a summary of TRL Research Report 329 and Overseas Road Note 12<br />
of the <strong>Transport</strong> Research Laboratory, Berkshire, UK).<br />
Edwards, M. and Mackett, R. L. 1996. Developing new urban public transport systems: An irrational<br />
decision making process. <strong>Transport</strong> Policy 3, 225-239.<br />
Hensher, D.A. 1999. Bus-based transit way or light rail? Continuing the saga on choice versus blind<br />
commitment. Roads and <strong>Transport</strong> Research 8(3), September 3-21.<br />
Hensher, D.A. 2007. Sustainable public transport systems: Moving towards a value for money and<br />
network-based approach and away from blind commitment. <strong>Transport</strong> Policy 14 (1), 98-102.<br />
Hensher, D.A. 2007a. Bus <strong>Transport</strong>: Economics, Policy and Planning. Research in <strong>Transport</strong>ation<br />
Economics, Volume 18. Elsevier, Oxford.<br />
Hensher, D.A. and Golob, T.F. 2008. Bus rapid transit systems – A comparative assessment.<br />
<strong>Transport</strong>ation 35 (4), 501-518.<br />
Hidalgo, D. 2005. Comparing transit alternatives after recent developments in BRT in Latin America.<br />
Paper presented at the January 2005 <strong>Transport</strong>ation Research Board Annual Meeting, Washington<br />
DC.<br />
32 JOURNEYS | Nov 2008
Frequency and Connectivity | David HENSHER<br />
Menckhoff, G. 2005. Latin American experience with bus rapid transit. Paper presented at the Annual<br />
Meeting, Institution of <strong>Transport</strong>ation Engineers, Melbourne, Australia.<br />
Sislak, K.G. 2000. Bus rapid transport as a substitute for light rail: A tail of two cities. Paper presented<br />
at 8th Joint Conference on Light Rail Transit, <strong>Transport</strong>ation Research Board and American Public<br />
<strong>Transport</strong>ation Association. http://www.apta.com/research/info/briefi ngs/documents/sislak.pdf<br />
Transit Cooperative Research Program (TCRP). 2007. Bus Rapid Transit Practitioner’s Guide. TCRP<br />
Report 118. <strong>Transport</strong>ation Research Board, Washington DC.<br />
Wright, L. and Hook, W. 2007. Bus Rapid Transit Planning Guide, 3rd edition. Institute for<br />
<strong>Transport</strong>ation and Development Policy, New York.<br />
David Hensher is a Professor of Management, and Founding Director<br />
of the Institute of <strong>Transport</strong> and Logistics Studies at the University of<br />
Sydney, Australia. He is a Fellow of the <strong>Academy</strong> of Social Sciences<br />
in Australia, recipient of the 2006 Engineers Australia <strong>Transport</strong><br />
Medal for lifelong contribution to transportation, past President of the<br />
International Association of Travel Behaviour Research and a Vice-Chair<br />
of the International Scientifi c Committee of the World Conference of<br />
<strong>Transport</strong> Research. Professor Hensher is the Executive Chair and Co-Founder of The<br />
International Conference in Competition and Ownership of <strong>Land</strong> Passenger <strong>Transport</strong> (the<br />
Thredbo Series), now in its 18th year. He is also on the editorial boards of 10 of the leading<br />
transport journals and Area Editor of <strong>Transport</strong> Reviews.<br />
JOURNEYS | Nov 2008<br />
33
Benchmarking | Tony M RIDLEY<br />
Benchmarking<br />
Productivity and Service<br />
Tony M RIDLEY<br />
Abstract<br />
This paper discusses productivity and service in metros. It looks at what is benchmarking,<br />
the processes involved and the key pre-requisites for successful benchmarking. Finally it<br />
emphasizes the importance of the concepts of service, efficiency and effectiveness and<br />
how they contribute towards a metro’s performance.<br />
My First Productivity Comparisons<br />
Some 25 years ago, I was the Chairman of the Finance and Commerce Sub-<br />
Committee of the Metropolitan Railways Committee of the International Union<br />
of Public <strong>Transport</strong> (UITP). I wrote a paper, with Hans Meyer of Hamburg, on<br />
productivity comparisons between metropolitan railways (Ridley and Meyer<br />
1983). We collected data over a five-year period (1977-81) from 26 metros in<br />
order to carry out our analyses. The most detailed analysis was carried out<br />
on the data from Hamburg and London. Many comparisons were made in<br />
the paper that gave insights into the respective performance of the metros in<br />
Hamburg and London (see box story on ‘‘Productivity Comparison between<br />
London and Hamburg”).<br />
Clearly, different systems operate in quite different environments, which<br />
may make simple comparisons invalid. Such examples include the level of<br />
subsidy provided to the operator; the passenger markets in which they operate;<br />
the nature of the labour market; and the extent of capital infrastructure<br />
already in place. However the actual numbers, and the rankings in any ‘‘league<br />
tables” developed, are not the object of the exercise. The essential question<br />
is how we learn from the numbers, the questions that are stimulated by them<br />
34 JOURNEYS | Nov 2008
Benchmarking | Tony M RIDLEY<br />
Productivity Comparison between London and Hamburg<br />
(Ridley and Meyer 1983)<br />
We started with one basic statistic concerning the overall performance<br />
of the metro - passenger revenue/total cost - and then broke it down<br />
into its component parts. This made clear the important fact that a<br />
system that performs well on one criterion may perform much less<br />
well on another.<br />
Two sequences were defined and studied:<br />
• Passenger revenue/total cost<br />
= passenger revenue/passenger km x passenger km/train km x<br />
train km/ total cost<br />
• Train km/total cost<br />
= train km/staff numbers x staff numbers/staff cost x staff cost /<br />
total cost.<br />
Figures for 1981 were then put to each of these ratios. Hamburg was<br />
indexed against London (= 100) and the results for Hamburg were:<br />
• Passenger revenue/passenger km = 31,<br />
i.e. the revenue ratio in Hamburg was 3/10th of that in London<br />
• Passenger km/train km = 122<br />
• Train km/staff numbers = 233<br />
• Staff numbers/staff cost = 89<br />
• Staff cost/total cost = 73<br />
Thus<br />
• Passenger revenue/train km = 31 x 1.22 = 37<br />
• Train km/total cost = 233 x 0.89 x 0.73 = 151<br />
• Passenger revenue/total cost = 37 x1.51 = 56<br />
On the basis of admittedly imperfect data, we concluded that Hamburg<br />
was 63 percent less effective in its revenue earning capability per trainkm<br />
than London. This is not surprising given the much higher fare levels<br />
in London. Hamburg, on the other hand, was 51 percent more effective<br />
in the cost productivity of train running (train km/total cost). There were<br />
many more comparisons in the paper that gave insights into the respective<br />
performance of Hamburg and London.<br />
JOURNEYS | Nov 2008<br />
35
Benchmarking | Tony M RIDLEY<br />
and the self-examination engendered,<br />
leading to improved performance. These<br />
comparisons are much less a question<br />
of competing with others, rather of<br />
competition with oneself.<br />
At that time I was Managing Director of London Underground. To<br />
me, the principal value of the work was to encourage a more searching<br />
examination of our own performance on the Underground, which dates back<br />
to 1863. No amount of special pleading about age, size, tunnel diameter or<br />
corridor length could hide the fact that, on a number of measures, Hamburg<br />
outperformed London.<br />
A visit to Hamburg followed and the lessons learned were built into the<br />
London Underground’s strategic planning process. This focused a whole series<br />
of initiatives that involved changes in the company culture and culminated in<br />
changes in Board structure. The work with Hamburg also formed part of the<br />
basis to develop the case for more investment in the Underground, of which<br />
the latest example is the decision of the UK Government in October 2007 to<br />
proceed with the massive £16 billion Crossrail project – 25 years after it was<br />
first mooted.<br />
Several years after my work with Meyer, after becoming an academic, I<br />
resumed my interest in the topic of the paper we wrote. By this time<br />
‘‘productivity comparisons” had given way to the term ‘‘benchmarking”, now<br />
used worldwide within a variety of disciplines and businesses.<br />
What Is Benchmarking?<br />
In 1989 an employee of the Xerox Corporation in the USA (Camp 1989)<br />
wrote a paper that defined “benchmarking” as the search for industry best<br />
practices that leads to superior performance. Xerox, which had been in<br />
a fierce competitive battle with the Japanese, saw its earlier outstanding<br />
performance being undermined and its market share and profits declining.<br />
Analysis suggested that both their quality and productivity were falling<br />
behind to a frightening extent. Their reaction was to introduce a strategy of<br />
36 JOURNEYS | Nov 2008<br />
These comparisons are much<br />
less a question of competing<br />
with others, rather of competition<br />
with oneself.
Benchmarking | Tony M RIDLEY<br />
“total quality”, based on a study of best practices among their competitors.<br />
Other firms in other industries quickly followed suit.<br />
Benchmarking has been described<br />
(Burgess 2000) as “a structured<br />
approach to finding ways to improve<br />
an organisation’s performance” and/<br />
or “a technique used to target key<br />
areas for improvement in order to<br />
increase productivity, quality, customer<br />
JOURNEYS | Nov 2008<br />
Benchmarking .... “a structured<br />
approach to finding ways to<br />
improve an organisation’s<br />
performance” ... “a technique<br />
used to target key areas for<br />
improvement...”<br />
satisfaction and, where appropriate, competitiveness”. It involves comparing<br />
financial and operational performance with those of others, either internally<br />
between departments or sections, or externally with other organisations.<br />
It is important to recognize what benchmarking is not. It is not about the<br />
creation of league tables. Rather, benchmarking is about stimulating “why”<br />
questions; identifying strengths, weaknesses and trends; setting targets for<br />
improved performance; and, in some cases, it can support dialogues with<br />
government, regulators and other stakeholders (subject to confidentiality).<br />
In many industries today, comparison of business processes lies at the heart<br />
of benchmarking. The need for data collection and comparison can lead to an<br />
erroneous focus on the production of “league tables” showing who is better<br />
than whom. In fact, the essence of benchmarking is to create new attitudes that<br />
will lead to superior, or at least improved, performance. The proper question<br />
is not “how do we look?” but “what shall we do?”. Where any organisation<br />
appears in a “league table” will of course depend on managerial performance,<br />
but it will also depend on history and many other factors.<br />
It is hardly surprising, for example, that Singapore’s Mass Rapid Transit<br />
(MRT) shows superior performance to London Underground when we<br />
consider the age of the Underground, and what the designers of Singapore’s<br />
MRT had learned from the experience of others over the previous century.<br />
The issue is—what lessons can London learn by examining processes in<br />
Singapore or, indeed any other city, and vice-versa? There is much that<br />
managers can learn, but it is also true that no amount of managerial<br />
37
Benchmarking | Tony M RIDLEY<br />
excellence can overcome, for example, neglect of replacement investment<br />
over the years.<br />
It is also the case that, where a series of data is collected and analyzed, one<br />
organisation may be “better” than another on one measure but be “worse”<br />
on a second. Furthermore, an organisation with “superior” performance might<br />
still have much to learn, or at least insights to gain, from an examination of the<br />
processes of others. This is particularly true where its assets are relatively new.<br />
Inspection of the performance of older systems, where replacement has been<br />
neglected, can provide salutary lessons.<br />
Benchmarking “clubs” most often include organisations from the same,<br />
or similar, industries. This is because the processes employed are likely to be<br />
similar and therefore easily comparable. However, lessons can also be learned<br />
across industries. South-West Airlines in the United States reputedly learned<br />
much by studying the rapid turnaround of complex equipment at pit stops in<br />
motor racing. In addition, benchmarking may be carried out by comparison<br />
within an organisation. It is probably easier to arrange but obviously less likely<br />
to bring in the “fresh air” of outside thinking.<br />
Xerox’s benchmarking process has been described as follows:<br />
• Planning - identify what is to be benchmarked, identify comparable<br />
companies, decide data collection methods, and collect data;<br />
• Analysis - identify performance gaps, project future performance level;<br />
• Integration - communicate findings and gain acceptance, establish functional<br />
goals; and<br />
• Action - develop action plans, implement actions and monitor progress,<br />
recalculate benchmarks.<br />
This last step—recalculate<br />
benchmarks—is instructive, with<br />
its emphasis on constant improvement.<br />
Benchmarking is not a one-off action.<br />
Except in the case of internal<br />
comparisons, information will be<br />
shared between competitors who<br />
38 JOURNEYS | Nov 2008<br />
Benchmarking is not a one-off<br />
action. Apart from the inherent<br />
benefit of learning from each<br />
other, this can also help to “grow<br />
the market” through industrywide<br />
improvement.
Benchmarking | Tony M RIDLEY<br />
commit to collaboration for mutual advantage. Apart from the inherent<br />
benefit of learning from each other, this can also help to “grow the market”<br />
through industry-wide improvement.<br />
Successful Benchmarking<br />
A fundamental pre-requisite for successful benchmarking is commitment to<br />
organisational change. Because the management of change requires commitment<br />
and leadership from the top, benchmarking should clearly be seen to have<br />
the support and drive of top management. Hence, it is critical to have strong<br />
commitment from top management to act on any major opportunities for<br />
improvement as they are revealed.<br />
To prevent benchmarking becoming<br />
an academic “snapshot” of how you<br />
are performing, senior management<br />
needs to own the process and be<br />
seen to be steering it.<br />
JOURNEYS | Nov 2008<br />
To prevent benchmarking becoming<br />
an academic “snapshot” of how you<br />
are performing, senior management<br />
needs to own the process and be<br />
seen to be steering it.<br />
To be successful, it is essential that senior managers decide what is the<br />
mission of the organisation. This is crucial to provide all employees with a clear<br />
idea of the objectives that are to be attained. It should be communicated to<br />
everyone in the organisation in clear and unambiguous language.<br />
It is then necessary to translate the mission into critical success factors<br />
(CSFs) and key performance indicators (KPIs). The CSFs provide a focus for<br />
what people will be aiming to achieve to ensure that the mission is successful<br />
within the allotted period, while the KPIs provide targets to assess progress<br />
towards achievement of the CSFs.<br />
To ensure that improvements can be implemented, it is essential that each<br />
CSF and KPI is considered with direct respect to the day-to-day processes that<br />
are carried out. Unless what happens within the processes can be changed<br />
effectively, the likelihood of being able to show that the KPIs have improved<br />
will be reduced. Thus, KPIs should be developed in consultation with those<br />
people who are directly involved in carrying out the processes. Those people<br />
who have direct involvement with the sub-processes, activities and tasks<br />
should also be consulted.<br />
39
Benchmarking | Tony M RIDLEY<br />
Because benchmarking regularly involves partnerships between organisations<br />
that may be competitors, often using confidential information, a high degree of<br />
trust is equally important in ensuring a successful benchmarking. Thus the partners<br />
have to work out a formal method of working.<br />
Finally, it is also crucial that managers understand three aspects of productivity<br />
performance, i.e. those that are:<br />
• Under the control of the organisation;<br />
• Inherent in the cost structure of the industry; and<br />
• Pertain to the particular geographic and economic circumstances that a<br />
metro operates in.<br />
Given that transport is a highly politicized occupation, managers need to<br />
understand these distinctions if only in “self defence” against their masters.<br />
My simplest example of this relates to a comparison of the financial fortunes<br />
of the two metro operators in Hong Kong and Singapore, i.e. Mass Transit<br />
Railway Corporation (MTRC) and SMRT Trains Ltd (SMRT) respectively. Both<br />
Hong Kong and Singapore have world class metro systems. In Hong Kong,<br />
MTRC’s revenue has covered the metro’s operating, maintenance, renewal<br />
and construction costs. In Singapore, construction costs were not covered by<br />
SMRT’s operating revenue. Does this mean that the people in Hong Kong were<br />
somehow better than the people in Singapore? Not at all. The circumstances<br />
are very different, including the urban densities and the different financing<br />
frameworks. The point is that both Hong Kong and Singapore defined their<br />
own objectives in their own context and met them—but importantly, met<br />
them in an affordable way.<br />
Service<br />
All of the discussion so far has focused on what the engineer or the operator<br />
can do to make their system, or their project, more productive or efficient.<br />
But this, on its own, is “old engineering”. Today’s engineers and operators<br />
recognize that the economic concept of supply and demand is essential<br />
to their task. Thus service to the customer becomes paramount. Other<br />
engineers may have to deal with the complexities of steel, concrete, water,<br />
electricity and the like. Those of us in the transport business have to deal<br />
with the most difficult “material” of all—people.<br />
40 JOURNEYS | Nov 2008
We will not satisfy the customer<br />
unless we understand the nature of<br />
the service we provide and what the<br />
customer wants from that service.<br />
Public transport has been moving<br />
along a spectrum in recent years.<br />
JOURNEYS | Nov 2008<br />
Benchmarking | Tony M RIDLEY<br />
Originally the ethos was that of production, but it moved on to that of the<br />
market, whereas now the emphasis is on service (Ridley 1996).<br />
What is a service? It is essentially a process. It is not physical in contrast<br />
to a product, and cannot be stored since it is produced and consumed at<br />
the same time. Another characteristic of a service is that the customer<br />
becomes part of the service process. It has taken some time for engineers,<br />
indeed many operators, to comprehend the crucial differences between<br />
production and service.<br />
If, as I believe, the task of engineers or operators is to “get things done”,<br />
then we need to look at other aspects of productivity and service. We not<br />
only need to get things done “well”, i.e. be efficient, we also need to get the<br />
“right” things done, i.e. be effective. There is a strong tendency to confuse<br />
efficiency and effectiveness. Service efficiency is often the primary concern of<br />
the “government customer” while service effectiveness is clearly of concern<br />
to our “passenger customer”. There is no merit in having efficient, but<br />
ineffective, public transport (because, for example, it is in the wrong place);<br />
nor in an effective, but inefficient, public transport that costs too much but<br />
attracts low ridership.<br />
We will not satisfy the customer<br />
unless we understand the nature<br />
of the service we provide and<br />
what the customer wants from<br />
that service.<br />
If we are to focus on both the government and the passenger customers,<br />
then we must be both efficient and effective and provide a service that is<br />
cost effective, i.e. one that meets customer needs at an affordable price—in<br />
terms of fares or subsidy or both. Service efficiency may be measured by the<br />
level of service output relative to the resource cost of inputs, while service<br />
effectiveness may be measured by the demand for use of the service relative<br />
to the level of service output. A cost effective service has attributes of both.<br />
41
Benchmarking | Tony M RIDLEY<br />
Consider the following service measures:<br />
• Cost effectiveness<br />
- customer demand/ resource cost, say passenger km/ staff numbers<br />
• Service effectiveness<br />
- customer demand/ service output, say passenger km/ train km<br />
• Service efficiency<br />
- service output/ resource cost, say train km/ staff numbers<br />
The relationship between them is indicated by the fact that:<br />
• Passenger km/staff numbers<br />
= passenger km/train km x train km/staff numbers<br />
i.e. Cost effectiveness = Service effectiveness x Service efficiency<br />
A standard measure of system performance is the cost recovery ratio (CRR),<br />
i.e. the ratio of revenue to total cost. But all simple measures represent a<br />
complex combination of other performance measures. A particular CRR<br />
is not necessarily “good” or “bad” since it will be affected by both policy<br />
decisions and managerial performance. Not least, of course, is the fact that<br />
revenue is clearly a function of fares policy. Thus,<br />
CRR (revenue/total cost) =<br />
revenue/passenger km x passenger km/train km x [(train km/staff numbers)/<br />
(staff cost/staff numbers)] x staff cost/total cost<br />
Therein lays the impact of service effectiveness (passenger km/train km)<br />
and efficiency (train km/staff numbers) on the performance of a metro.<br />
Conclusion<br />
An understanding of performance, based on comparisons with others, can bring<br />
great benefits to organisations if they proceed in a measured way. In particular,<br />
they should treat comparison as a self-learning process from which actions<br />
must follow if improvements are to be achieved. Besides making comparison on<br />
technology and production, it is increasingly important to focus on the service<br />
42 JOURNEYS | Nov 2008
Benchmarking | Tony M RIDLEY<br />
that metros provide to the public to ensure the delivery of a cost effective<br />
service which satisfi es both the government and passenger customers.<br />
References<br />
Burgess, S. M. 2000. Benchmarking for best value. Proceedings of the Institution of Civil Engineers,<br />
139(2). Municipal Engineer.<br />
Camp, R. C. 1989. Benchmarking. American Society for Quality Control Press, Milwaukee.<br />
Ridley, T. M. and Meyer, H. 1983. Productivity comparisons between railways. 45th International<br />
Congress, UITP, Rio de Janeiro.<br />
Ridley, T. M. 1996. What is a successful urban transit project? Prof Chin Fung Kee Memorial Lectures<br />
1991-95. Institute of Engineers Malaysia.<br />
Tony M Ridley is an Emeritus Professor of <strong>Transport</strong> Engineering with<br />
Imperial College, London, United Kingdom. He was the Professor of<br />
<strong>Transport</strong> Engineering at Imperial College (1991–1999) and Head of<br />
the Department of Civil and Environmental Engineering (1997–1999).<br />
He has held Managing Director/Chairman/Board Member positions<br />
with the Tyne and Wear Passenger <strong>Transport</strong> Executive, Hong Kong<br />
Mass Transit Railway Corporation, London <strong>Transport</strong>, London<br />
Underground, Docklands Light Railway and Eurotunnel plc.<br />
Professor Ridley was a member of Task Force 10 (Science and Technology) of the<br />
UN Millennium Project, Senior <strong>Transport</strong> Advisor to the London 2012 Olympic bid, and<br />
now a member of the Olympic Development <strong>Authority</strong>’s Independent Dispute Avoidance<br />
Panel. He is the Chairman of the Investments LLP for the Government’s Building Schools<br />
for the Future programme and the Chairman of the Steering Group of the Department for<br />
International Development’s Global <strong>Transport</strong> Knowledge Partnership.<br />
JOURNEYS | Nov 2008<br />
43
44<br />
Achieving Sustainable Urban <strong>Transport</strong> | Anthony D MAY<br />
Achieving Sustainable<br />
Urban <strong>Transport</strong><br />
Anthony D MAY<br />
Abstract<br />
Singapore aspires to have a world class land transport system (<strong>LTA</strong> 1996) and in<br />
many ways it has already achieved one (May 2004). But the goals of governments for<br />
their cities are changing, with an increased emphasis on achieving a sustainable urban<br />
transport system (EC 2007). This paper offers a possible interpretation of this goal,<br />
considers the extent to which cities are currently sustainable, and reviews the barriers<br />
to achieving sustainability. It then looks at ways in which the decision-making process<br />
might be enhanced to achieve more sustainable outcomes and reviews research<br />
evidence on the nature of more sustainable transport strategies. Finally it suggests the<br />
steps which are needed to enable cities to implement such strategies.<br />
Introduction<br />
Many governments are now advocating the development of sustainable urban<br />
transport systems. The European Commission has recently issued a Green<br />
Paper on the pursuit of such a policy for all European cities (EC 2007). But the<br />
concept of sustainability is still being interpreted in widely differing ways, leading<br />
to different policy recommendations. Moreover, where there is agreement<br />
on what constitutes a potentially sustainable transport strategy, as in recent<br />
work by the then European Conference of Ministers of <strong>Transport</strong> (ECMT<br />
2006), there are significant barriers to implementing such strategies. In this<br />
paper we consider how best to interpret the concept of sustainability, review<br />
evidence on the lack of sustainability in European cities, summarise recent<br />
JOURNEYS | Nov 2008
Achieving Sustainable Urban <strong>Transport</strong> | Anthony D MAY<br />
recommendations on sustainable strategies, and outline recent research into<br />
reducing the barriers to implementing such strategies.<br />
The Meaning of Sustainability<br />
The concept of sustainability was introduced by the Brundtland Commission in<br />
1987 as an approach which meets the needs of the current generation without<br />
reducing the ability of future generations to meet their needs (Brundtland<br />
1987). This concept of inter-generational equity remains an important force in<br />
current thinking, with concerns that global warming and fossil fuel depletion<br />
will severely limit our grandchildren’s ability to enjoy the opportunities which<br />
we do.<br />
However, the concept of sustainability has since broadened to one which<br />
encompasses environmental sustainability, social sustainability and economic<br />
sustainability (Lautso et al. 2004). The environmental aspects include the<br />
concerns for the global environment as well as the more immediate local<br />
environmental impacts of transport. The social aspects involve inequities today<br />
between rich and poor, within cities and between countries, but also address<br />
the original Brundtland concern for<br />
future generations. Both of these<br />
are areas in which it is accepted that<br />
enhancements are needed. But those<br />
enhancements will only be affordable if<br />
the economy itself is sustained so that<br />
we can afford such enhancements.<br />
JOURNEYS | Nov 2008<br />
...the concept of sustainability<br />
has since broadened to one<br />
which encompasses environmental<br />
sustainability, social sustainability<br />
and economic sustainability.<br />
Unfortunately, this broadening of the concept has resulted in the term being<br />
used to justify a wide range of differing policies and aspirations. The lack of a<br />
common understanding of the term has also contributed to a lack of coherent<br />
action. It is therefore necessary to define these terms more specifically. An<br />
ECMT report on Sustainable <strong>Transport</strong> Policy (ECMT 2000) identified nine<br />
objectives shown in Table 1. More recently some policy documents have added<br />
security and contributions to education and social policies to the list.<br />
45
46<br />
Achieving Sustainable Urban <strong>Transport</strong> | Anthony D MAY<br />
How Sustainable Are Our Cities Today?<br />
The objectives in Table 1 offer a clearer and more specific definition of sustainable<br />
urban transport, but the terms are still abstract. It is often easier to prompt<br />
action by pointing to the concrete evidence of unsustainability. The European<br />
Commission in its Green Paper on Urban <strong>Transport</strong> (EC 2007) presents such<br />
data for 2005 and the pre-enlargement EU-15.<br />
Table 1: <strong>Transport</strong> objectives and their contributions to sustainability<br />
ECMT <strong>Transport</strong> Objectives<br />
(2000)<br />
JOURNEYS | Nov 2008<br />
Sustainability “leg”<br />
economic social environmental<br />
Improving transport safety ✓ ✓<br />
Creating wealth ✓<br />
Improving access ✓<br />
Reducing congestion ✓ ✓<br />
Reducing severance, fear, intimidation ✓<br />
Protecting landscapes and biodiversity ✓ ✓<br />
Reducing noise ✓<br />
Reducing greenhouse gas emissions ✓<br />
Improving air quality ✓<br />
Congestion was estimated to cost €100billion per year, or over 1% of<br />
GDP, with 80% occurring in urban areas and costs anticipated to double<br />
in a decade. Over 100,000 deaths are brought forward each year by<br />
transport-related pollutants, of which over 70% are generated in urban<br />
areas. Over 20% of the population is exposed to daytime noise levels of<br />
over 65dBA, the threshold beyond which noise has been found to increase<br />
the risk of heart attacks by as much as 20%. German and Dutch research<br />
suggests that between 20,000 and 50,000 deaths might be brought forward<br />
each year as a direct result of traffic noise. Road safety is another area<br />
in which considerable improvements have been made, but there are still<br />
around 13,000 direct fatalities and 210,000 serious injuries each year on<br />
the roads of Europe’s cities. Finally, transport in Europe’s cities accounts
Achieving Sustainable Urban <strong>Transport</strong> | Anthony D MAY<br />
for 14% of all Europe’s CO 2 emissions, a proportion which is expected to<br />
grow substantially, and which is clearly inconsistent with the goal of a 60%<br />
reduction in emissions by 2050.<br />
Indeed, the decision of the Commission to focus on urban transport is<br />
itself an indication of the severity of these problems. The Commission and its<br />
member states had long argued that urban transport is a matter for local and,<br />
at most, national governments, and that under the principle of subsidiarity, the<br />
Commission should not intervene. However, as its Green Paper points out,<br />
with cities accounting for 60% of Europe’s population and 85% of its economy,<br />
such problems are of direct concern to Europe as a whole.<br />
Cities’ Ability to Develop Sustainable <strong>Transport</strong> Strategies<br />
An earlier study by the European Conference of Ministers of <strong>Transport</strong> (ECMT<br />
1995) had already focused attention on the importance of improvements in<br />
public transport, better management of road space and controls on the demand<br />
for car use as the key elements in a sustainable urban transport strategy.<br />
In parallel, two research<br />
programmes also independently<br />
identified the key elements of<br />
a sustainable urban transport<br />
strategy. The EC PROPOLIS project<br />
(Lautso et al. 2004) concluded<br />
that the key contributors were<br />
JOURNEYS | Nov 2008<br />
...improvements in public transport,<br />
better management of road space<br />
and controls on the demand for car<br />
use ... key elements in a sustainable<br />
urban transport strategy.<br />
improvements to public transport services and fares, pricing of urban car<br />
use and more concentrated land use development. A separate UK project<br />
(May et al. 2005b) identified bus frequency increases, fares reductions and<br />
charging for car use, together with low cost improvements in road capacity<br />
as the most effective combinations.<br />
A subsequent review (ECMT 2002), however, concluded that the<br />
implementation of such sustainable transport strategies was “more easily<br />
said than done”. The review highlighted as the principal barriers poor<br />
policy integration and coordination, counterproductive institutional roles,<br />
unsupportive regulatory frameworks, weaknesses in pricing, poor data quality<br />
47
48<br />
Achieving Sustainable Urban <strong>Transport</strong> | Anthony D MAY<br />
and quantity, limited public support and lack of political resolve. This led in<br />
turn to the publication of a set of key messages to national governments, who<br />
were seen as crucial in enabling and supporting local government initiatives<br />
(ECMT 2002).<br />
A follow-up to that study confirmed its findings and identified weaknesses<br />
in the process of policy formulation as a further barrier (ECMT 2006). It sent<br />
a further key message that “national governments should support local or<br />
regional authorities through technical, financial or other means as necessary<br />
and appropriate in the development, appraisal, monitoring and evaluation of<br />
integrated, sustainable, urban travel strategies”.<br />
A subsequent review of four ECMT projects—on accessibility enhancements,<br />
carbon reduction, safety and urban transport—identified similar barriers in all<br />
four areas of policy. It made a series of recommendations for ways in which<br />
governments might address them (May and Crass 2007).<br />
The EC City of Tomorrow research programme, conducted between 2000<br />
and 2005, included a number of projects on land use and transport research<br />
(www.lutr.net) which between them provided valuable advice on the process<br />
of policy formulation. Much of the guidance was encapsulated into a Decision-<br />
Makers’ Guidebook (May et al. 2005a) which was designed to introduce policy<br />
makers, senior professionals and<br />
interest groups to the key stages in<br />
policy making, and to provide advice.<br />
The Guidebook is available on the<br />
website www.konsult.leeds.ac.uk<br />
Its developers acknowledged the<br />
rich diversity of contexts and cultures<br />
in European cities and accepted that<br />
no one approach would be relevant<br />
for all cities. Reflecting this, the<br />
document provides guidance rather<br />
than being prescriptive. However,<br />
the guidance adopts a logical<br />
structure (Figure1) for transport<br />
policy formulation, which readers are<br />
Figure 1: The logical structure for decision making<br />
JOURNEYS | Nov 2008
Achieving Sustainable Urban <strong>Transport</strong> | Anthony D MAY<br />
encouraged to follow. This logical structure starts with a clear statement of<br />
the city’s objectives and an identification of the problems to be tackled. It<br />
uses these to stimulate the identification of possible solutions and overall<br />
strategies, which are developed taking into account the barriers to be<br />
overcome in implementing them. The likely impacts of these strategies are<br />
then predicted and appraised, prior to selecting a preferred approach for<br />
implementation.<br />
The DISTILLATE Research Programme<br />
The challenges which cities face in decision making have formed the focus<br />
of a four-year research programme, funded under the UK Engineering and<br />
Physical Sciences Research Council’s Sustainable Urban Environment initiative.<br />
The programme, DISTILLATE (Design and Implementation Support Tools for<br />
Integrated Local <strong>Land</strong> use, <strong>Transport</strong> and the Environment) was designed to<br />
help overcome those barriers to decision making which were amenable to<br />
research-led solutions. It set itself a vision of helping to achieve a step change in<br />
the way that sustainable urban transport and land use strategies are developed<br />
and delivered.<br />
After an initial scoping study, nine priority research areas which were of<br />
most importance to local government were identified. Seven of these were<br />
selected for funding, and each was encapsulated in one of the seven objectives<br />
of the programme:<br />
1. To document and review the barriers to the delivery of sustainable<br />
strategies;<br />
2. To establish an effective set of core indicators and targets as input to<br />
strategy formulation, forecasting and appraisal;<br />
3. To develop new methods for generating appropriate strategy and scheme<br />
options and for designing integrated strategies;<br />
4. To develop approaches for overcoming the financial barriers to effective<br />
implementation;<br />
5. To enhance existing predictive models to reflect the impact of the<br />
wider range of policy instruments, and to facilitate interactive strategy<br />
development;<br />
JOURNEYS | Nov 2008<br />
49
50<br />
Achieving Sustainable Urban <strong>Transport</strong> | Anthony D MAY<br />
6. To improve the methods used for appraisal to reflect more effectively<br />
the requirements of sustainability; and<br />
7. To support more effective collaboration between agencies responsible for<br />
transport strategy development, both within and between local<br />
authorities.<br />
The next five sections consider some of the outputs from areas 1, 2, 3, 5 and 6<br />
above. Further detail is available from the project website (www.distillate.ac.uk)<br />
and May, Page and Hull (2008).<br />
The initial survey of barriers<br />
A first survey undertaken in September 2004 sought to map out the issues<br />
affecting the delivery of integrated and sustainable transport solutions, and<br />
help develop the more detailed approach to the other programme objectives.<br />
To elicit self-reflection by the respondents, they were asked how “satisfied”<br />
they were about practices within their own authority and how important<br />
a particular issue was to them. A seriousness score was derived from the<br />
product of the importance and satisfaction responses (Hull and Tricker 2005).<br />
The results in Figure 2 show that the most problematic stages are in strategy<br />
option generation, modelling, strategic appraisal, funding, implementation and<br />
monitoring and evaluation.<br />
Figure 2: Problematic stages in the process of transport planning<br />
JOURNEYS | Nov 2008
Achieving Sustainable Urban <strong>Transport</strong> | Anthony D MAY<br />
Subsequently respondents were asked about the importance of different<br />
policy instruments and their satisfaction with their ability to employ them.<br />
Figure 3 shows the resulting seriousness scores, and illustrates the particular<br />
problems with managing bus services, fares, restraint measures and land use<br />
planning. Since these are precisely the policy instruments which the studies<br />
reported above have shown are central to effective sustainable transport<br />
strategies, this is a serious weakness.<br />
Figure 3: Seriousness of challenges in the implementation of transport strategies<br />
Selecting suitable indicators<br />
Monitoring and evaluation was found to be one of the most difficult processes.<br />
Monitoring had become a task carried out to satisfy others rather than, as<br />
suggested in Figure 1, a key input to the policy formulation process. Moreover,<br />
many of the indicators simply measured outputs in terms of actions taken (such<br />
as length of cycle lane) rather than intermediate outcomes (such as growth in<br />
cycling) or final outcomes (such as reductions in congestion or pollution).<br />
In response, the DISTILLATE team has produced three guidebooks (Marsden<br />
et al. 2008a, b, c). The first advises readers on how to design a monitoring<br />
strategy to support sustainable transport goals, such as those listed in Table 1.<br />
It demonstrates the use of a causal flow diagram between interventions (such<br />
JOURNEYS | Nov 2008<br />
51
52<br />
Achieving Sustainable Urban <strong>Transport</strong> | Anthony D MAY<br />
as cycle lanes) and objectives (such as environmental improvement) to identify<br />
the information needed to understand what is happening. It advocates the<br />
use of a combination of intermediate outcome and final outcome indicators<br />
to better understand the impacts of a given strategy. The second guidebook<br />
provides more detailed advice on how to select indicators suitable for a<br />
particular objective, and offers an audit process. The final guidebook broadens<br />
the scope to consider how such monitoring strategies can be extended to<br />
other policy sectors and to regional strategy.<br />
Generating strategic policy options<br />
A study of the UK Local <strong>Transport</strong> Plan process found that cities were typically<br />
not very innovative, placed too much emphasis on supply-side solutions, were<br />
reluctant to use demand management measures and lacked information on<br />
the performance of different solutions (Atkins 2007). The Eddington Report<br />
into transport and the economy recommended that the government should<br />
consider steps to improve option generation in urban areas, so that the right<br />
policies can be brought forward (Eddington 2006).<br />
As a contribution, the DISTILLATE team has developed a strategic option<br />
generation tool that uses the KonSULT library of some 42 transport and<br />
land use policy instruments (www.konsult.leeds.ac.uk). The option generator<br />
enables users to interrogate KonSULT to identify those instruments which are<br />
likely to be most useful in a specified context. The aim is to broaden the range<br />
of policy instruments which are considered, rather than to dictate a particular<br />
approach. Users can focus on their objectives, problems or performance<br />
indicators, specify their relative importance, indicate the overall strategy which<br />
they wish to pursue and identify the context in which they are working. The<br />
option generator then uses the assessment scores for each instrument in<br />
KonSULT to identify those instruments which are likely to contribute most<br />
effectively. Its development is described more fully in Kelly et al. (2008).<br />
JOURNEYS | Nov 2008
Predicting the impacts of alternative solutions<br />
Achieving Sustainable Urban <strong>Transport</strong> | Anthony D MAY<br />
The impacts of many of the policy options are difficult to predict without<br />
access to a model which reflects the complex interactions between demand<br />
and supply. However, many local authorities used limited or no modelling. It<br />
emerged from the DISTILLATE survey that the principal barriers were the<br />
complexity of existing models, lack of skills in using them, failure to understand<br />
and hence to trust their outputs, and inability to model many of the newer<br />
policy instruments.<br />
The DISTILLATE programme has included more demand management<br />
and public transport measures in pre-existing transport and network<br />
models (Shepherd et al. 2008). However its principal contribution was the<br />
enhancement of a simpler strategic land use-transport model, MARS, for use<br />
in strategy development. MARS is capable of analysing policy combinations<br />
at the metropolitan level and assessing their impacts over a 30-year planning<br />
period in less than one minute (Pfaffenbichler et al. 2008). A “flight simulator”<br />
approach has been adopted which allows users to change policies in a simulation<br />
environment with easy to use “slider bars”. Outputs, based on intermediate<br />
and final outcome indicators, can be presented in graphical, tabular and mapbased<br />
formats. In addition an optimisation facility can be used to optimise<br />
a package of policy instruments against a given set of objectives or targets.<br />
Potentially the policy maker can take a package of suggested policy instruments<br />
from KonSULT and decide how best to combine them in a given context. This<br />
facility also enables the planner to look at the impacts of target setting and to<br />
identify potential trajectories for key indicators (Shepherd et al. 2008).<br />
Appraising the performance of policy options<br />
Used effectively, appraisal is invaluable in helping to enhance the design of a<br />
given policy option, to select the best performing of a series of alternative<br />
schemes, and in understanding how a package of policy instruments can best<br />
be combined. Appraisal in all of these cases should be based on the same<br />
outcome indicators as those used earlier in the policy process.<br />
JOURNEYS | Nov 2008<br />
53
54<br />
Achieving Sustainable Urban <strong>Transport</strong> | Anthony D MAY<br />
In practice our local authorities perceived appraisal, whose procedures are<br />
tightly specified in the UK, as a hurdle to be overcome in seeking government<br />
funding, rather than as a design tool in its own right. In particular, they felt that<br />
the outcome of appraisal, with its emphasis on value for money, was inconsistent<br />
with the authority’s underlying objectives. Once again, they found demand<br />
management measures particularly difficult to appraise, but also had problems<br />
with public transport provision and fares, land use policies and smaller schemes<br />
for which they perceived appraisal methods to be too cumbersome.<br />
Against this background, the DISTILLATE team developed a flexible appraisal<br />
method specifically for small schemes and for early stage prioritisation. This<br />
requires local authorities to select indicators based on the guidance outlined<br />
above, score the impact of a given scheme against each indicator and then weight<br />
the indicators to obtain an overall performance score which is consistent with<br />
the authority’s priorities (Jopson et al. 2007). In addition a guidebook has<br />
been produced to suggest ways of overcoming the potential inconsistencies<br />
between the use of indicators, targets and valuation of benefits (May, Page and<br />
Forrester 2008).<br />
Achieving Sustainability<br />
In conclusion, it is important to stress that sustainability must remain an aim, rather<br />
than a measurable goal which we will recognise once we have reached it. We now<br />
have much clearer guidance on what needs to be done to make cities’ transport<br />
systems more sustainable. The key policy instruments are enhancements to public<br />
transport service levels, quality and fares; charging for the externalities caused by<br />
road use; land use plans which are consistent with these two policies; and, potentially,<br />
reallocation of road space to more sustainable modes and intensified use of “soft”<br />
measures which encourage greater use of such modes. Such strategies should be<br />
relatively inexpensive, by avoiding large infrastructure projects and expecting users<br />
to meet many of the costs of the transport system.<br />
But the principal barriers to implementing such strategies are outside the<br />
traditional sphere of transport planners and engineers. Overcoming them<br />
requires a concerted effort on many fronts, including more appropriate<br />
JOURNEYS | Nov 2008
Achieving Sustainable Urban <strong>Transport</strong> | Anthony D MAY<br />
institutional structures, improved policy processes, greater acceptability, better<br />
information and more flexible finance (May and Crass 2007).<br />
Our own work in the DISTILLATE research programme has focused<br />
particularly on improvements in the policy process. It offers methods for<br />
specifying performance indicators, using them to generate more appropriate<br />
policy and strategy options, predicting their impacts interactively using<br />
streamlined predictive models, and appraising them in ways which are<br />
consistent with the city’s objectives. It also provides advice on the more<br />
effective use of finance and the development of partnership working.<br />
However, achieving the step change in policy formulation which DISTILLATE<br />
envisaged will require continued effort to disseminate these enhancements<br />
and to encourage their use.<br />
Acknowledgements<br />
This paper is based on a lecture given as SMRT Professor of <strong>Transport</strong> Policy at Nanyang Technological<br />
University (NTU) in October 2007. The support of SMRT and NTU is gratefully acknowledged. The<br />
research reported was funded by the European Commission, the European Conference of Ministers<br />
of <strong>Transport</strong> and the UK Engineering and Physical Sciences Research Council. Their support and the<br />
contributions of project partners are similarly acknowledged. The responsibility for the opinions and<br />
conclusions drawn in the paper rests solely with the author.<br />
References<br />
Atkins. 2007. Long Term Process and Impact Evaluation of the Local <strong>Transport</strong> Plan Policy: Final<br />
Report. Department for <strong>Transport</strong>, London.<br />
Brundtland, G. et al. 1987. Our common future. Report of the 1987 World Commission on<br />
Environment and Development. OUP, Oxford.<br />
European Commission DG Energy and <strong>Transport</strong>. 2007. Towards a New Culture for Urban Mobility.<br />
DGTREN, Brussels.<br />
European Conference of Ministers of <strong>Transport</strong>. 1995. Urban Travel and Sustainable Development.<br />
OECD, Paris.<br />
European Conference of Ministers of <strong>Transport</strong>. 2000. Sustainable <strong>Transport</strong> Policies. OECD, Paris.<br />
European Conference of Ministers of <strong>Transport</strong>. 2002. Implementing Sustainable Urban Travel<br />
Policies. OECD, Paris.<br />
JOURNEYS | Nov 2008<br />
55
56<br />
Achieving Sustainable Urban <strong>Transport</strong> | Anthony D MAY<br />
European Conference of Ministers of <strong>Transport</strong>. 2006. Sustainable Urban Travel: Implementing<br />
Sustainable Uban Travel Policies: Applying the 2001 Key Messages. OECD, Paris.<br />
Eddington, Sir Rod. 2006. The Eddington Report. Department for <strong>Transport</strong>, London.<br />
Hull, A. D. and Tricker, R. 2005. Sustainable urban environments: Assessing the barriers to sustainable<br />
transport. Engineering Sustainability, 2005, 158, pp. 171-180.<br />
Jopson, A. F., Menaz, B. and Page, M. 2007. Appraisal: A barrier to sustainable transport? Paper<br />
submitted to the 11th World Conference of <strong>Transport</strong> Research, Berkeley.<br />
Kelly, C. E., May, A. D. and Jopson, A. F. 2008. Option generation tools for sustainable urban<br />
transport strategies. <strong>Transport</strong> Policy (under review).<br />
Lautso, K. et al. 2004. Planning and Research of Policies for <strong>Land</strong> Use and <strong>Transport</strong> for Increasing<br />
Urban Sustainability (PROPOLIS): Final Report to the European Commission. Brussels, EC.<br />
<strong>Land</strong> <strong>Transport</strong> <strong>Authority</strong>. 1996. A World Class <strong>Land</strong> <strong>Transport</strong> System. <strong>LTA</strong>, Singapore.<br />
Marsden, G. R. et al. 2008a. Designing and Monitoring Strategy to Support Sustainable Tansport<br />
Goals. Institute for <strong>Transport</strong> Studies, Leeds.<br />
Marsden, G. R. et al. 2008b. Advice on Selecting Indicators for Sustainable <strong>Transport</strong>. Institute for<br />
<strong>Transport</strong> Studies, Leeds.<br />
Marsden, G. R. et al. 2008c. Monitoring across Sectors and Spatial Levels for Sustainable <strong>Transport</strong>:<br />
A Good Practice Guide. Institute for <strong>Transport</strong> Studies, Leeds.<br />
May, A. D. 2004. Singapore: The development of a world class transport system. <strong>Transport</strong> Reviews<br />
24(1).<br />
May, A. D. et al. 2005a. Developing Sustainable Urban <strong>Land</strong> Use and <strong>Transport</strong> Strategies: A Decision-<br />
Makers’ Guidebook. Institute for <strong>Transport</strong> Studies, Leeds. www.konsult.leeds.ac.uk<br />
May, A. D., Shepherd, S. P., Emberger, G., Ash, A., Zhang, X. and Paulley, N. 2005b. Optimal land use<br />
and transport strategies: Methodology and application to European cities. <strong>Transport</strong>ation Research<br />
Record.<br />
May, A. D. and Crass, M. 2007. Sustainability in transport: Implications for policy makers.<br />
<strong>Transport</strong>ation Research Record.<br />
May, A. D., Page, M. and Forrester, J. 2008. Addressing the inconsistencies in appraisal practice.<br />
Submission to NATA Refresh. www.distillate.ac.uk<br />
May, A. D., Page, M. and Hull, A. D. 2008. Decision support tools for sustainable urban transport.<br />
<strong>Transport</strong> Policy (under review).<br />
Pfaffenbichler, P., Emberger, G. and Shepherd, S. P. 2008. The integrated dynamic land use and<br />
transport model MARS. Networks and Spatial Economics (in press).<br />
Shepherd, S. P. et al. 2008. Overcoming barriers to model use: Conclusions from the DISTILLATE<br />
project. European Journal of <strong>Transport</strong> Infrastructure Research (under review).<br />
JOURNEYS | Nov 2008
Achieving Sustainable Urban <strong>Transport</strong> | Anthony D MAY<br />
Anthony D May is a Research Professor of <strong>Transport</strong> Engineering at<br />
the University of Leeds, United Kingdom. He has been a professor at<br />
Leeds since 1977, where his principal research interests have focused<br />
on urban transport and sustainability. Professor May has over 40<br />
years’ experience in transport planning and traffi c engineering. He has<br />
served as Director of the Institute for <strong>Transport</strong> Studies, Dean of the<br />
Faculty of Engineering and Pro Vice Chancellor for Research. He was<br />
elected to Fellowship of the Royal <strong>Academy</strong> of Engineering in 1995, and awarded the OBE<br />
for services to transport engineering in 2004. Professor May is currently President of the<br />
World Conference on <strong>Transport</strong> Research Society.<br />
JOURNEYS | Nov 2008<br />
57
58<br />
Urban <strong>Transport</strong>ation Patterns | KIM Kwang Sik<br />
Urban <strong>Transport</strong>ation Patterns in<br />
Selected Canadian and Korean<br />
Cities: A Comparison<br />
KIM Kwang Sik<br />
Abstract<br />
This paper compares urban transportation patterns in selected Canadian and Korean<br />
cities. The results of the comparative analysis indicate that in general, cities with higher<br />
population and employment densities, higher transit service provision and lower road<br />
infrastructure supply have lower levels of car ownership and car use, and higher<br />
levels of transit use. The Canadian urban areas are more automobile dependent<br />
with high levels of car ownership. This is likely due to the fact that most Canadian<br />
urban areas developed during a period when car ownership increased rapidly. These<br />
trends supported the development of sprawling, low density, auto-oriented suburbs<br />
where transit services have not been competitive with the automobile, except for trips<br />
downtown. The Korean urban areas, in contrast, have highly dense urban forms with<br />
high levels of transit use, service, ridership and shorter trip lengths. However, Korean<br />
urban areas are suffering from extremely high levels of congestion given their high<br />
density and limited road capacity.<br />
Introduction<br />
Metropolitan areas are becoming more alike in this era of globalization<br />
(Sorensen et al. 2004). A key thesis is whether similarities can be found in<br />
urban cities of different nations, and if so, the cause of those similarities. This<br />
may give evidence of a common urban transportation phenomenon catalyzed<br />
by the globalization of the modern lifestyle.<br />
JOURNEYS | Nov 2008
JOURNEYS | Nov 2008<br />
Urban <strong>Transport</strong>ation Patterns | KIM Kwang Sik<br />
This paper compares the urban transportation patterns in the large<br />
Canadian urban areas of Toronto, Ottawa-Gatineau, Calgary and Vancouver<br />
to the Korean cities of Seoul and Inchon, which are large urban areas in the<br />
capital region of Korea. The study uses a series of indicators developed by the<br />
<strong>Transport</strong>ation Association of Canada and a transportation census from the<br />
Seoul Metropolitan Government. The use of urban indicators is a practical way<br />
to gather and organize data to identify comparative trends and patterns in<br />
urban studies. The indicators also help to describe and measure the differences<br />
and similarities between the Canadian and Korean urban areas.<br />
Population and Employment Characteristics<br />
Table 1 presents population and employment information for each city. Seoul is a<br />
highly dense city with the highest population and employment, and the smallest<br />
land area. The Canadian urban areas are of low population and employment<br />
density, in contrast with Seoul’s density which is 10 to 22 times higher. In<br />
Canadian cities, the trends of urban sprawl, decentralization of population<br />
and employment, and inner city decline evolved over the last three decades<br />
(McCann 1999).<br />
In the case of Seoul, the central area still keeps its function as a dominant<br />
employment centre with strong business, commercial and civic activities. The<br />
Table 1: Patterns of population and employment distribution in Existing Urban Areas (EUAs)<br />
Seoul Inchon Toronto<br />
Ottawa-<br />
Gatineau<br />
Calgary Vancouver<br />
Population 10,469,852 2,320,791 3,970,000 807,555 768,000 1,680,000<br />
Employment 4,045,537 664,108 1,940,000 448,175 390,000 797,000<br />
Population<br />
density<br />
(people/km 2 )<br />
Employment<br />
density<br />
(jobs/km 2 )<br />
17,289 2,428 1,726 786 1,067 1,292<br />
6,680 695 843 436 542 613<br />
<strong>Land</strong> area (km 2 ) 605 956 2,300 1,027 720 1,300<br />
Note: <strong>Transport</strong>ation Association of Canada defines Existing Urban Area (EUA) as currently built-up area which<br />
is a large urban area together with adjacent urban and rural areas that have a high degree of social and<br />
economic integration with the urban core.<br />
59
Urban <strong>Transport</strong>ation Patterns | KIM Kwang Sik<br />
Canadian urban areas, on the other hand, have central cores that have become<br />
areas of high employment concentration but with increasingly significant<br />
residential populations. Many Canadian cities have high levels of downtown<br />
residential population living in condominiums and apartments. This is<br />
particularly true for Toronto and Vancouver, where new, high-density residential<br />
developments have proceeded rapidly while office growth has stagnated. It<br />
can be beneficial to have employment densities close to the pattern of<br />
population density in order to reduce the distance of home to work travel.<br />
The new residential developments<br />
in Canadian cities have tended to<br />
reduce trip lengths, as the new<br />
residents have tended to live and<br />
work downtown, with most walking<br />
to work.<br />
<strong>Transport</strong>ation Supply Patterns<br />
Table 2 provides transportation supply information such as length of arterials,<br />
expressways, and high occupancy vehicle (HOV) lanes. Numbers of automobiles<br />
and transit seat-kilometre per capita in the morning peak hours, and off-street<br />
parking spaces per employee in CBD are also presented.<br />
Table 2: Characteristics of transportation supply<br />
Arterial lane-km per 1,000<br />
capita in EUA<br />
60 JOURNEYS | Nov 2008<br />
It can be beneficial to have<br />
employment densities close to<br />
the pattern of population density<br />
in order to reduce the distance of<br />
home to work travel.<br />
Seoul Inchon Toronto Ottawa-<br />
Gatineau<br />
Calgary Vancouver<br />
0.27 0.30 2.52 3.81 5.22 3.32<br />
Expressway lane-km per<br />
1,000 capita in EUA 0.11 0.09 0.50 0.77 1.74 0.33<br />
HOV lane-km per 100,000<br />
capita in EUA<br />
4.17 2.44 2.34 6.07 N/A 1.85<br />
Automobiles per capita in<br />
EUA 0.21 0.22 0.55 0.57 0.76 0.56<br />
AM peak period transit<br />
seat-km per capita in EUA 0.51 N/A 2.42 2.60 2.07 1.59<br />
Off-street parking spaces<br />
per employee in CBD 1.27 0.23 0.18 0.36 0.51 0.38
JOURNEYS | Nov 2008<br />
Urban <strong>Transport</strong>ation Patterns | KIM Kwang Sik<br />
Canadian cities have a higher road supply than their Korean counterparts.<br />
This is further evidence of the very different urban form of the two groups<br />
of cities. Most Canadian cities have a more dispersed spatial structure with<br />
significant automobile use for peak hour travel and thus higher infrastructure<br />
requirements. The Korean cities, in contrast, have evolved a more compact<br />
form that is highly dependent on public transportation.<br />
While the two groups of cities have taken very different paths to their present<br />
status since the mid 1980s, increasing automobile use in Korea has significantly<br />
changed the urban spatial structure with a growing demand for more road<br />
and parking spaces. High demand for high-rise apartments with cheaper land<br />
values in outlying areas or new towns has contributed to outward movement<br />
of population. This trend suggests that newly developing areas in Korean cities<br />
are becoming more automobile-oriented and need to be carefully managed in<br />
the planning process. This is likely attributed to the fact that the growth rate<br />
of car ownership (3.7% in Seoul and 7.9% in Inchon between 1994 and 2004)<br />
is much greater than the population growth rate (-0.006% in Seoul and 1.6% in<br />
Inchon during the same period). The annual economic growth rates of 7.8% in<br />
Seoul and 8.4% in Inchon between 1995 and 2004 have contributed to rising<br />
car ownership of the Korean cities.<br />
Values of HOV lane-kilometre per capita provide an indication of the priority<br />
of bus- and carpool-exclusive lanes. Ottawa-Gatineau shows the highest HOV<br />
lane-kilometres, followed by Seoul and Inchon. It should be noted that Ottawa-<br />
Gatineau has a transitway system consisting of 26 km of two-way bus-only<br />
roadway and 28 km of bus lanes and bus-only shoulder lanes. Ottawa also has<br />
a short diesel light rail transit (LRT) system using existing track, fully integrated<br />
with the transitway system in terms of fares, schedules and terminals. Calgary<br />
has no HOV lanes but maintains a successful LRT system, as does Vancouver.<br />
Seoul has had exclusive bus lanes on the existing road network since early<br />
1990s to improve the quality of service for bus passengers. The designation of<br />
the bus-only lanes has contributed to a better flow of the bus fleet operating<br />
in and around Seoul.<br />
61
Urban <strong>Transport</strong>ation Patterns | KIM Kwang Sik<br />
Most of the exclusive bus lanes in Seoul used to be along the curb. These<br />
lanes did not function well due to conflicts with other vehicles. Since July 2004<br />
exclusive bus lanes have been constructed in the median of six major corridors<br />
in the outlying parts of the city. These exclusive lanes are restricted to trunkline<br />
buses to maintain high travel speeds and have contributed to faster bus<br />
travel times (SMG 2005). The intent is to continue expanding the lanes on the<br />
main arterial roads in other parts of Seoul.<br />
Comparing car ownership across the urban areas shows an interesting<br />
contrast. Car ownership per capita in the Canadian urban areas is higher<br />
compared to that in Seoul and Inchon. Among the Canadian cities, Calgary<br />
has much higher auto ownership. High auto ownership is generally associated<br />
with a combination of lower densities, lower transit service provision and<br />
higher road supply dedicated to the automobile. Toronto and Vancouver show<br />
relatively lower levels of car ownership and correspondingly higher population<br />
and employment densities.<br />
Table 2 shows the transit seat-kilometre per capita for the morning peak<br />
hour, estimated based on average transit seats and revenues (TAC 1999). These<br />
numbers help to roughly compare the amount of public transportation service<br />
provided in the cities. The high transit supply in the Canadian cities results from<br />
high average trip lengths and the provision of extensive CBD-focused transit<br />
systems such as the Ottawa-Carlton Regional Commission (OC Transpo), the<br />
Toronto Transit Commission (TTC), the Government of Ontario (GO) Transit,<br />
and Calgary Transit.<br />
Seoul’s central business district<br />
has the highest supply of off-street<br />
parking space, whereas Toronto has<br />
the lowest. In the case of Seoul, all<br />
new construction or modification of<br />
all buildings in excess of a certain size<br />
are required to provide underground<br />
parking garages. These garages<br />
account for 81 percent of off-street<br />
parking spaces in Seoul’s central area. Recognising that more available parking<br />
62 JOURNEYS | Nov 2008<br />
Recognising that more available<br />
parking supply encourages greater<br />
car use, Seoul has recently<br />
introduced a policy that limits the<br />
number of parking lots for certain<br />
categories of building and land<br />
use type...
JOURNEYS | Nov 2008<br />
Urban <strong>Transport</strong>ation Patterns | KIM Kwang Sik<br />
supply encourages greater car use, Seoul has recently introduced a policy that<br />
limits the number of parking lots for certain categories of building and land use<br />
type in the central and sub-central areas. However, the tighter parking policy<br />
has not significantly reduced car use or illegal parking in the areas mainly due<br />
to lack of parking enforcement.<br />
In contrast, most Canadian cities have parking policies to actively enforce<br />
tight parking supply in the CBD, although some cities have generous minimum<br />
parking standards. For example, Vancouver has introduced strategies such<br />
as parking maximums, reduced minimums and flexible requirements, and<br />
restriction of principal use facilities in the form of temporary parking operations<br />
(GVRD 1996). Ottawa central area encourages the provision of short-term<br />
parking and discourages long-term parking to sustain a high transit usage (RMOC<br />
1994). Since the mid-1970s, Toronto has limited its parking supply in Downtown<br />
Toronto, with paid parking being the<br />
norm. The city has actively pursued<br />
parking management measures to<br />
reduce the attractiveness of automobile<br />
travel relative to public transit, walking<br />
or cycling.<br />
<strong>Transport</strong>ation Demand Patterns<br />
Toronto ... has actively pursued<br />
parking management measures<br />
to reduce the attractiveness of<br />
automobile travel relative to<br />
public transit...<br />
Table 3 presents transportation demand patterns such as the transit and<br />
automobile modal shares, automobile occupancies, morning peak hour and<br />
24-hour person trips and annual transit rides per capita for the Existing Urban<br />
Areas (EUAs).<br />
Toronto has the highest transit modal shares for trips to and from the<br />
central area in the morning peak period. This may be in part the result of<br />
an extensive CBD oriented transit network which includes the GO Transit<br />
commuter rail system and the Toronto Transit Commission (TTC) subway,<br />
streetcar and bus system.<br />
Seoul and Inchon also show relatively high transit modal shares. The<br />
Korean cities’ transit network includes several subway lines, commuter train<br />
63
Urban <strong>Transport</strong>ation Patterns | KIM Kwang Sik<br />
Table 3 : Characteristics of transportation demand<br />
Seoul Inchon Toronto Ottawa-<br />
Gatineau<br />
64 JOURNEYS | Nov 2008<br />
Calgary Vancouver<br />
AM peak period transit<br />
mode share to/from CBD 51.1 50.9 56.1 32.8 33.1 38.7<br />
AM peak period<br />
automobile mode share<br />
to/from CBD (driver +<br />
passenger)<br />
AM peak period<br />
automobile occupancy<br />
to/from CBD<br />
AM peak period persontrips<br />
per capita for EUA<br />
24-h person trips per<br />
capita for EUA<br />
Annual transit rides per<br />
capita for EUA<br />
25.5 38.7 38.9 55.0 60.9 54.6<br />
1.60 1.63 1.21 1.28 1.30 1.19<br />
0.28 0.30 0.24 0.23 0.26 0.31<br />
2.57 2.08 2.05 2.80 3.71 3.44<br />
376 217 111 102 91 73<br />
and buses. As of 2006, there are 287 km and 22 km of rail transit lines beneath<br />
Seoul and Inchon respectively. There are also 178 km of regional surface rail<br />
linking Seoul with new towns, satellite communities and large cities such as<br />
Inchon and Suwon.<br />
The Seoul Metropolitan Government (SMG) executed an innovative bus<br />
system reform in July 2004 (Pucher et al. 2005; Kim & Dickey 2006). Before<br />
2004 there were 57 bus companies with about 8,000 buses operating<br />
365 conventional bus lines in Seoul. Bus lines were reorganized as trunk,<br />
feeder and circular, and bus numbers were organized into eight areas. The<br />
monopolized route systems were reorganized as a semi-public operation<br />
with a route tendering system to induce competition between bus operators.<br />
The tendering system is based on contracts between Seoul city government<br />
and bus operators. The contract does not allow altering routes, fares and the<br />
subsidy level. A unified fare system was introduced with the development<br />
of a new card system which allows transfers between buses, buses and the<br />
subway, and other public transportation such as the community bus. The bus<br />
reform has increased the number of bus users by 11.2 percent and public<br />
transportation revenues (buses and the subway) by 12.9 percent between<br />
November 2004 and November 2005 (SMG 2005).
JOURNEYS | Nov 2008<br />
Urban <strong>Transport</strong>ation Patterns | KIM Kwang Sik<br />
Comparing the automobile modal share to and from the CBD in the<br />
morning peak period shows that Canadian cities have much higher proportions<br />
than the two Korean cities. This comparison indicates that Canadian urban<br />
areas, except Toronto, have a more car-oriented dispersed urban structure<br />
than the Korean urban areas. While the Toronto area has become increasingly<br />
dispersed, most travel to the CBD continues to use transit because of a<br />
combination of good transit service and limited, expensive parking in the<br />
CBD. As former City of Toronto residents who work downtown move to the<br />
suburban Regional Municipalities, they cease to be TTC subway riders and<br />
become GO Transit commuter rail patrons.<br />
Values of annual transit ridership per capita indicate the average rides on<br />
public transportation for the urban areas. As expected, this is much higher<br />
for Korean cities. This indicates<br />
that the more dense urban form<br />
is able to provide higher transit<br />
service intensity and thus can offer<br />
more frequent service to a greater<br />
number of people. The more<br />
...more dense urban form is able<br />
to provide higher transit service<br />
intensity and thus can offer more<br />
frequent service to a greater<br />
number of people.<br />
compact cities with higher urban densities have higher transit ridership and<br />
lower dependency on car use. This confirms the findings presented by others<br />
(Newman & Kenworthy 1999; Litman 2005).<br />
Among Canadian cities, Toronto and Ottawa-Gatineau have the highest<br />
transit ridership. It can be interpreted that Toronto has relatively high<br />
population and employment densities, and transit-oriented urban form,<br />
particularly in the central area. As mentioned above, Toronto maintains an<br />
extensive network of public transit that plays a role in keeping high levels of<br />
transit service, while limiting automobile use on arterial and express roads.<br />
In the case of Calgary, transit supply has significantly increased over the last<br />
years. However, as a result of road and parking infrastructure provisions<br />
and outward urban expansion, Calgary has experienced the loss of transit<br />
modal share (City of Calgary 1995). Vancouver’s low transit use is partly<br />
because a much higher proportion of downtown workers live in or near the<br />
downtown and walk to/from work, compared to other Canadian cities.<br />
65
Urban <strong>Transport</strong>ation Patterns | KIM Kwang Sik<br />
Discussion and Summary<br />
The findings of this study can be used to suggest the relationships between land<br />
use and transportation, and help policy makers to change or establish policy<br />
measures which might enhance integration of land use and transportation in<br />
support of more sustainable transportation systems.<br />
The study indicates that in general, urban areas with higher population<br />
and employment densities, higher transit service provision and lower road<br />
infrastructure supply have lower levels of car ownership and car use, and<br />
higher levels of transit use. The Canadian urban areas are more automobile<br />
dependent with high levels of car ownership than Korean urban areas. This<br />
is likely due to the fact that most Canadian urban areas developed during<br />
a period when car ownership increased rapidly. These trends supported<br />
the development of sprawling, low density, auto-oriented suburbs where<br />
transit services have not been competitive with the auto, except for trips<br />
to downtown.<br />
The Korean urban areas, in contrast, have highly dense urban forms with<br />
high levels of transit service and ridership and shorter trip lengths. However,<br />
Korean urban areas are suffering from extremely high levels of congestion<br />
given their high density and limited road capacity.<br />
Some Canadian urban areas such as Toronto seems to have the potential<br />
of attaining much higher levels of transit use and lower levels of automobile<br />
use given their land use and transportation planning policies. Toronto has a<br />
higher transit modal share than the Korean cities which have a fraction of the<br />
car ownership and eight times the density. This makes the point of Bernick<br />
and Cervero’s findings (1997: 83): “The biggest benefits come from going from<br />
very low to moderate densities, say from an average of 4 units per acre to 10<br />
to 15 units per acre... Increasing densities to mid- and high-rise apartments<br />
add relatively smaller benefits in terms of trip reduction. One doesn’t need<br />
Hong Kong-like densities to sustain mass transit”. As Kenworthy and Newman<br />
(1994) observed, Toronto is unique in its land use and transportation patterns.<br />
Despite Toronto’s success in achieving relatively high transit use, it still has<br />
much higher auto use than in Korean cities. This is probably because relatively<br />
66 JOURNEYS | Nov 2008
JOURNEYS | Nov 2008<br />
Urban <strong>Transport</strong>ation Patterns | KIM Kwang Sik<br />
few Toronto residents walk to/from work, something that is much more<br />
common in Korean cities.<br />
There is something of a “chicken-and-egg” dilemma with causal statements<br />
about car and transit use, population and employment density. Density seems<br />
to be driving the evolution in urban form and transit modal share but it is<br />
strongly influenced by the mode choices available to the population. However,<br />
Korean urban areas are losing their spatial and transportation efficiencies as<br />
cars become more popular. These patterns may be evolving in the opposite<br />
direction from some Canadian urban areas which are trying to introduce policy<br />
alternatives to car dependence with sustainable urban development schemes<br />
and more sustainable modes of transportation.<br />
It has been argued that urban structure with higher densities will encourage<br />
transit use. However, the data from Toronto show that urban density is not<br />
the only key factor. Likely transit use and rates of car ownership reflect the<br />
patterns of land uses in a city and the availability of competitive transit services.<br />
For example, while many people living in the city can live without a car (25<br />
percent of City of Toronto households do not own a car), because of land use<br />
and transit service factors, about 95 percent of households in the suburban<br />
areas around Toronto own at least one car. Planners and policy makers should<br />
therefore find ways to make car use less attractive or public transportation<br />
use more affordable.<br />
Conclusion<br />
In conclusion, lessons that Korean urban areas and cities in other countries<br />
can learn from Canadian urban areas are to improve air quality by reducing<br />
levels of traffic congestion, support tighter enforcement of parking restrictions<br />
in central areas, and provide more travel choices by building LRT systems<br />
or alternatives to LRT. On the other hand, Korean urban areas show that<br />
higher urban densities with mixed-use development in extended urban areas<br />
and enhancing public transportation use are important. Urban transportation<br />
and land use policy must adopt a fully integrated approach. While excessive<br />
transportation demand resulting in congestion may need to be more closely<br />
67
Urban <strong>Transport</strong>ation Patterns | KIM Kwang Sik<br />
regulated, policy must continue to focus on infrastructure restraints so as to<br />
suppress freedom of mobility through car dependency.<br />
The limitations and comprehensiveness of the indicators used in the study<br />
should be noted. In particular, the data set of indicators did not include all<br />
relevant modes such as rail transit, cycling and walking. The conclusions require<br />
further research or analysis to be of better utility to planners and policy makers.<br />
Subsequent research should move beyond the description of different transit<br />
systems and urban forms, to the implications for planning practice.<br />
References<br />
Bernick, M. & Cevero, R. 1997. Transit Villages in the 21st Century. McGraw-Hill, New York.<br />
City of Calgary. 1995. Calgary <strong>Transport</strong>ation Plan. The City of Calgary.<br />
Greater Vancouver Regional District (GVRD). 1996. A Comprehensive Parking Management Strategy<br />
for Greater Vancouver. Urban Systems Ltd, Vancouver.<br />
Kenworthy, J. & Newman, P. 1994. Toronto: Paradigm regained. Australian Planner, 31(3), 137-147.<br />
Kim, K.S. & Dickey, J. 2006. Role of urban governance in the process of bus system reform in Seoul.<br />
Habitat International, 30, 83-99.<br />
Litman, T. 2005. <strong>Land</strong> use impacts on transport: How land use affects travel behavior. Victoria<br />
<strong>Transport</strong> Policy Institute, Victoria, Canada.<br />
McCann, L. 1999. Suburbs of desire: The suburban landscape of Canadian cities, c. 1900-1950. In<br />
Harris, R. & Larkham, P.J. (Eds.), Changing Suburbs: Foundation, Form and Function (pp. 111-145).<br />
E & Fn Spon, London.<br />
Newman, P. & Kenworthy, J. 1999. Sustainability and Cities: Overcoming Automobile Dependence.<br />
Island Press, Washington, DC.<br />
Pucher, J., Park, H.Y., Kim, M.H. & Song, J.M. 2005. Public transport in Seoul: Meeting the burgeoning<br />
travel demands of a megacity. Public <strong>Transport</strong> International, 54(3), 54-61.<br />
Regional Municipality of Ottawa-Carleton (RMOC). 1994. <strong>Transport</strong>ation in Ottawa-Carleton.<br />
Regional Municipality of Ottawa-Carleton.<br />
Seoul Metropolitan Government (SMG). 2005. Evaluation of public transportation reform. Seoul<br />
Metropolitan Government.<br />
68 JOURNEYS | Nov 2008
JOURNEYS | Nov 2008<br />
Urban <strong>Transport</strong>ation Patterns | KIM Kwang Sik<br />
Sorensen, A., Marcotullio, P.J. & Grant, J. 2004. Towards sustainable cities. In Sorensen, A.,<br />
Marcotullio, P. J. & Grant, J. (Eds.) Towards Sustainable Cities: East Asian, North American and<br />
European Perspectives on Managing Urban Regions (pp. 3-23). Ashgate Publishing Ltd, Aldershot.<br />
<strong>Transport</strong>ation Association of Canada (TAC). 1999. Urban <strong>Transport</strong>ation Indicators Survey #2: Final<br />
Report. <strong>Transport</strong>ation Association of Canada, Toronto.<br />
Kim Kwang Sik is a Professor of Department of Public Administration<br />
and Graduate School of Governance focusing on city planning and<br />
transportation studies and the Director of the Sustainable Urban<br />
Development Institute with Sungkyunkwan University, Korea. Formerly<br />
President of the Korea Society of <strong>Transport</strong>ation, Professor Kim has<br />
served on several Korea/ Seoul transport and planning committees.<br />
He has extensive experience in the areas of bus and taxi reform and<br />
chaired the Citizen Committee that oversaw the Seoul Bus Reform. He currently chairs<br />
Seoul’s Bus <strong>Transport</strong>ation Policy Citizen Committee and Taxi Reform Citizen Committee.<br />
69